Correlation between Z-scores
Supplemental Figure 4
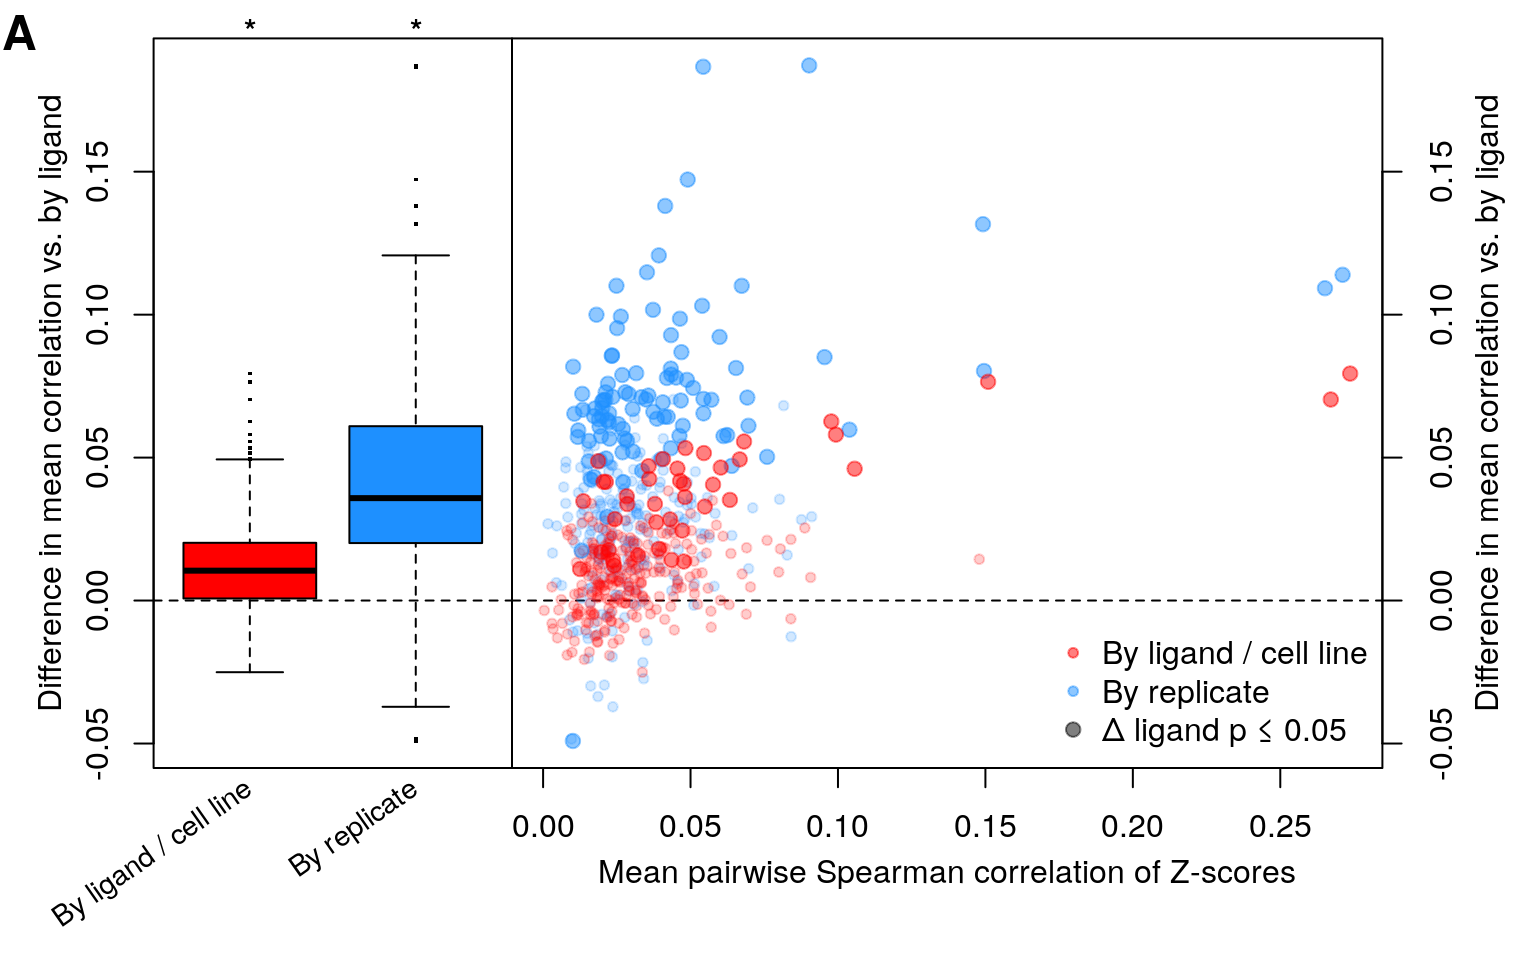
signif(sapply(corr_lvl3,mean),3)## CT LIG LIGCT REP
## 0.845 0.715 0.864 0.878signif(sapply(corr_lvl3,median),3)## CT LIG LIGCT REP
## 0.860 0.707 0.880 0.890signif(sapply(corr_lvl4,mean),3)## CT LIG LIGCT REP
## 0.00354 0.03130 0.04420 0.08230signif(sapply(corr_lvl4,median),3)## CT LIG LIGCT REP
## 0.00121 0.02760 0.03850 0.07200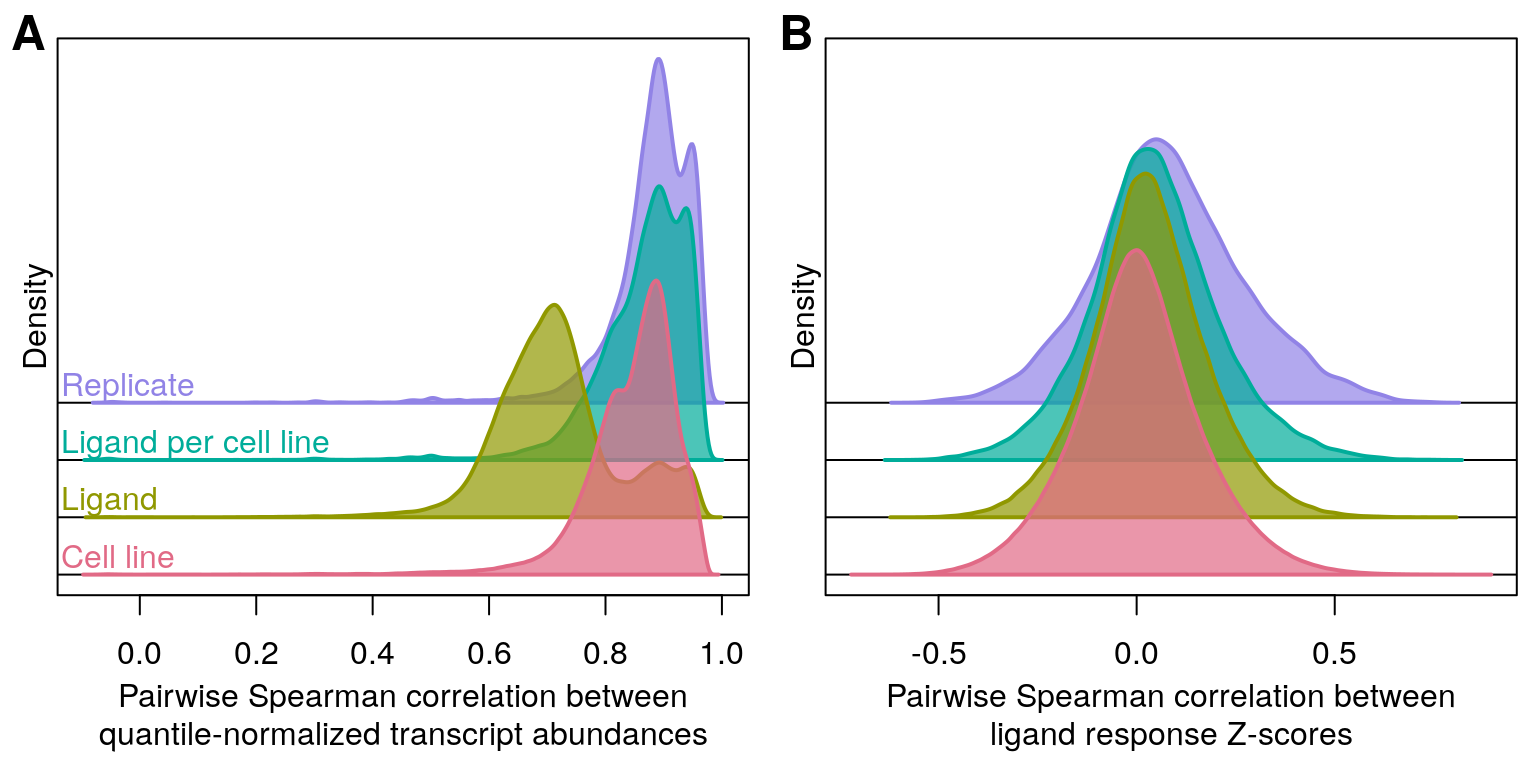
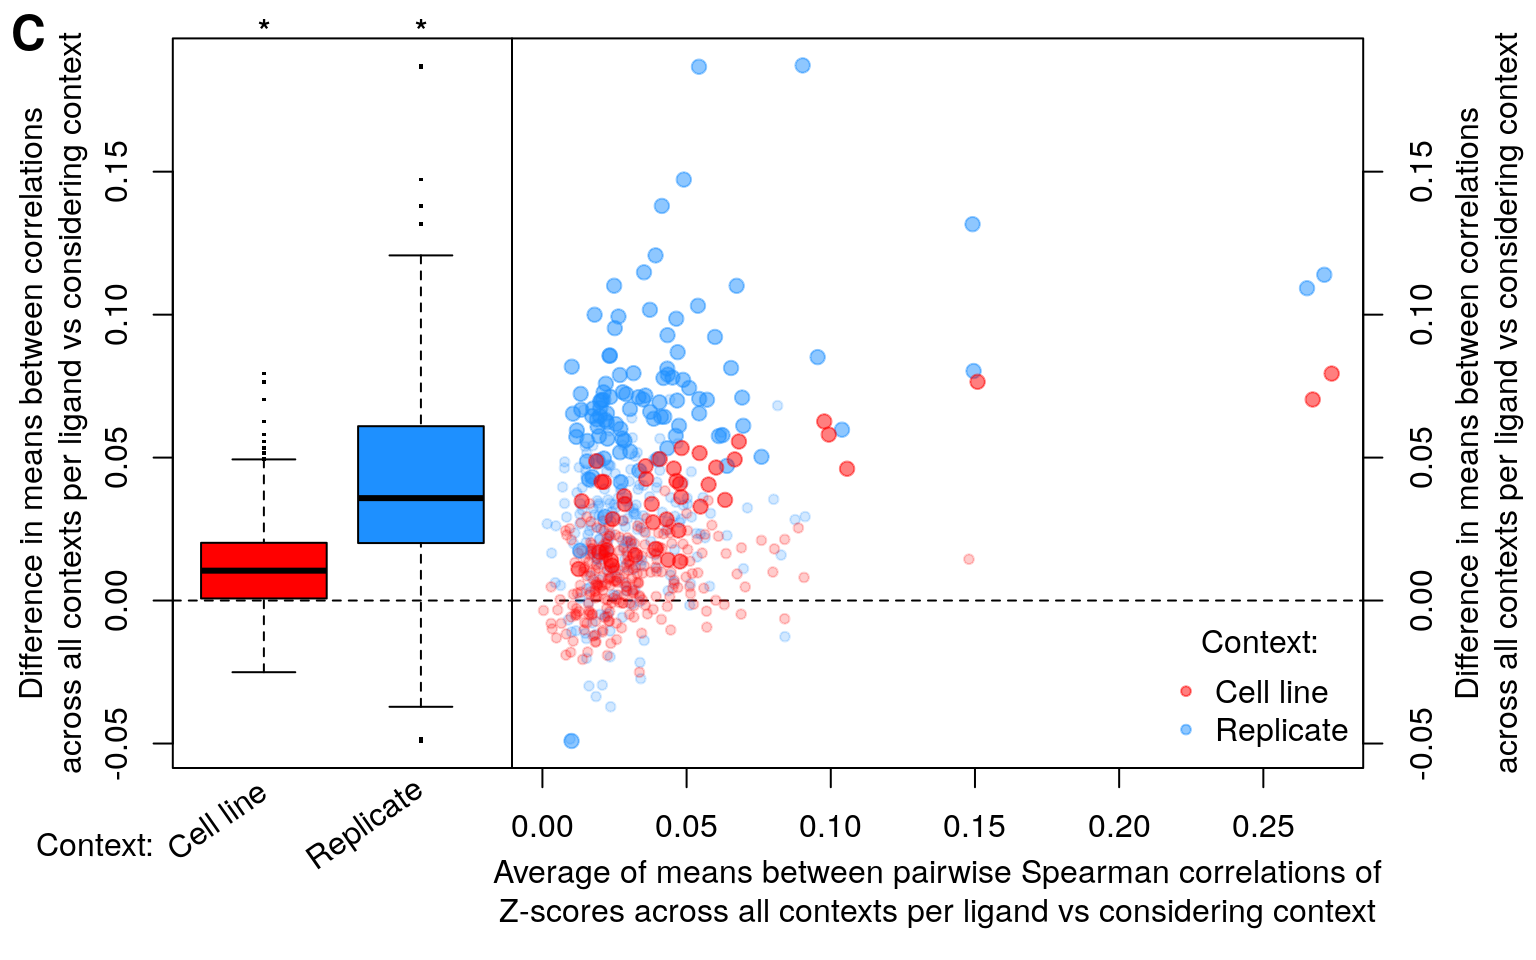
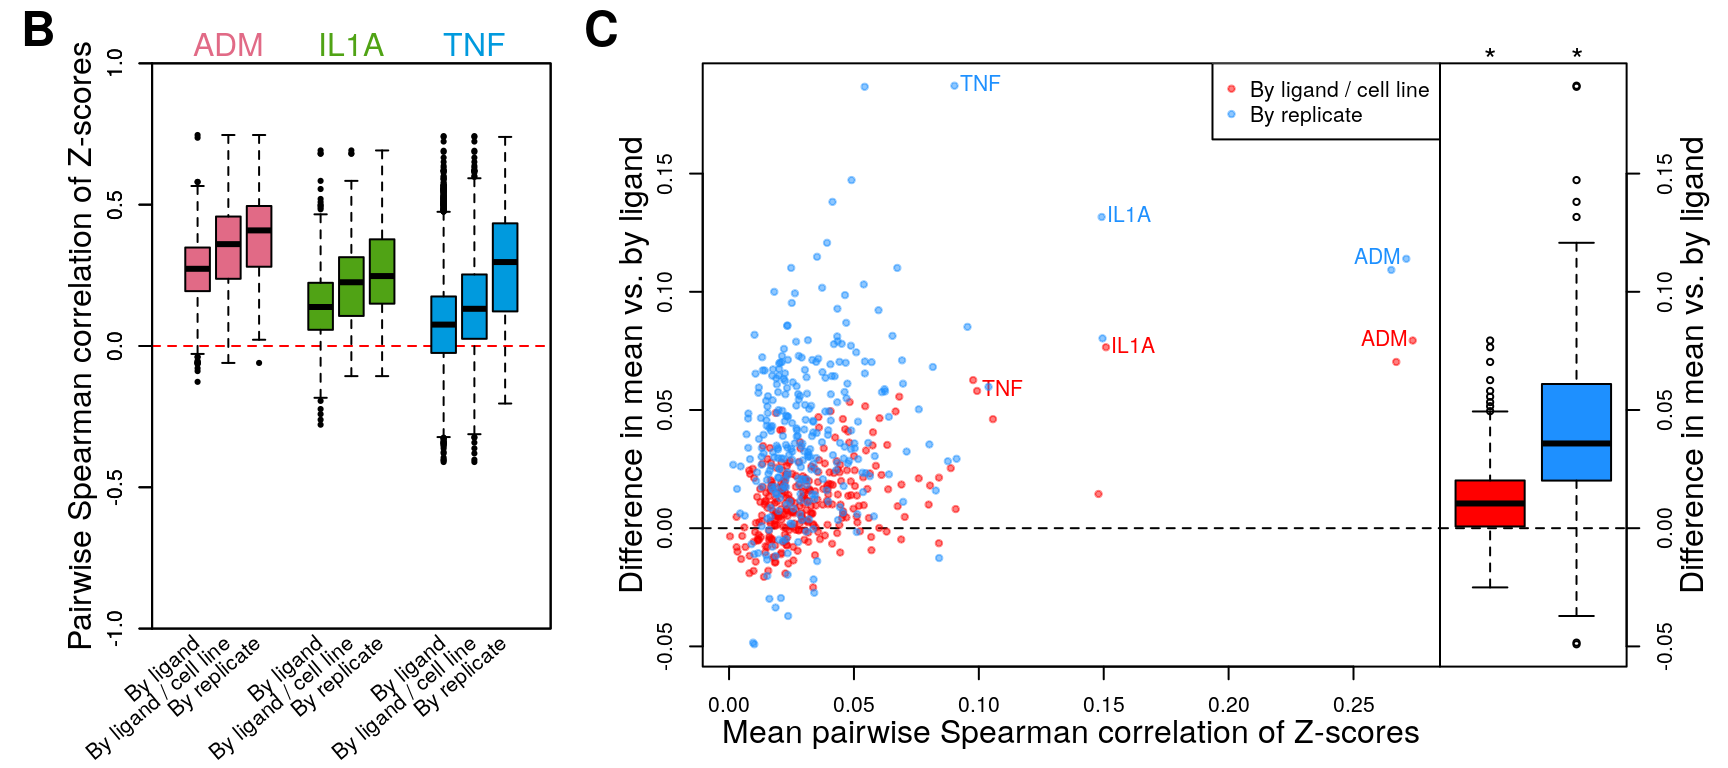
"*" p < 2.2e-16 by Wilcoxon signed-rank test.
Mean improvement (LIGCT): 0.0120171
Mean improvement (REP): 0.0401395
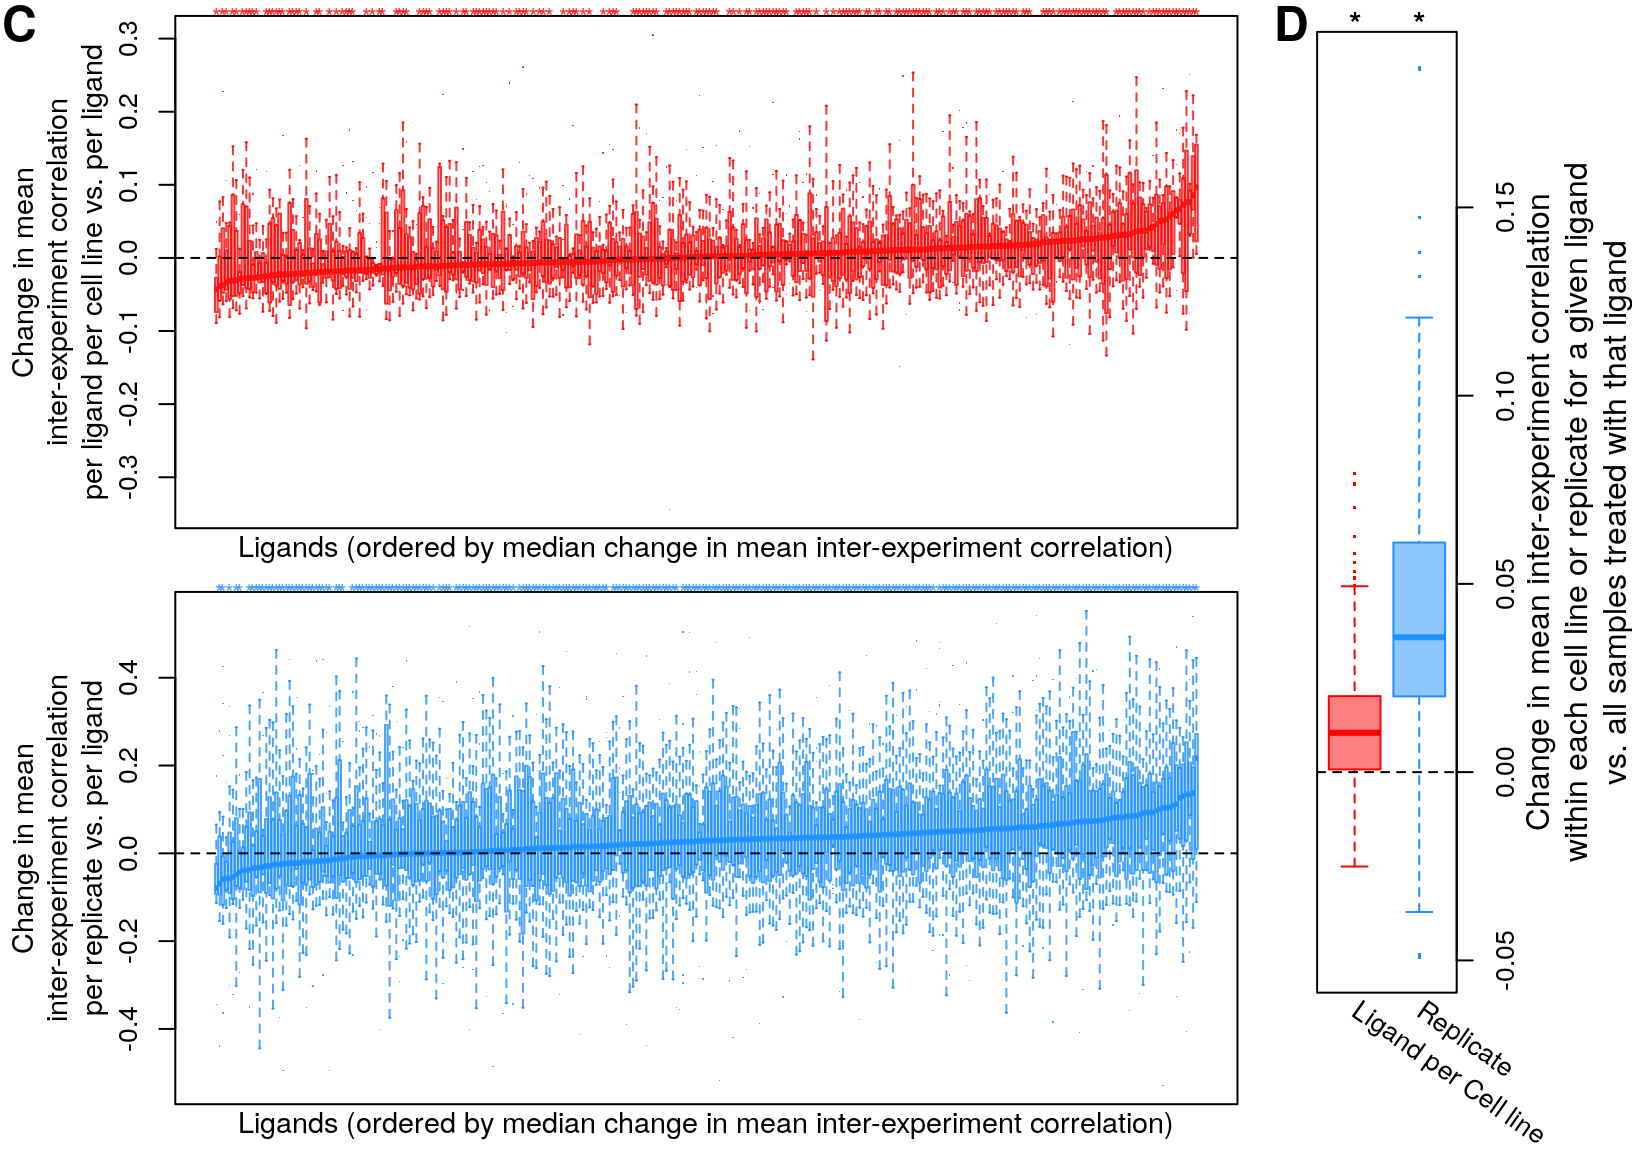
Inter-experiment correlation was significantly improved when considering cell line context in at least one cell line for 213 / 295 (72%) ligands (p <= 0.05 by Wilcoxon rank-sum test).
Inter-experiment correlation within replicates was significantly better than correlations between all samples treated with the same ligand in at least one replicate for 281 / 295 (95%) ligands (p <= 0.05 by Wilcoxon rank-sum test).
"*" p < 2.2e-16 by Wilcoxon signed-rank test.
Mean improvement (LIGCT): 0.0120171
Mean improvement (REP): 0.0401395
OLD
Figure 1a
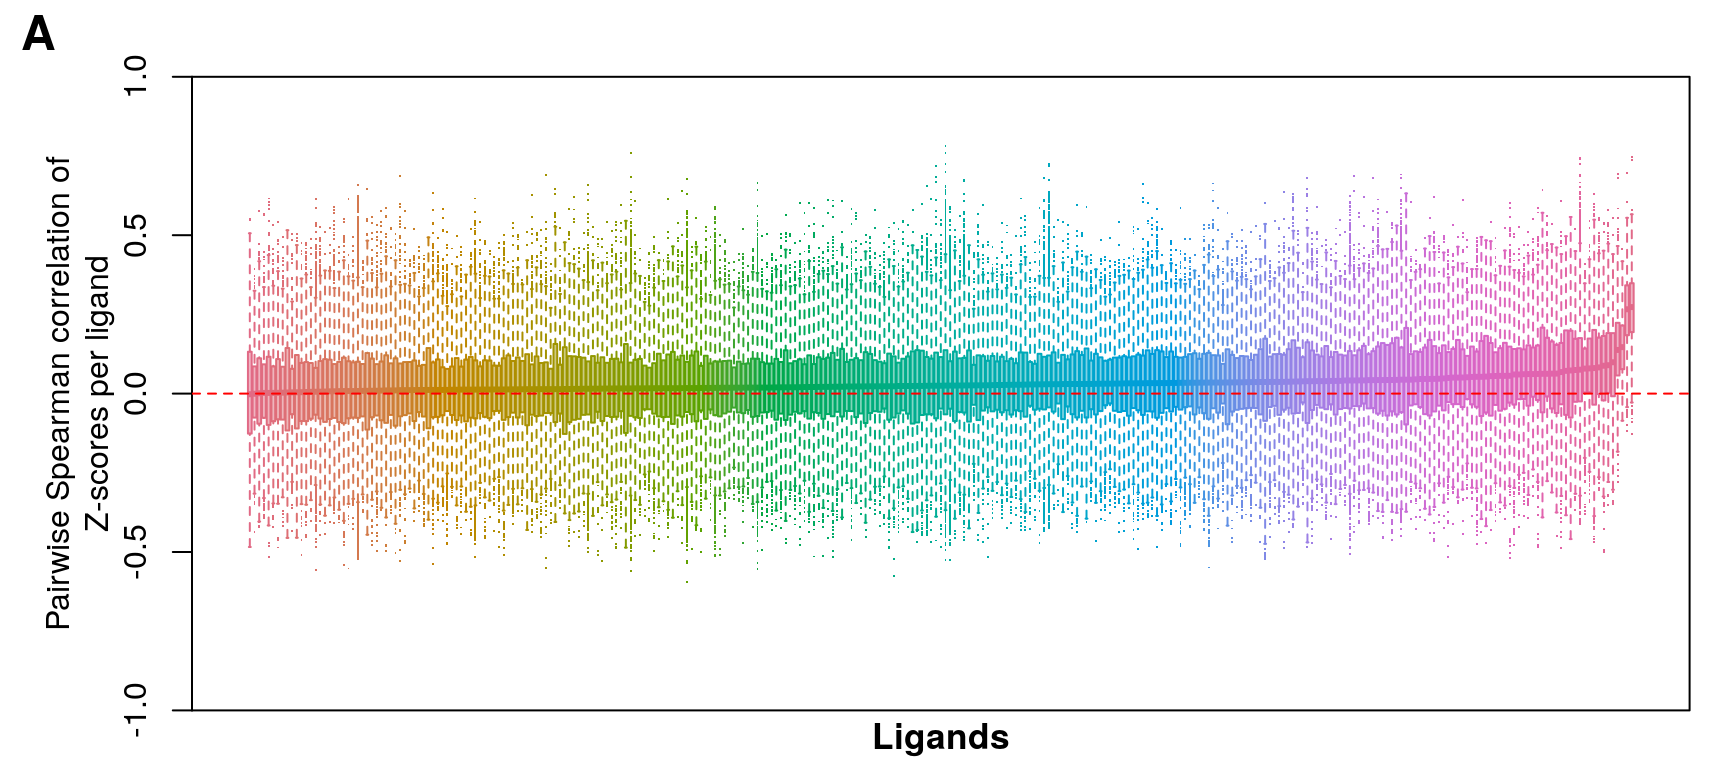
Mean of median pairwise Spearman correlation of Z-scores per ligand is 0.0307784.
Figure 1b/c
The * denotes p < 2.2e-16 from Wilcoxon signed-rank test vs. mu of 0.
Mean improvement by ligand / cell line: 0.0120171
Mean improvement by replicate: 0.0401395
New version?
"*" p < 2.2e-16 by Wilcoxon signed-rank test.