Differential Gene Expression overlap
Figure 1
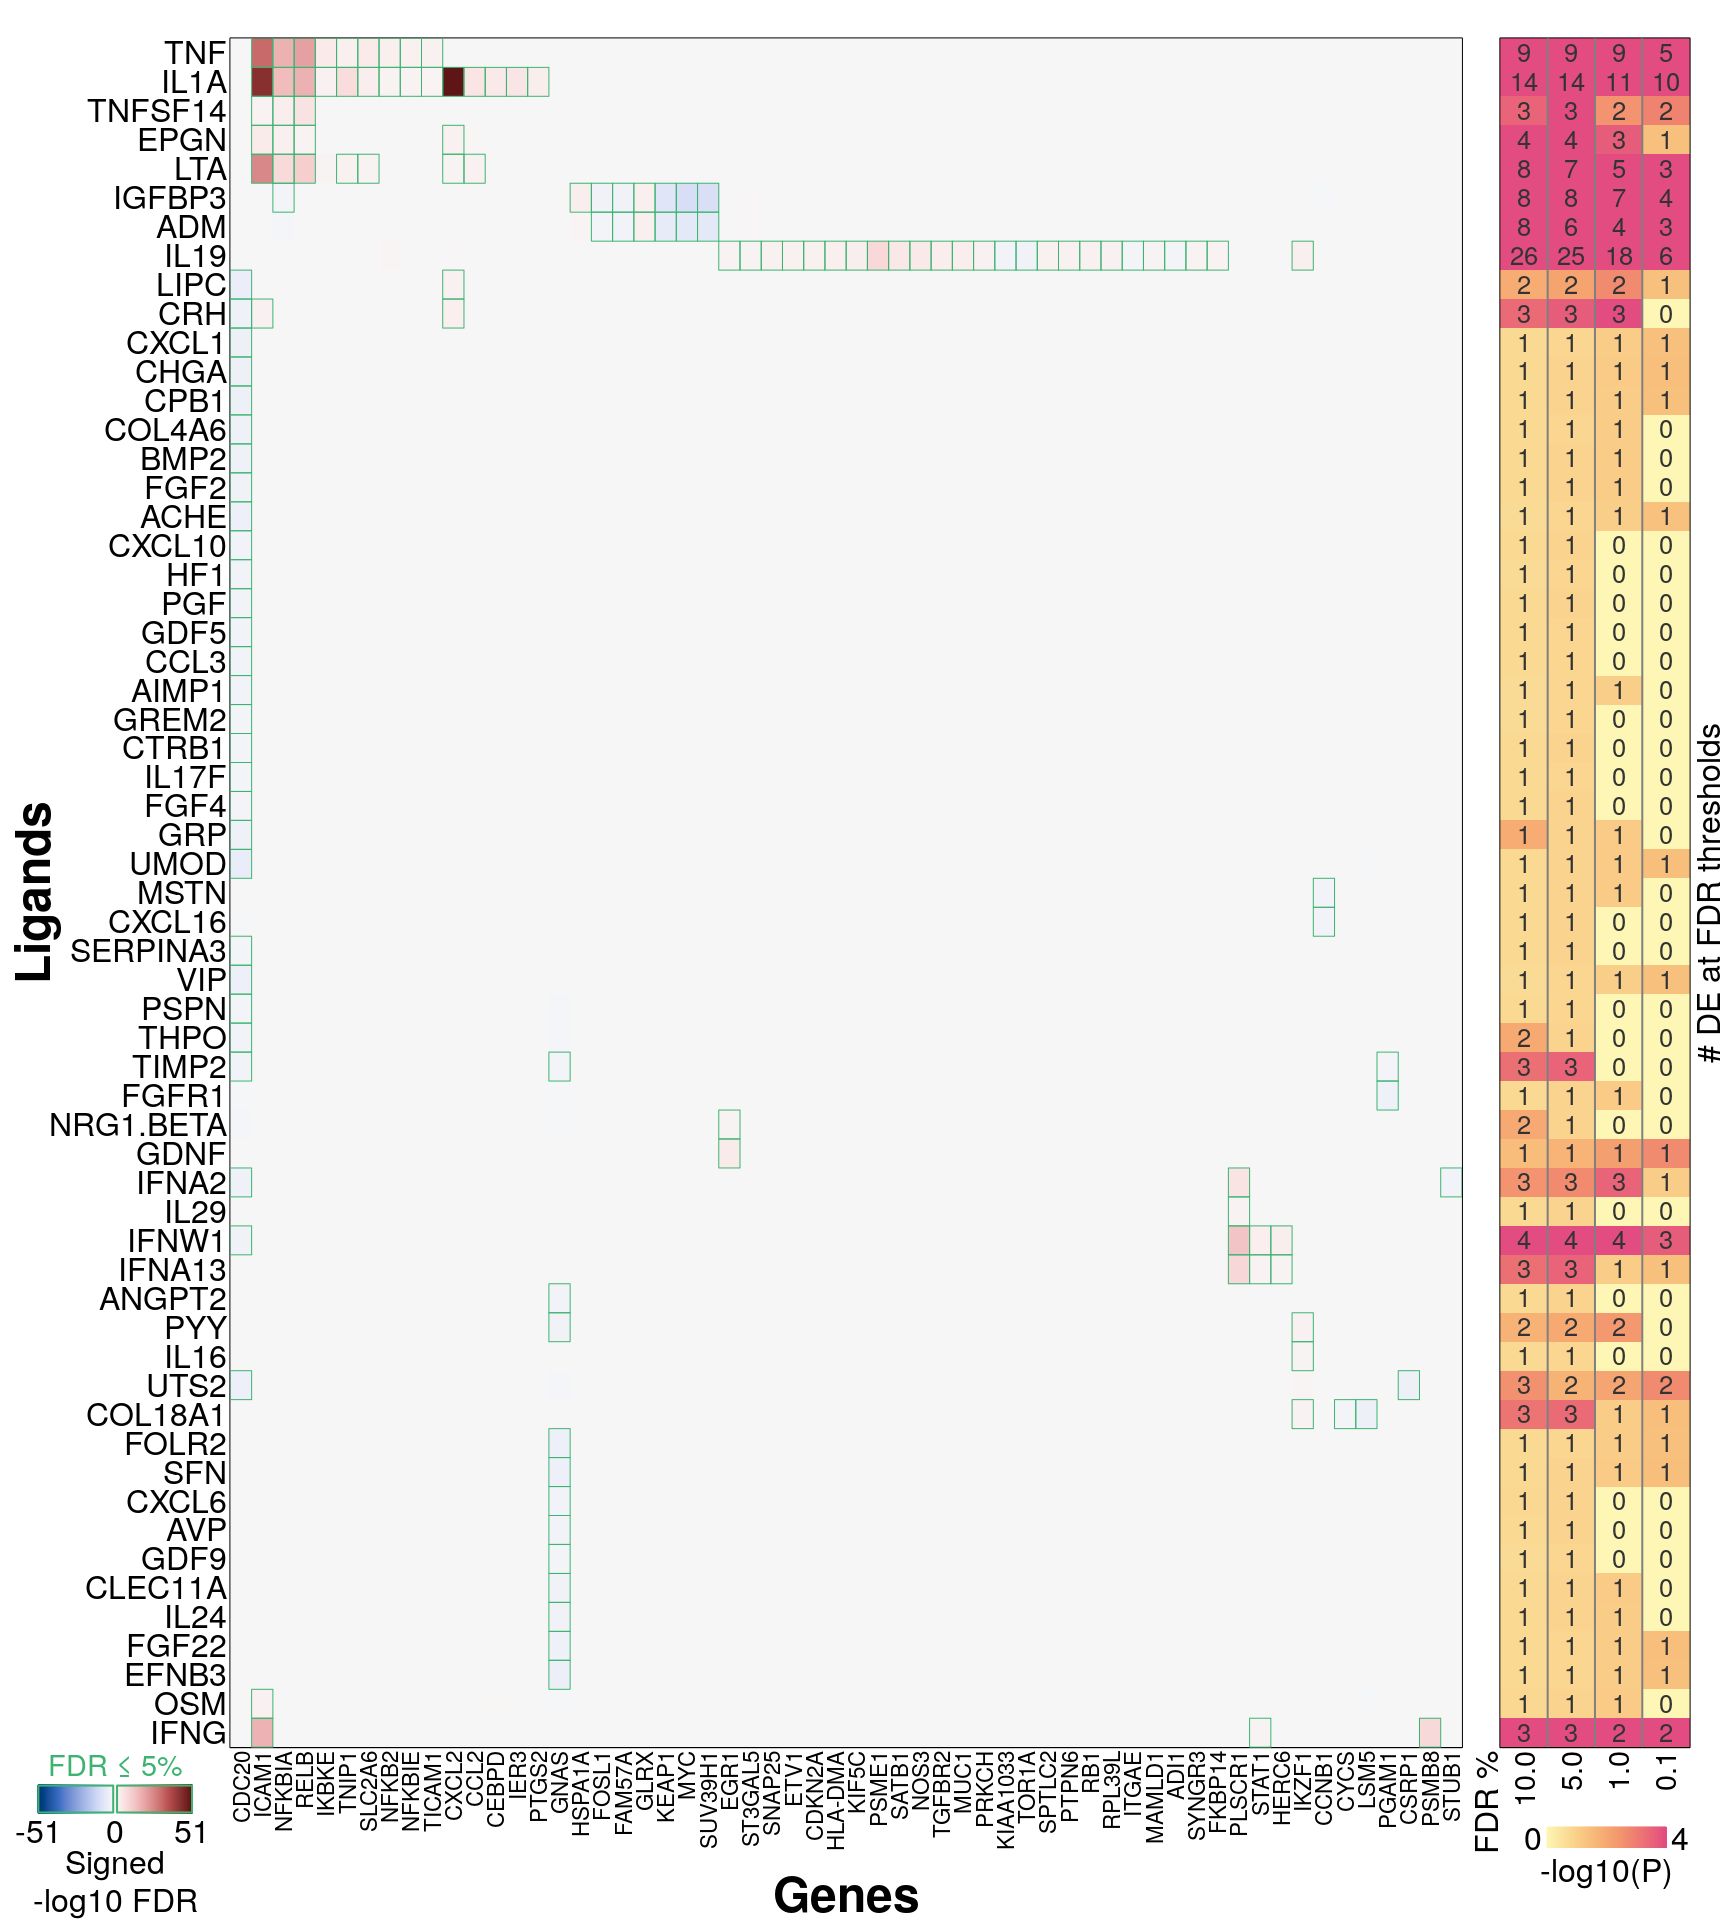
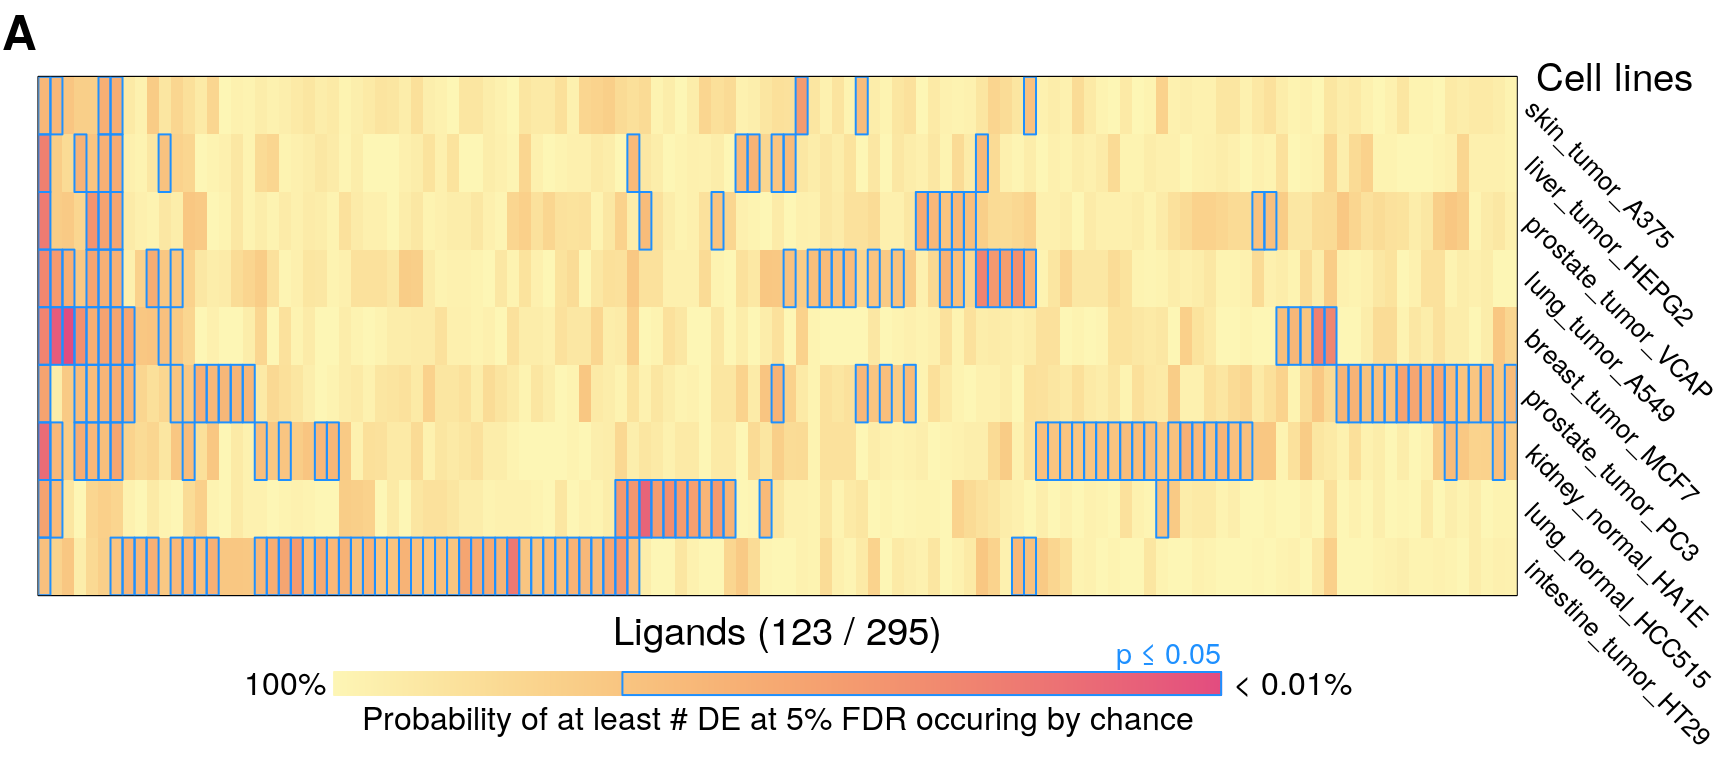
Figure 2
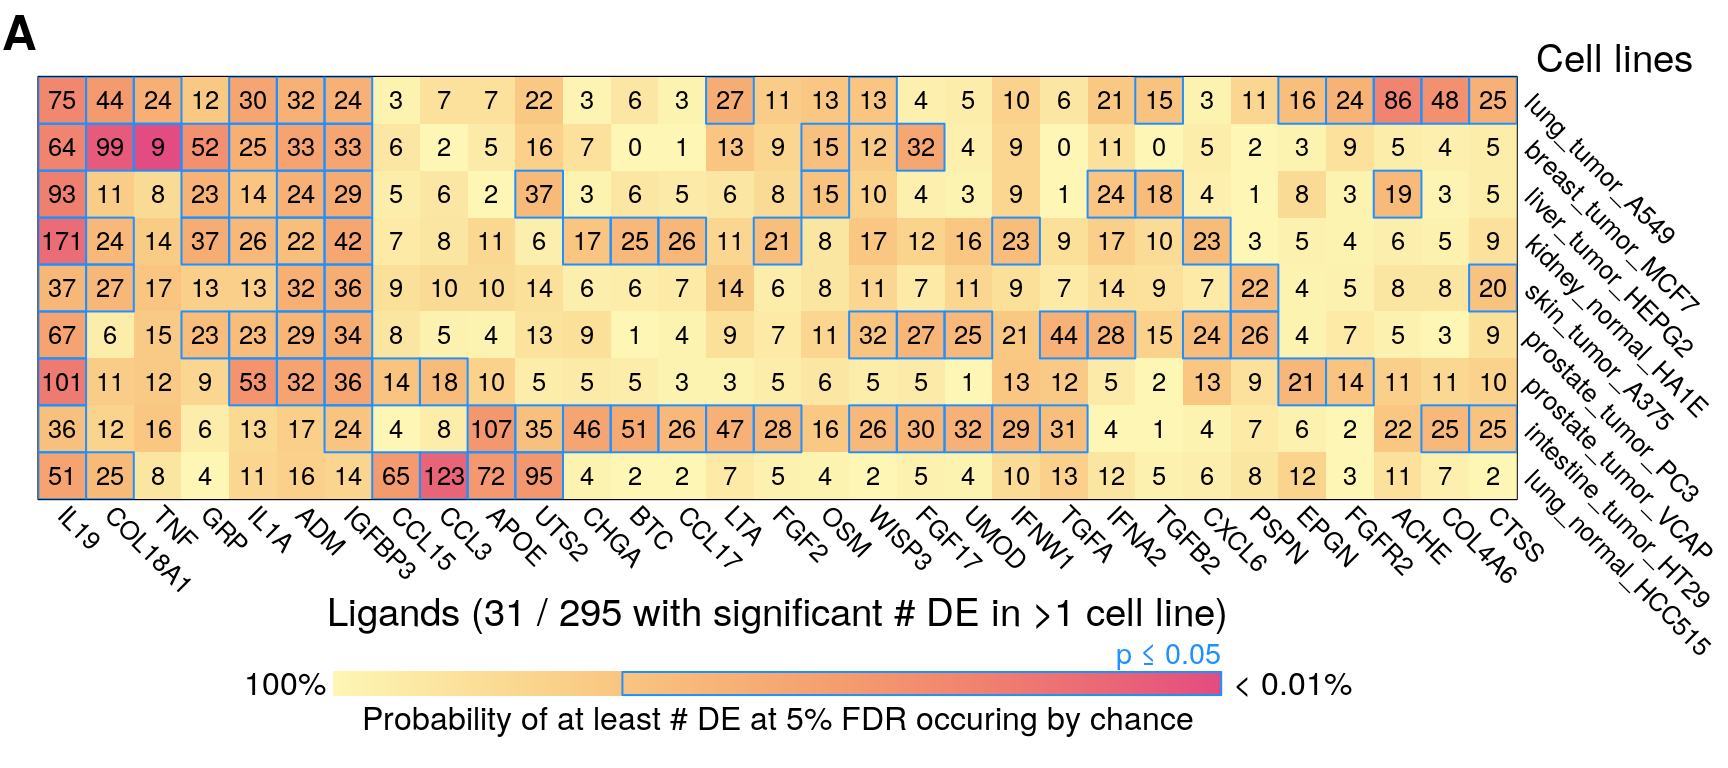
Version 2, ligands with > 1 signif DE incl, # DE added.
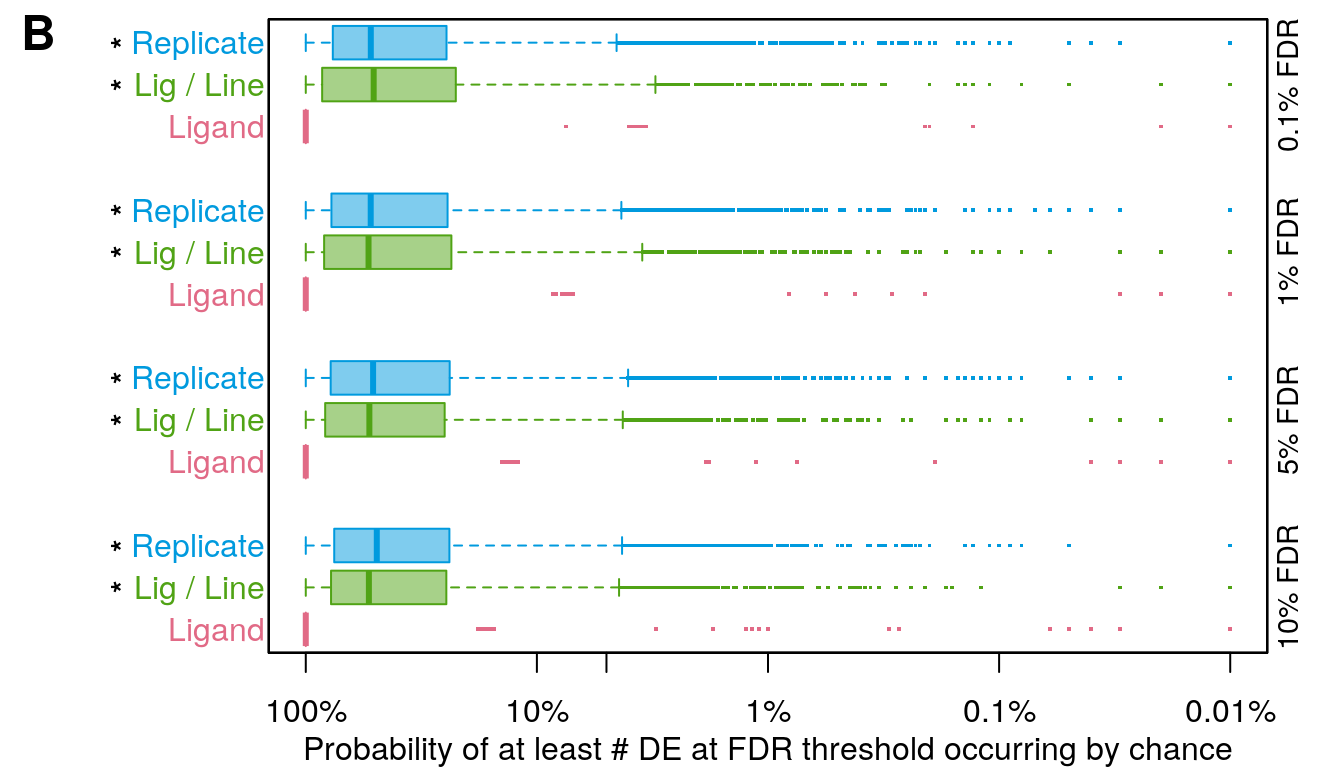
The * denotes p < 2.2e-16 from Wilcoxon rank-sum test vs. “Ligand”.
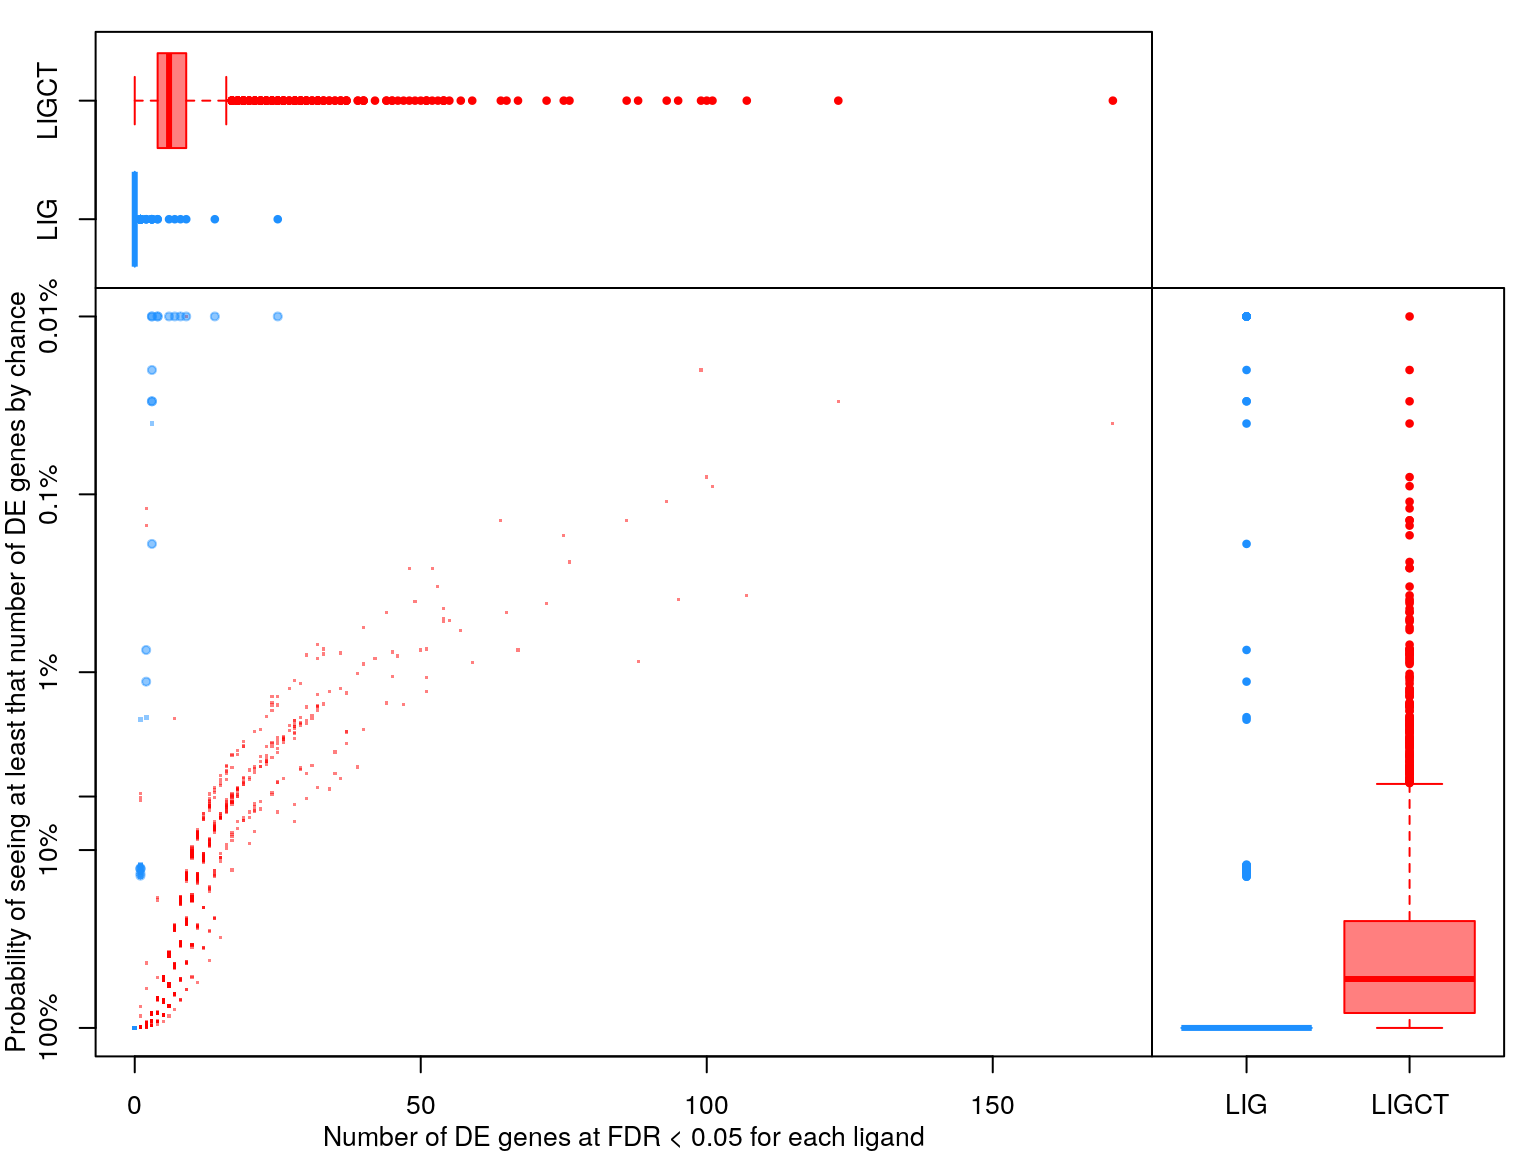
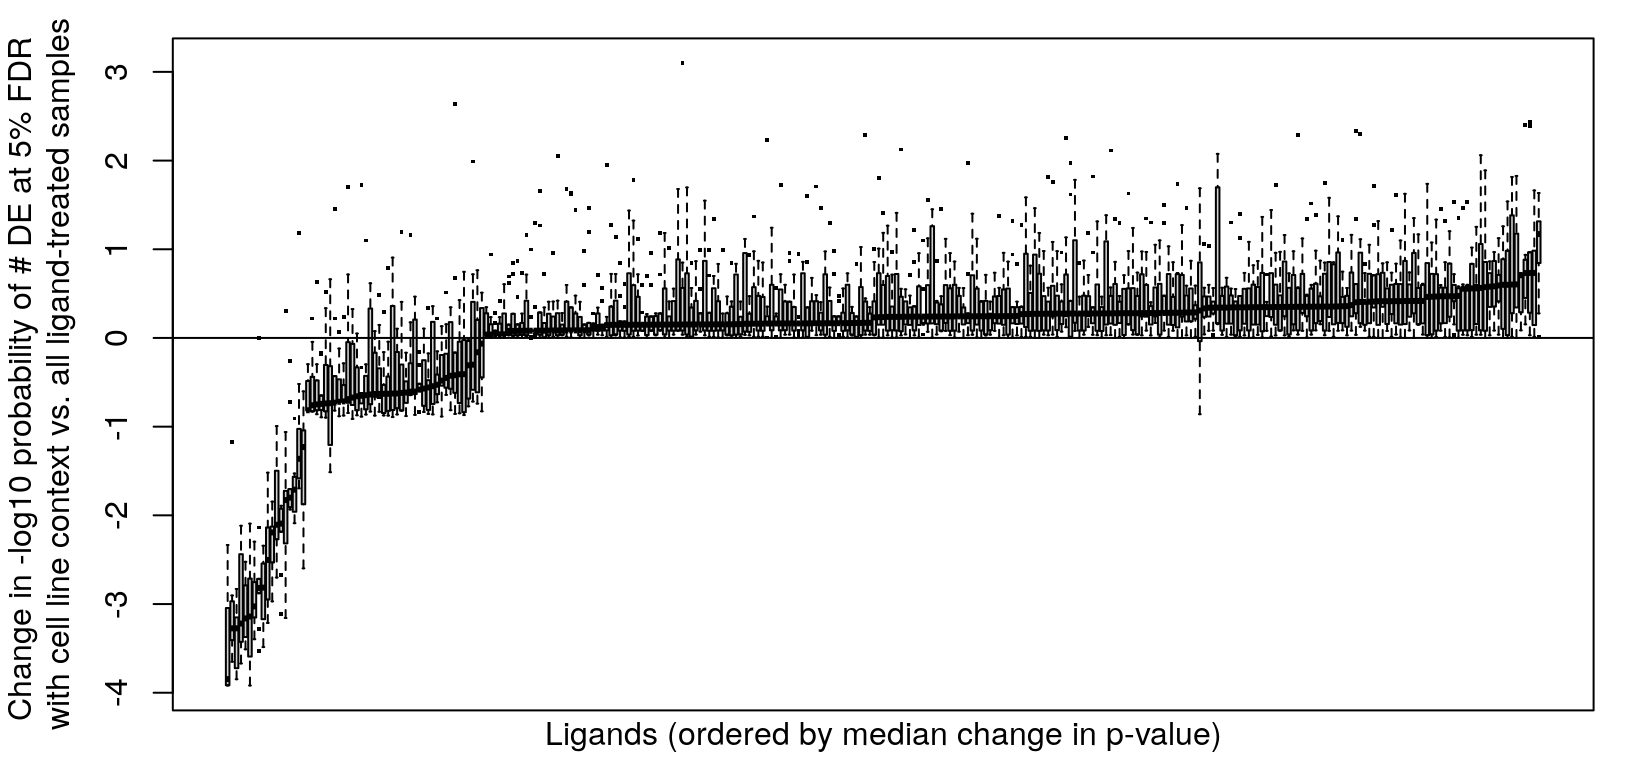
Supp Fig 2
Example plot to clarify what “averaging per ligand” means:
Comparing prob to num
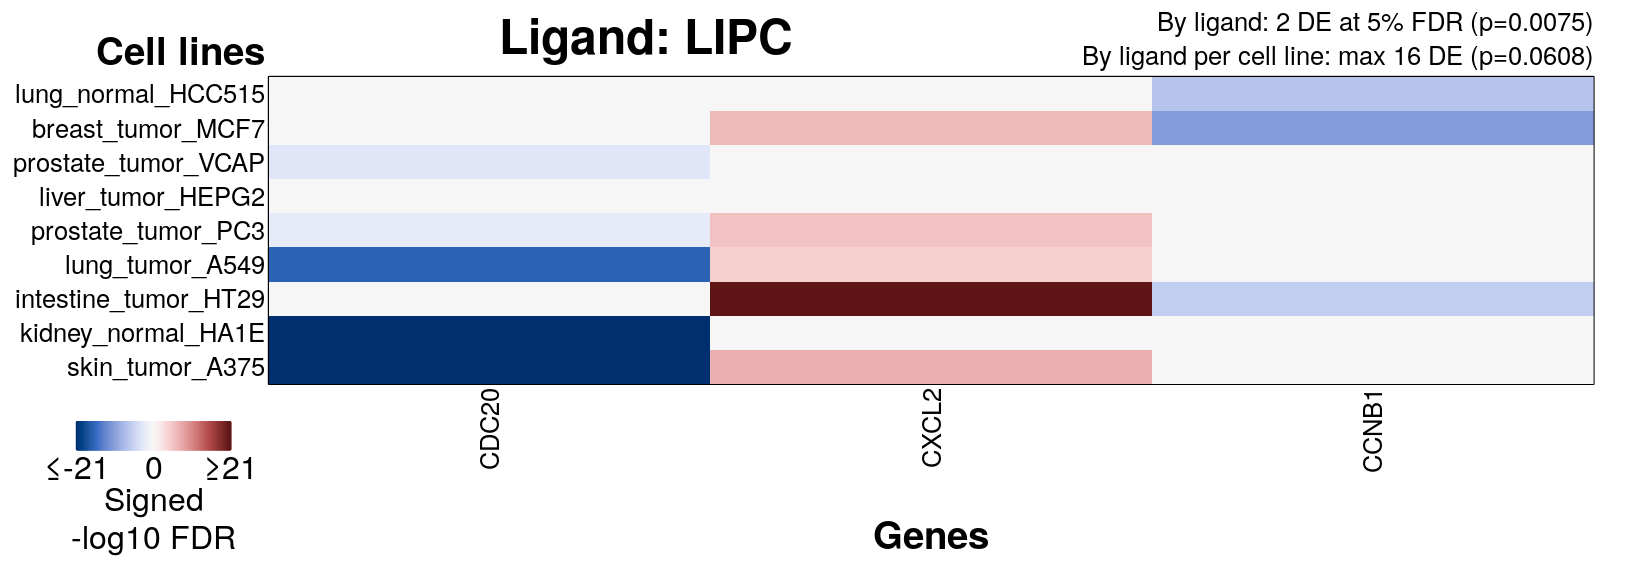
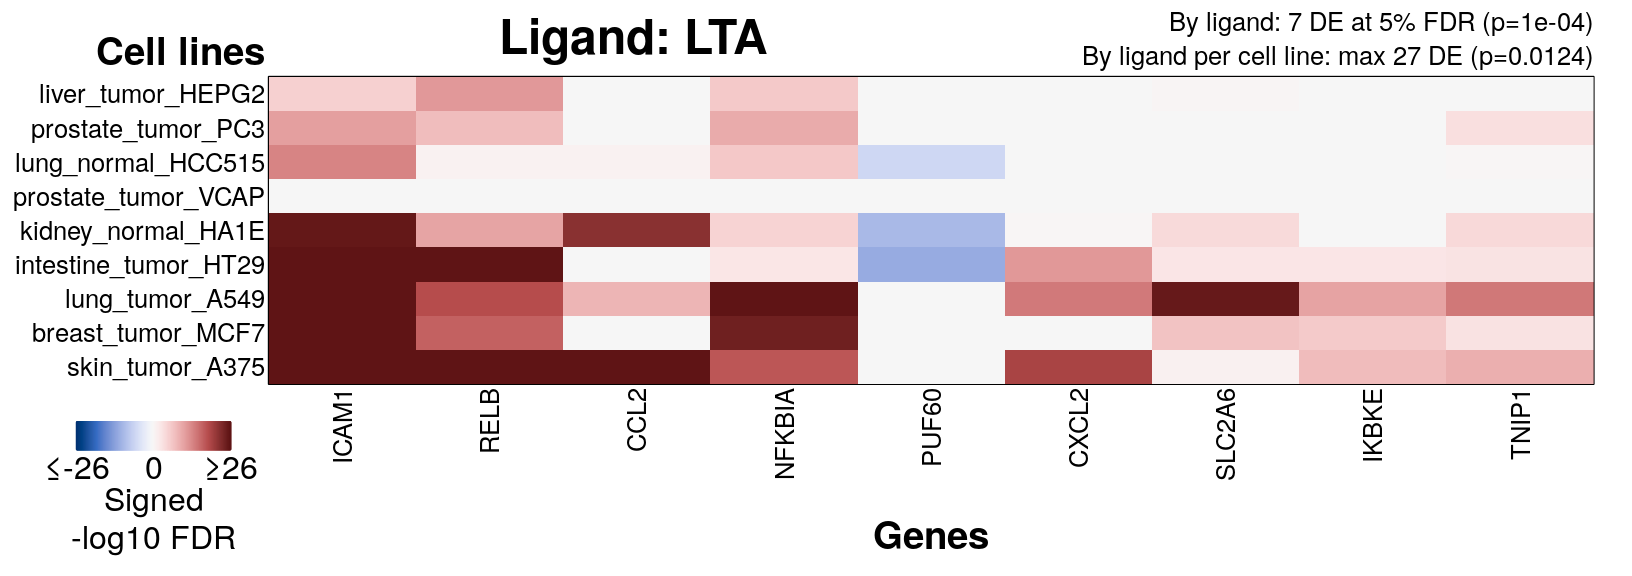
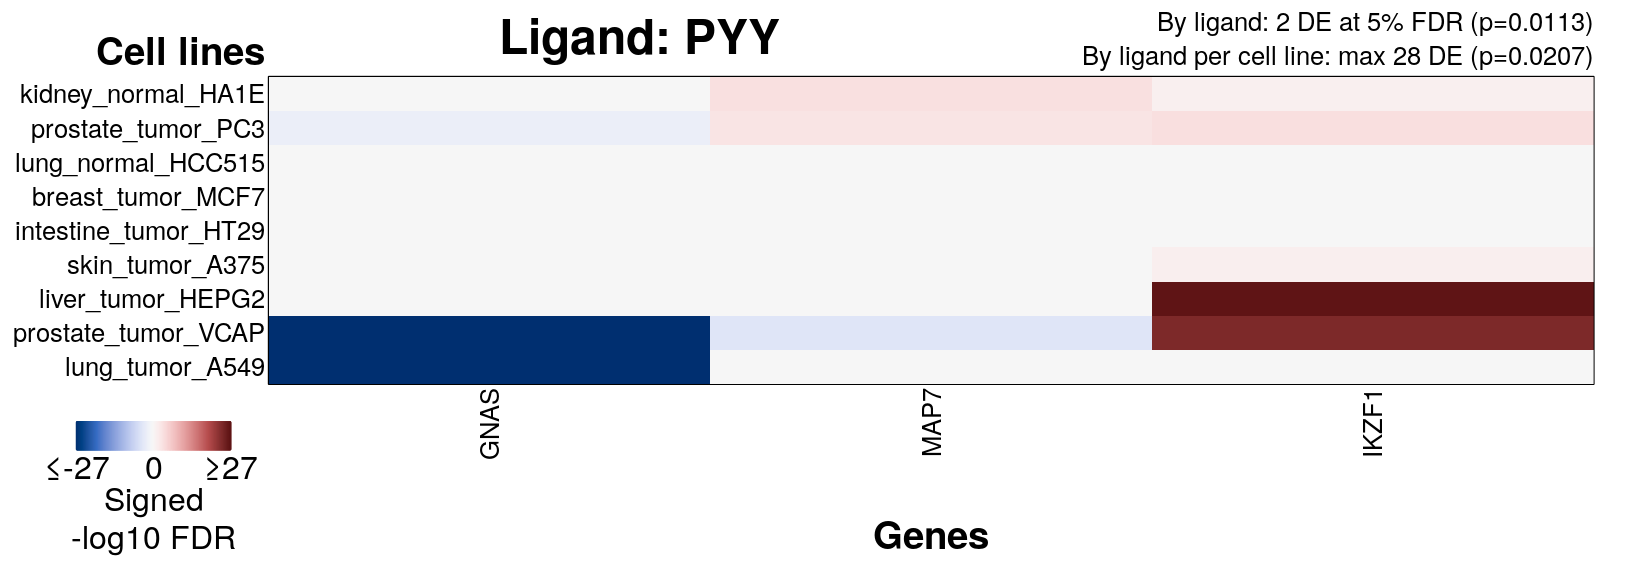
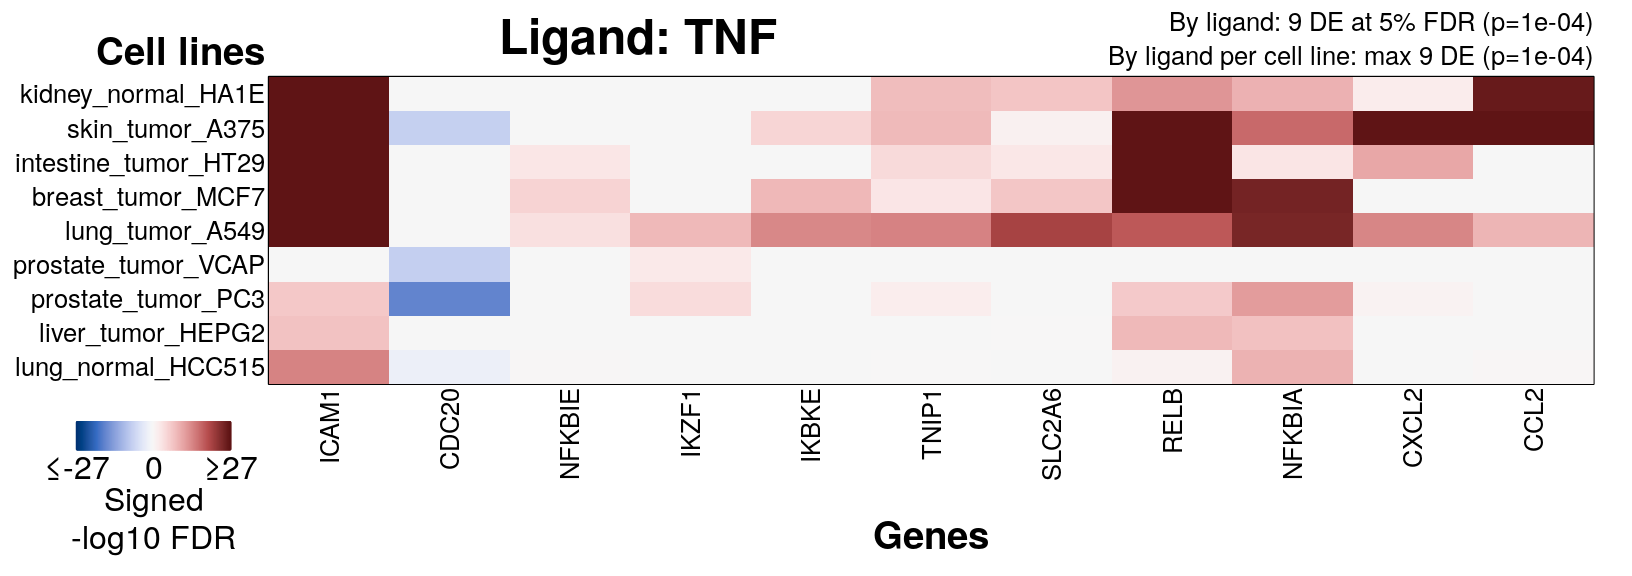
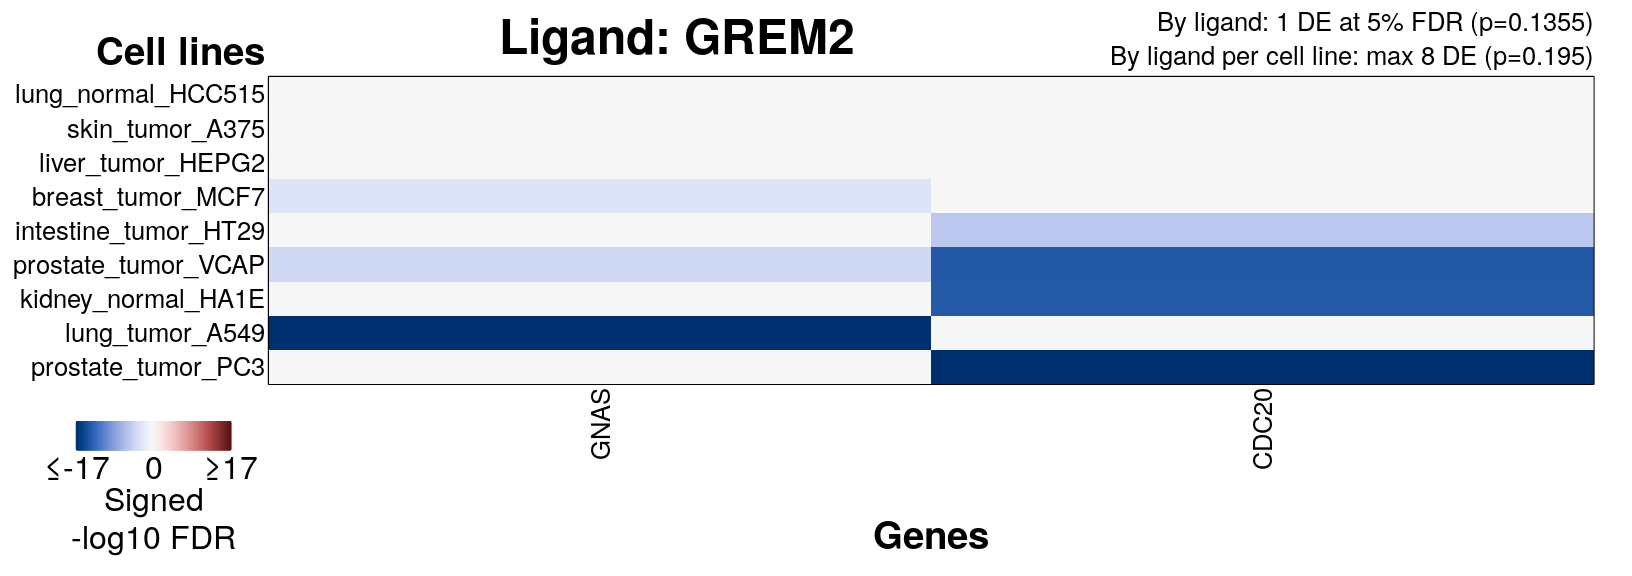
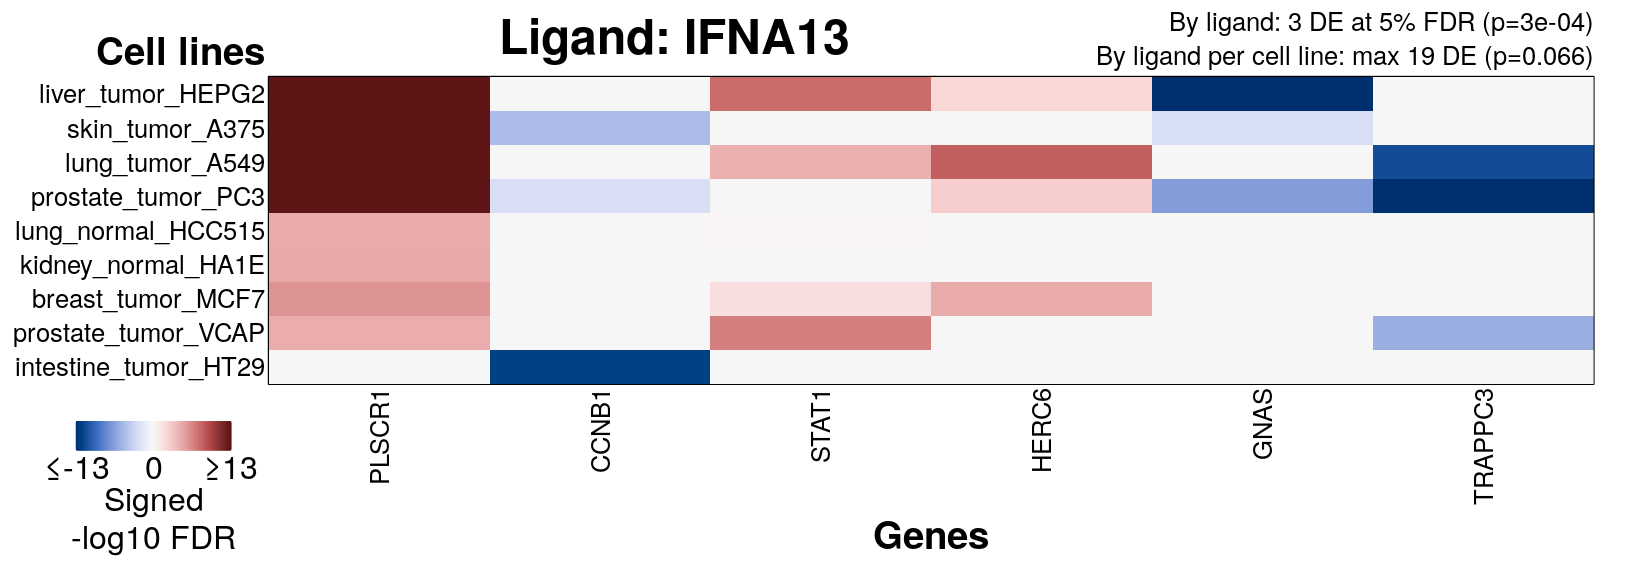
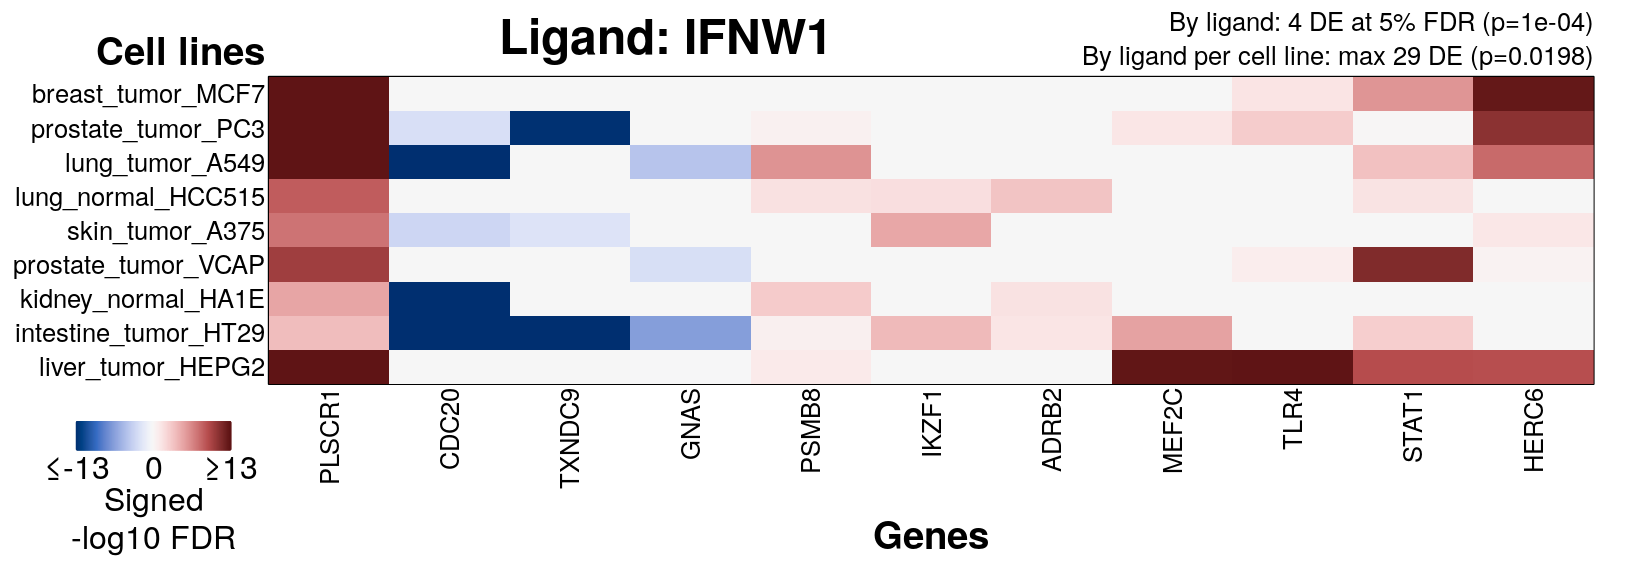
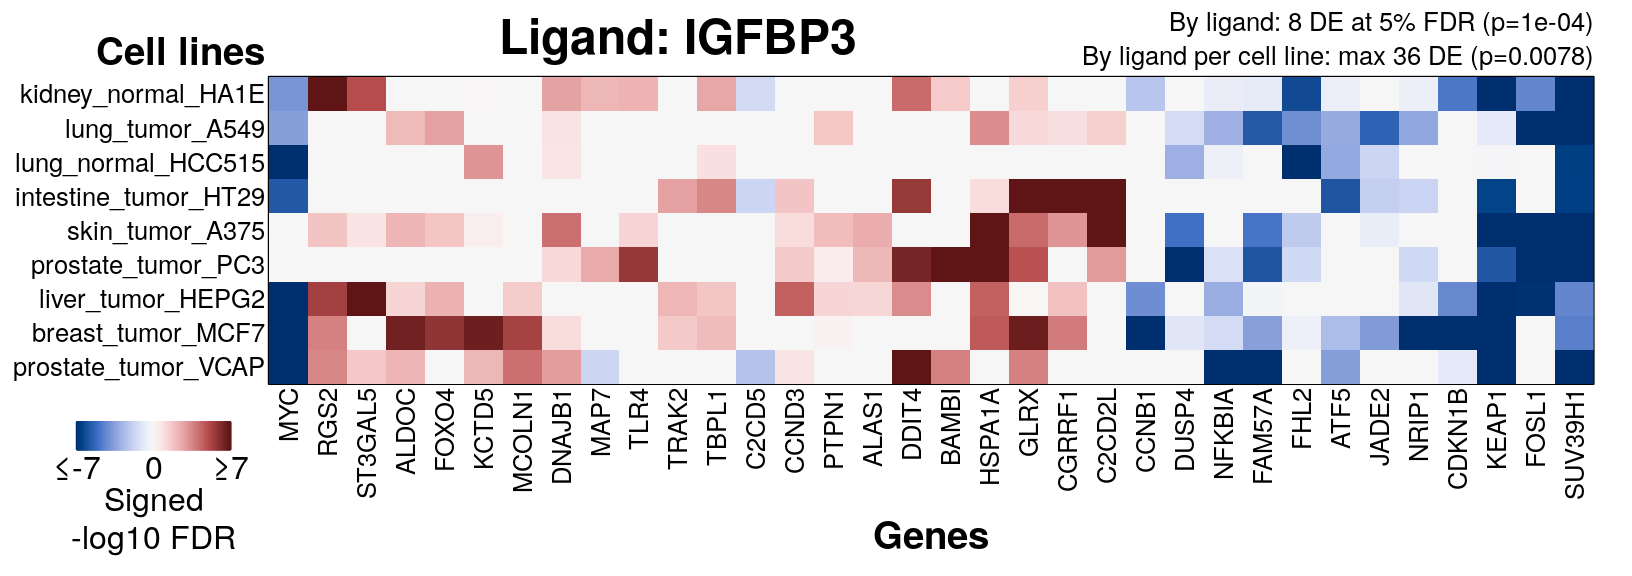
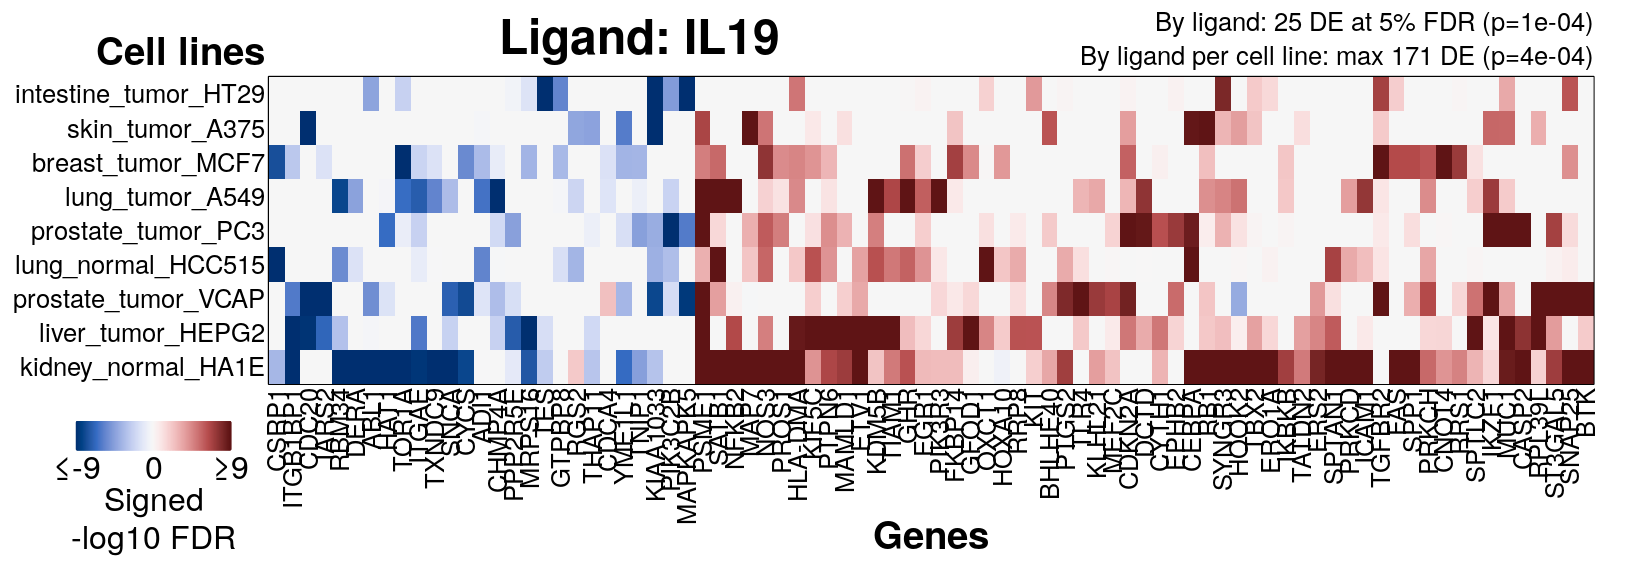
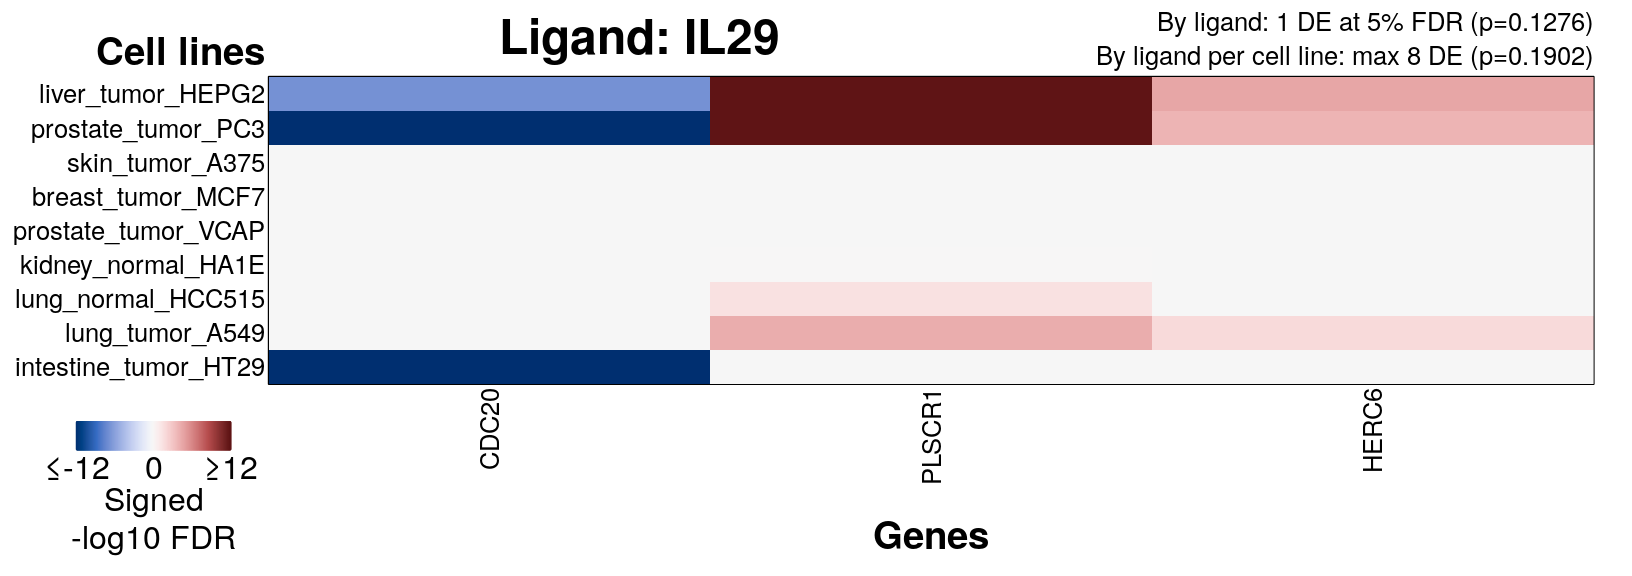
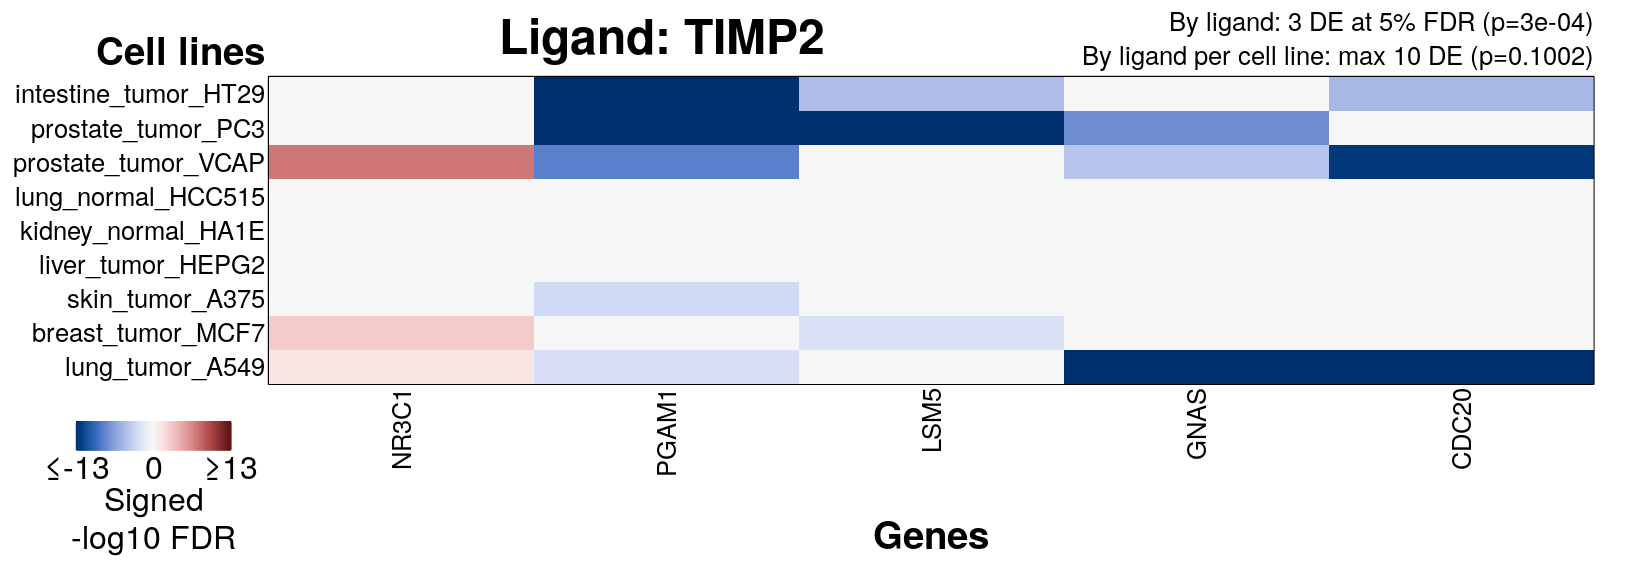
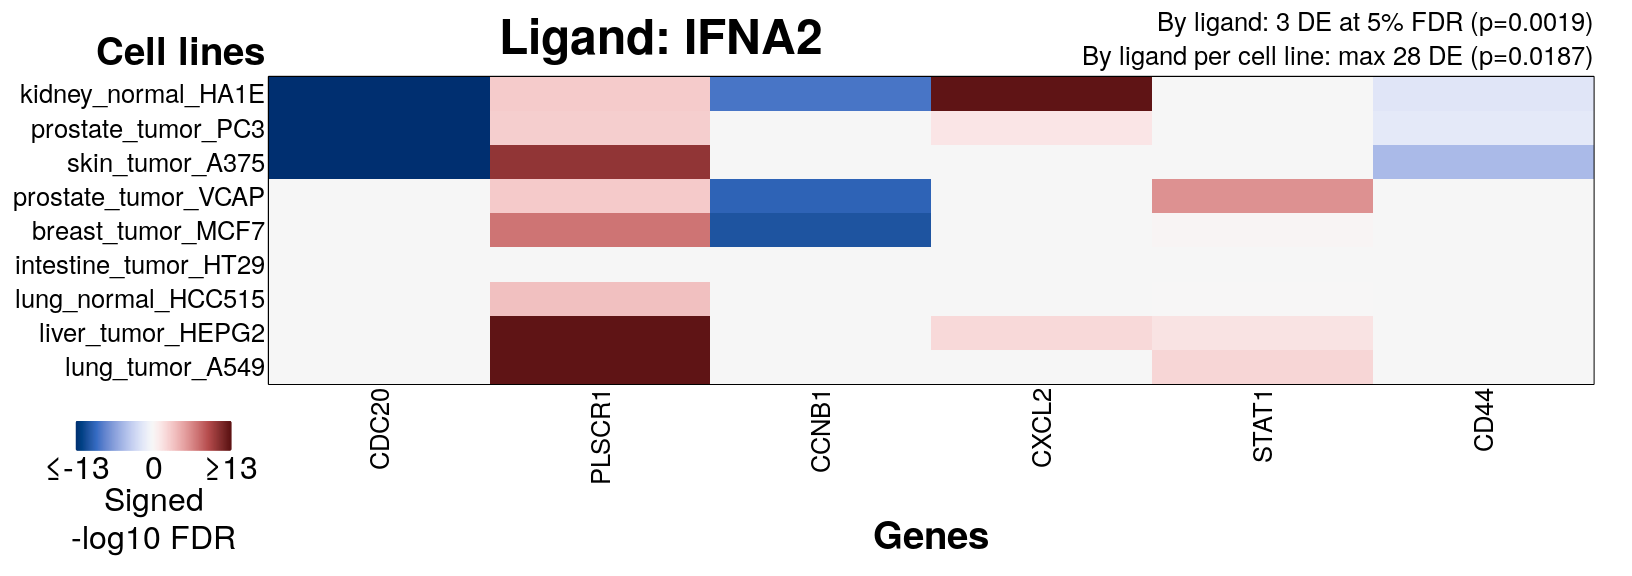
Ligands with consistent DE
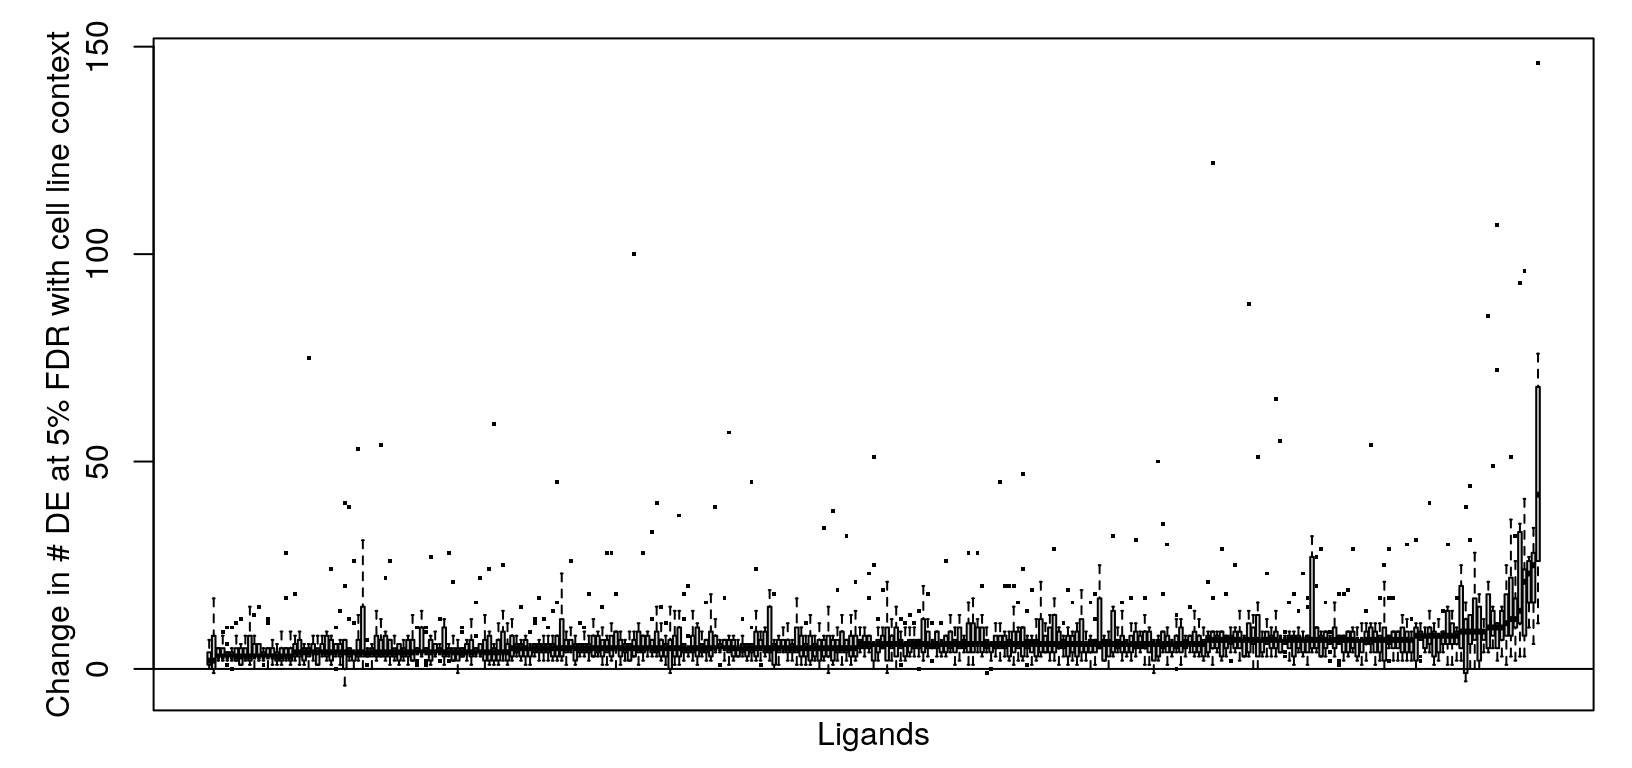
Supp Fig 3
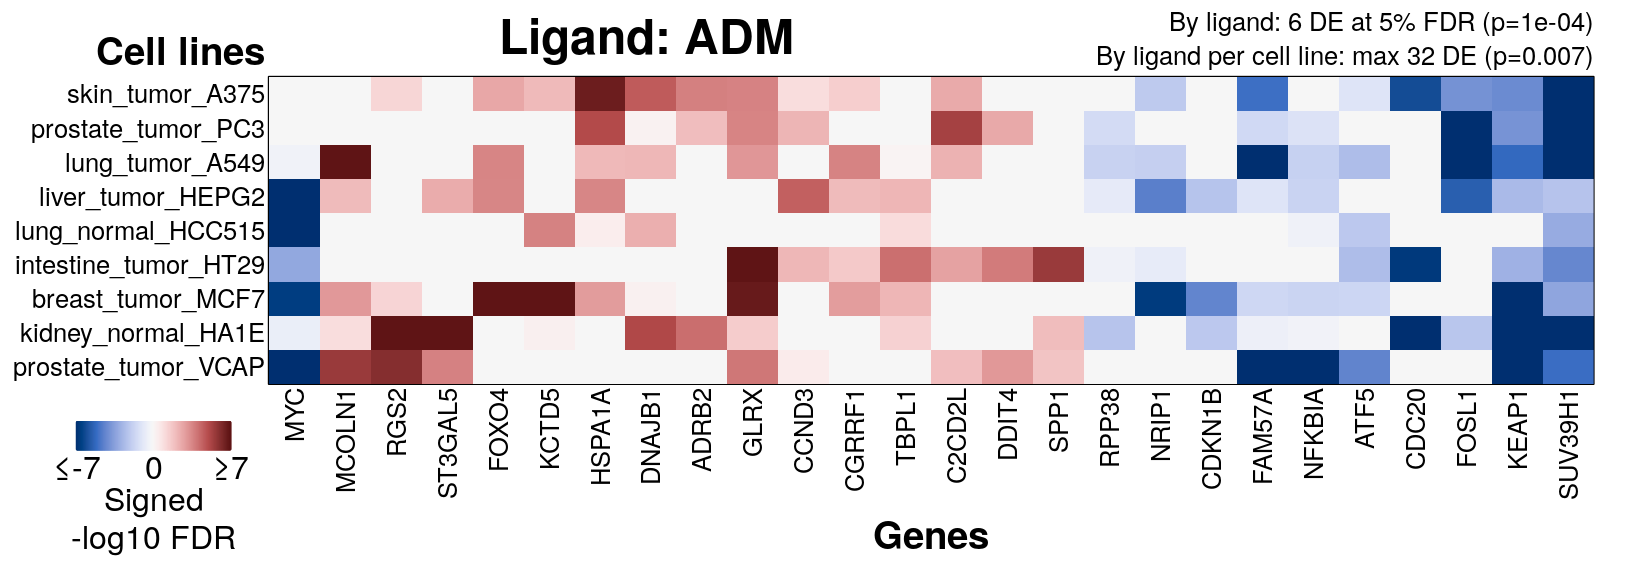
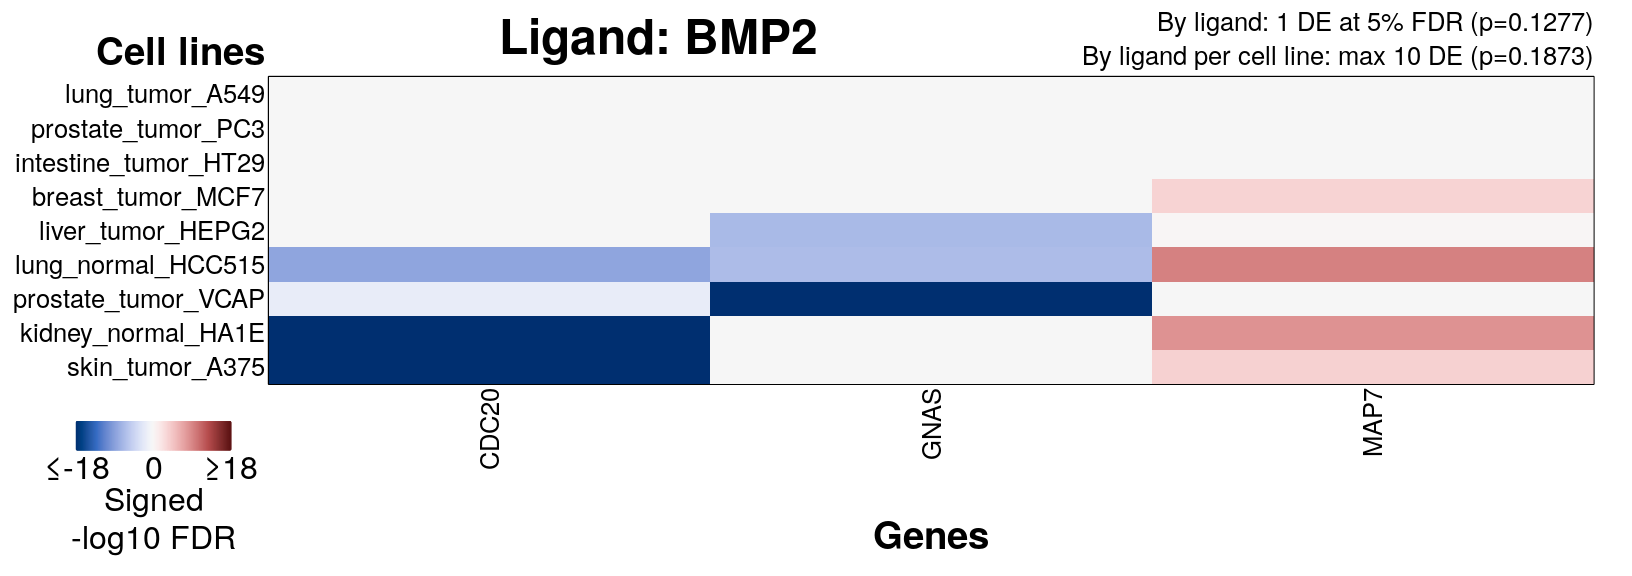
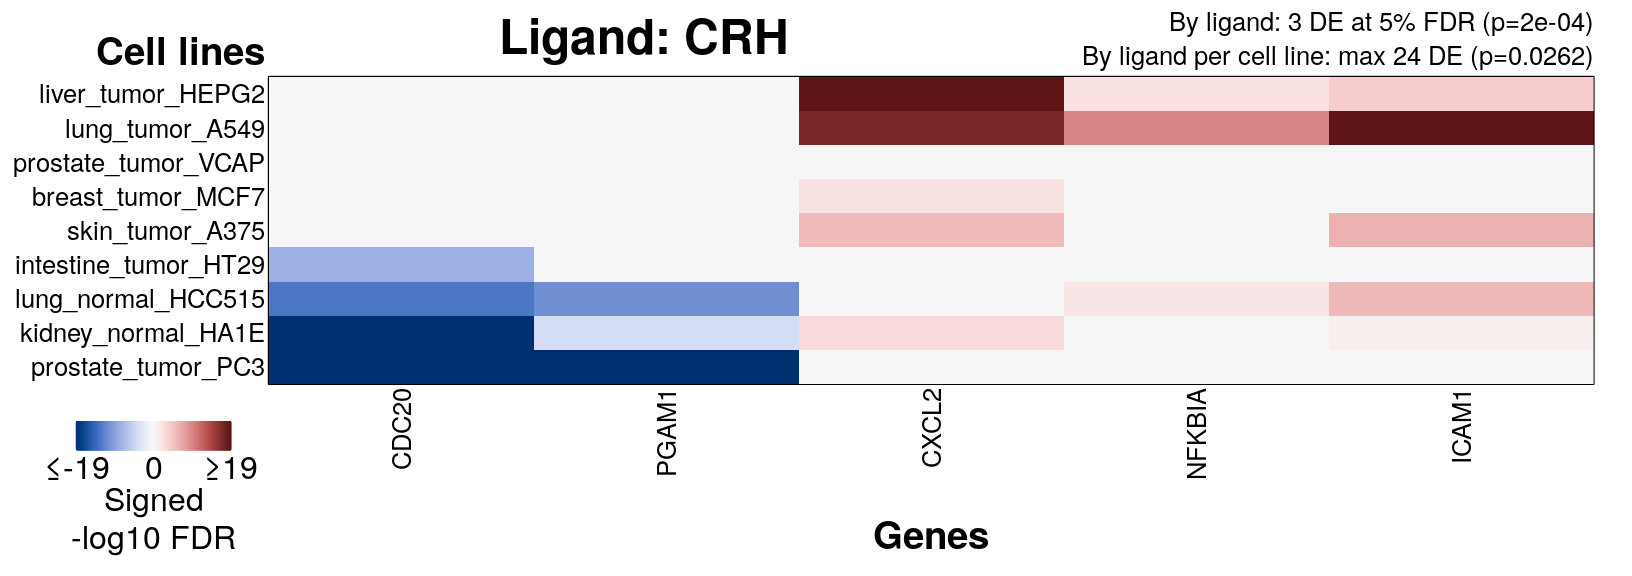
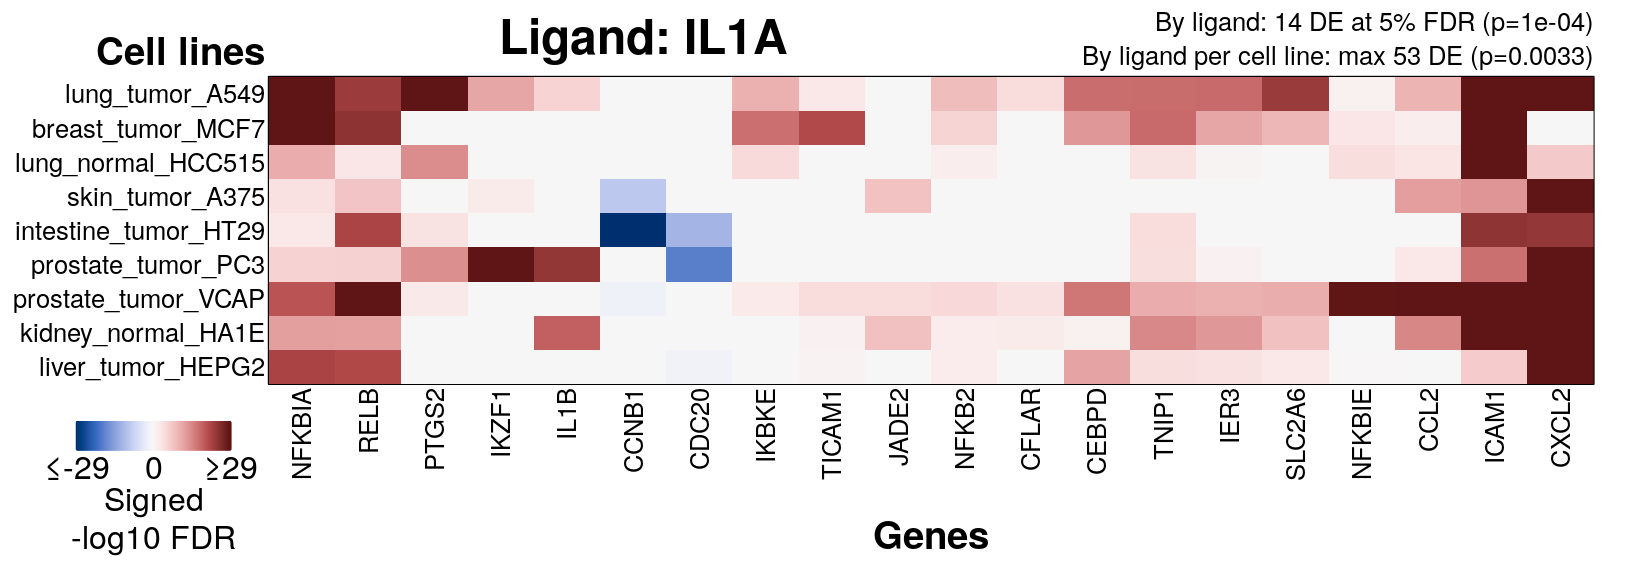
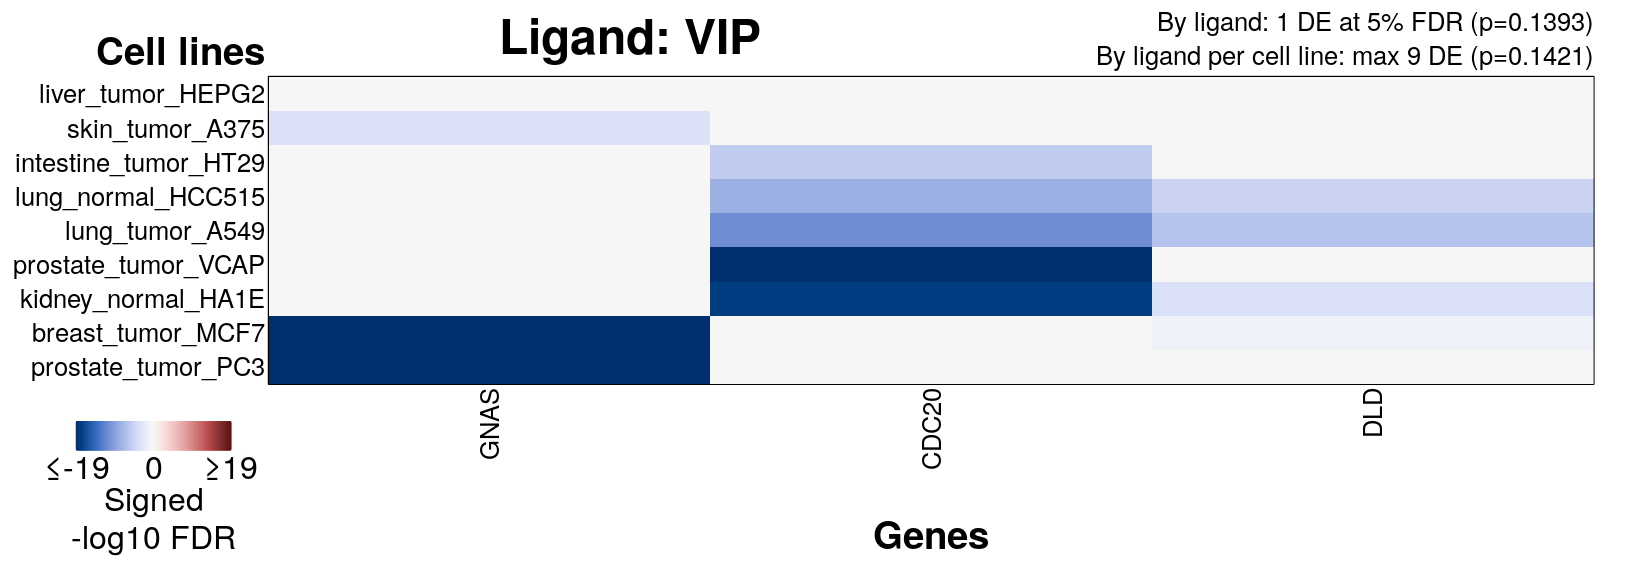
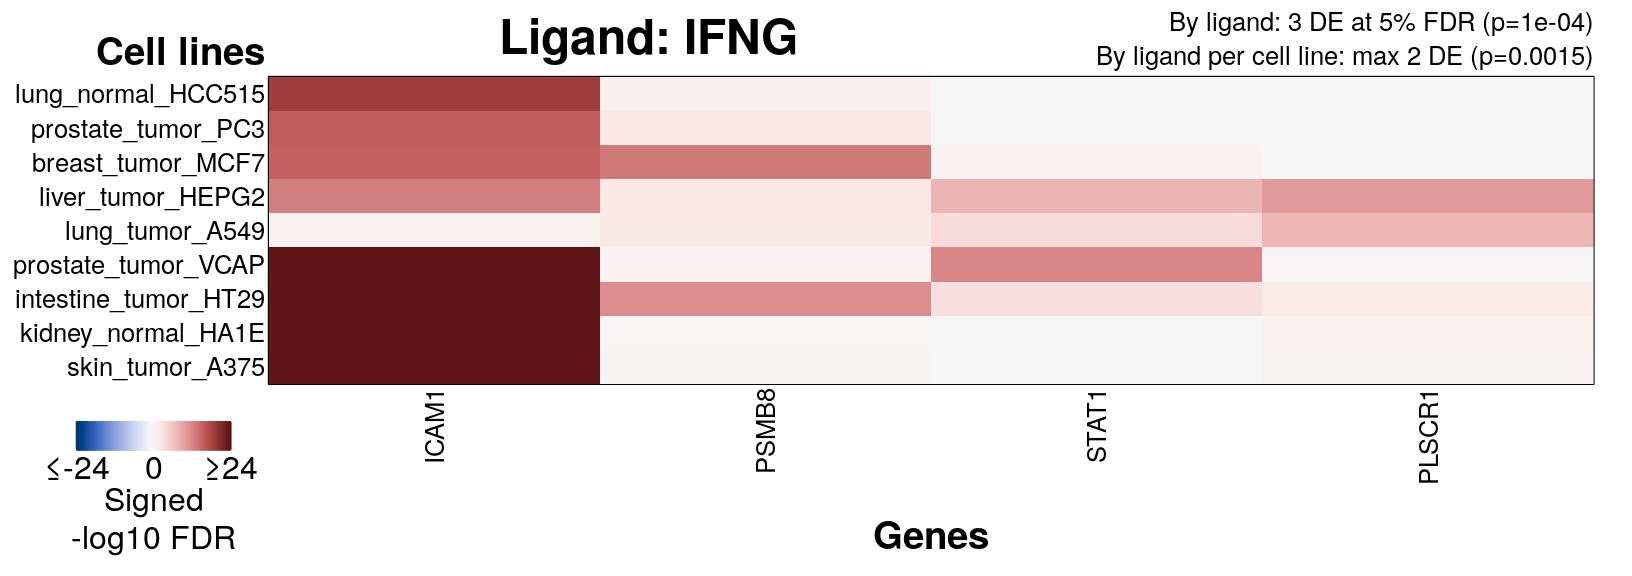
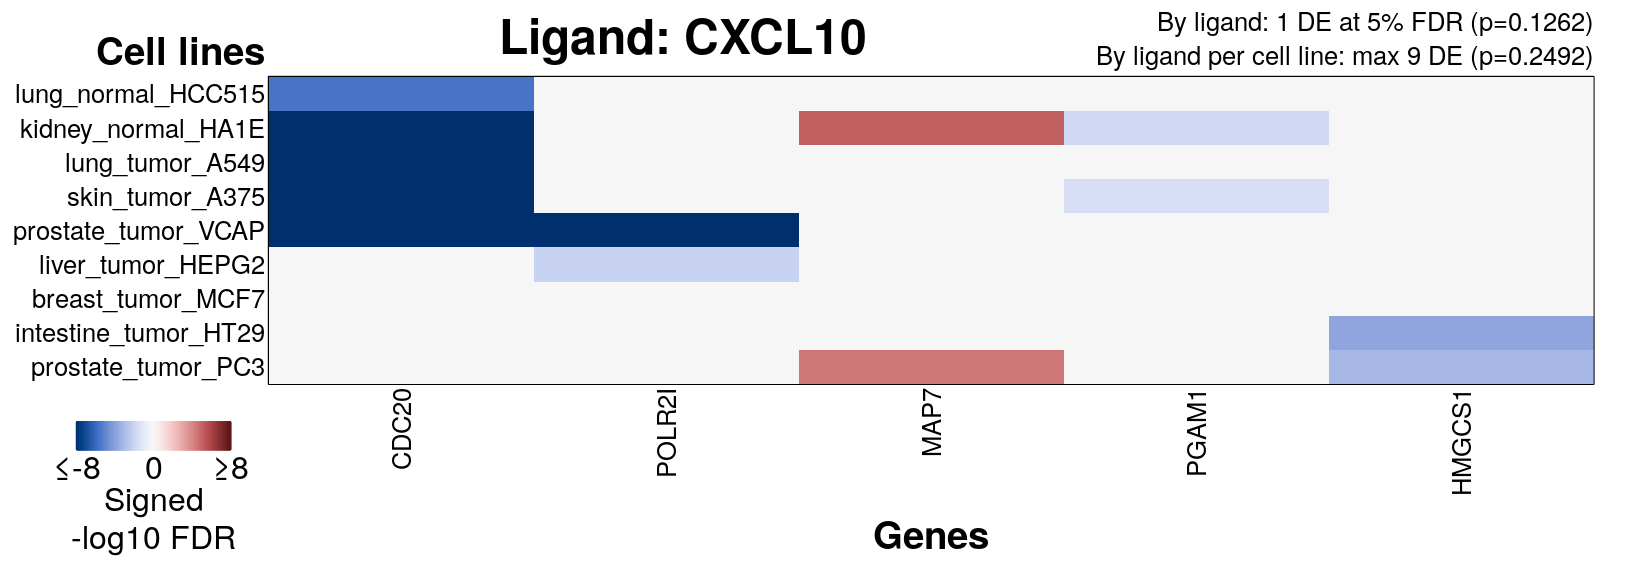
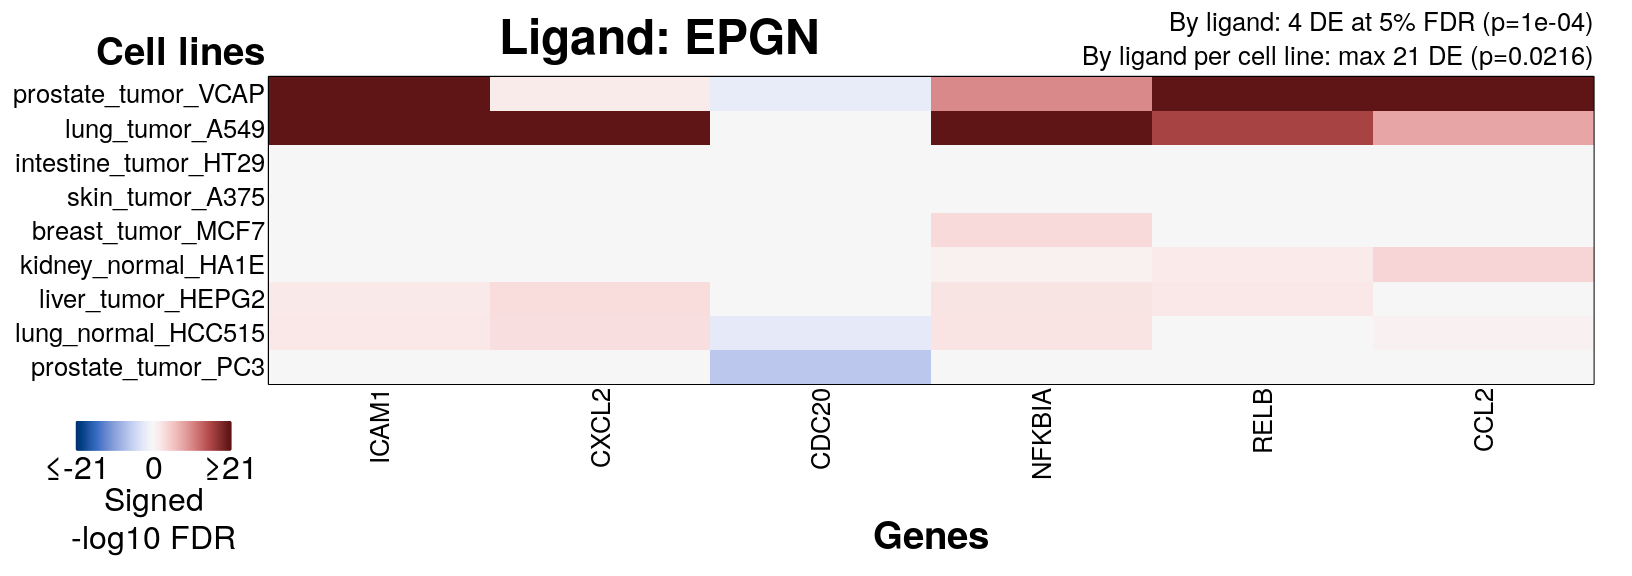
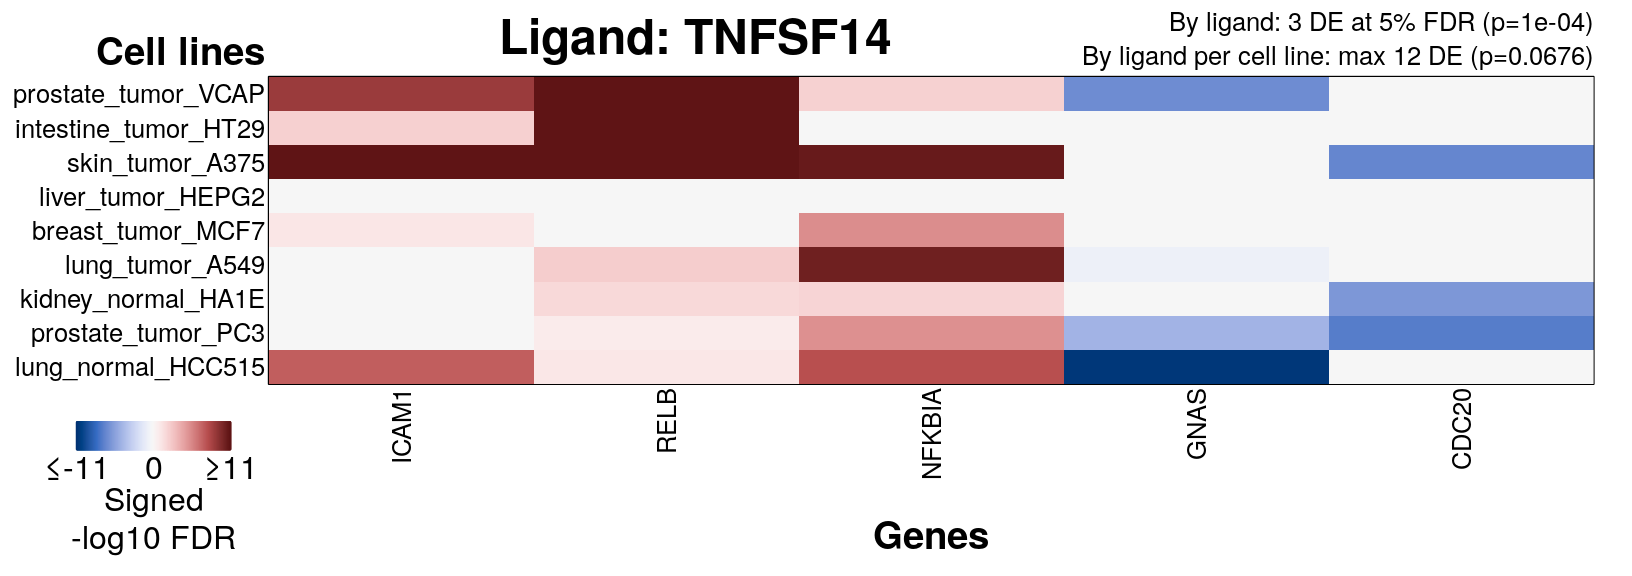
There were 21 ligands out of 295 (7%) that did not show improvement in consistency of transcriptional response in at least one cell line when considering cell line context. The following figures show the responsive genes in each case: