GSEA
Enrichment score correlation
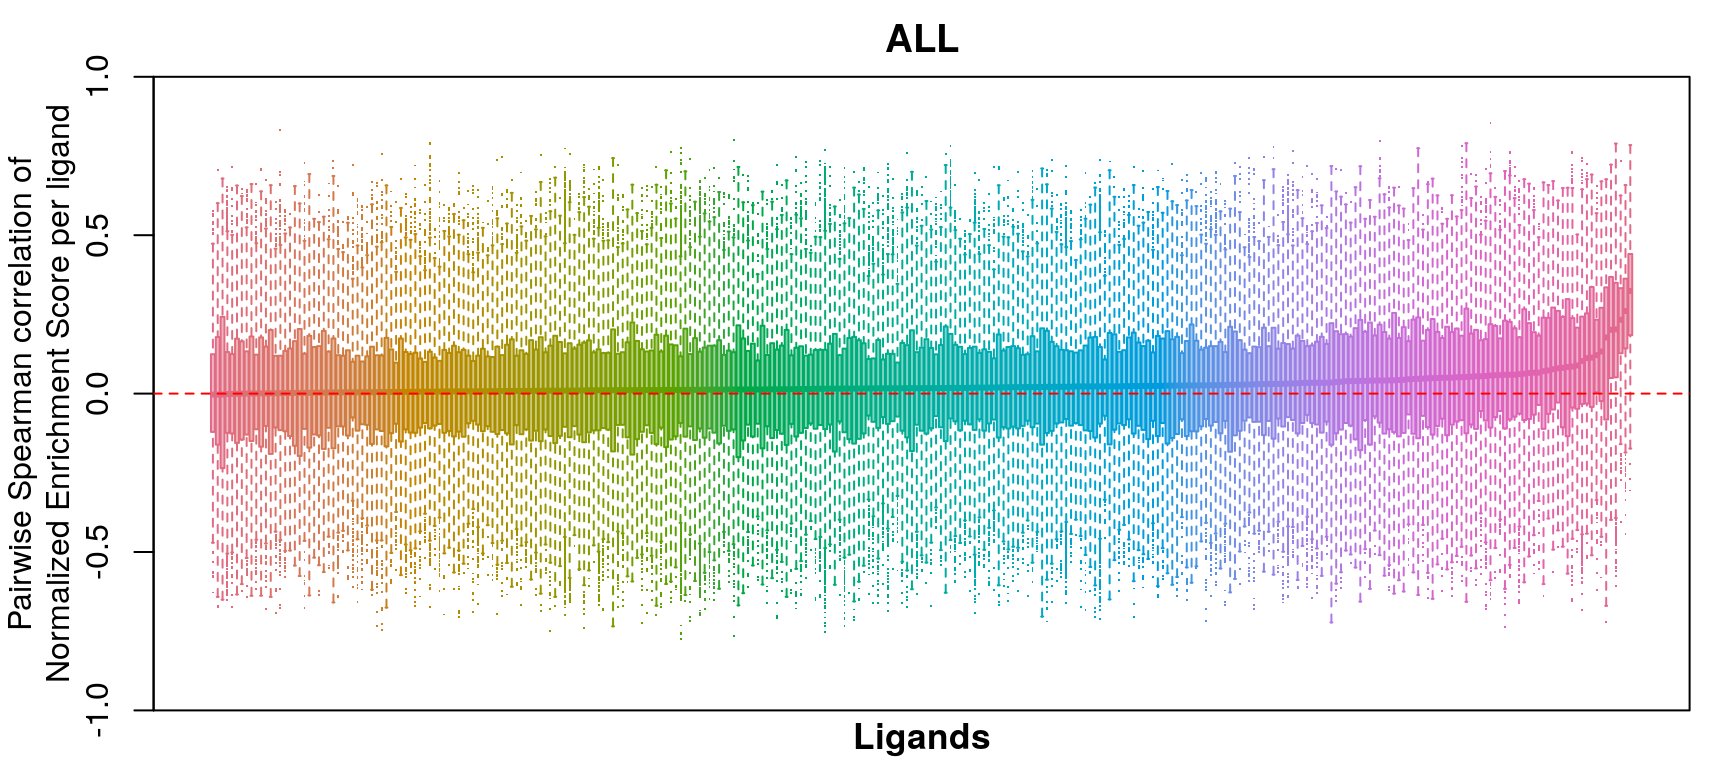
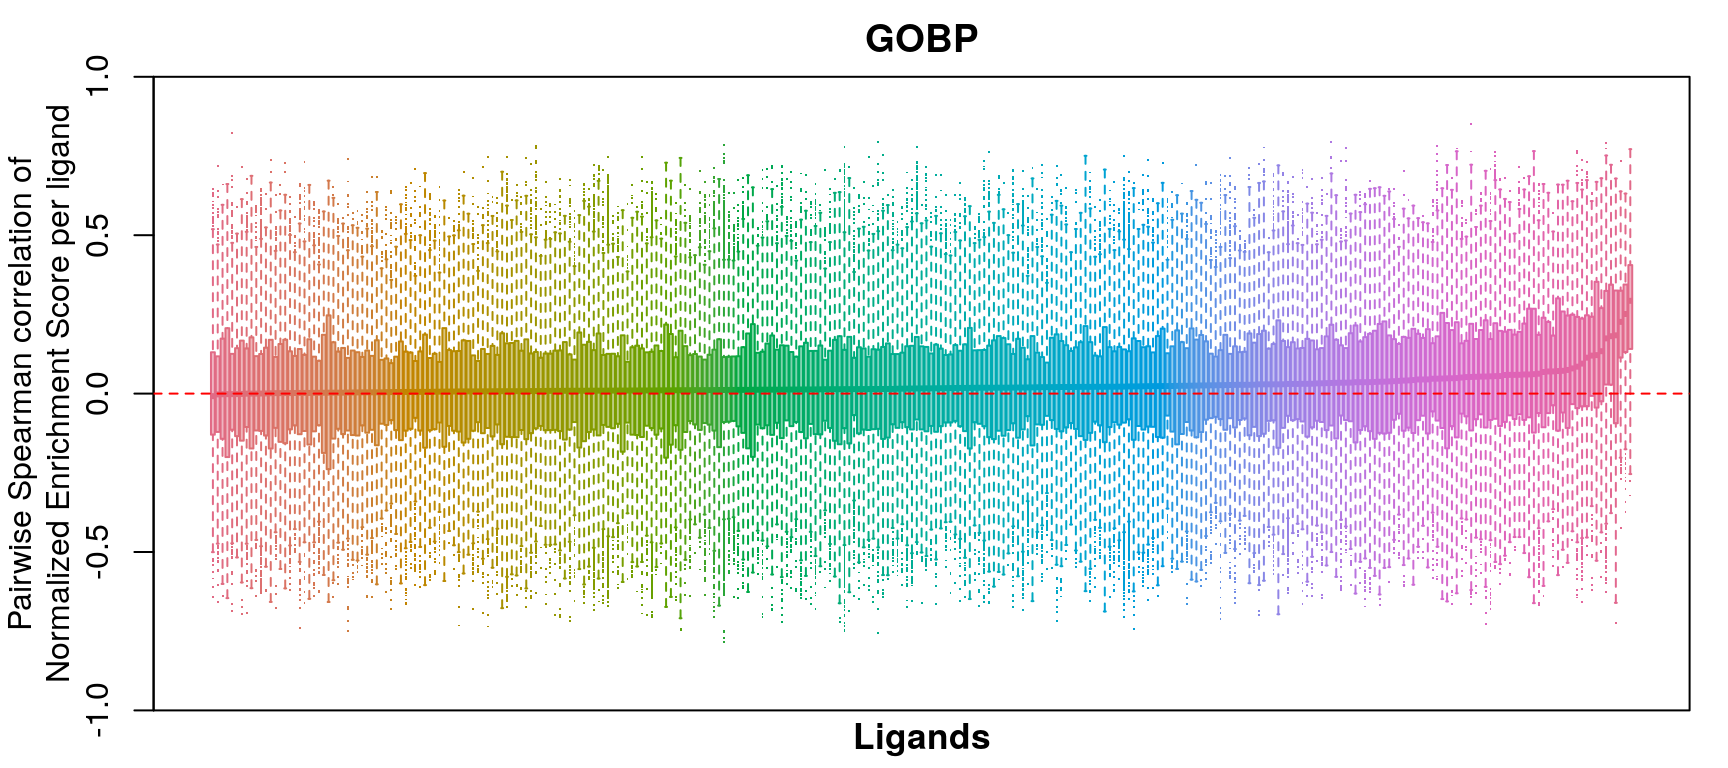
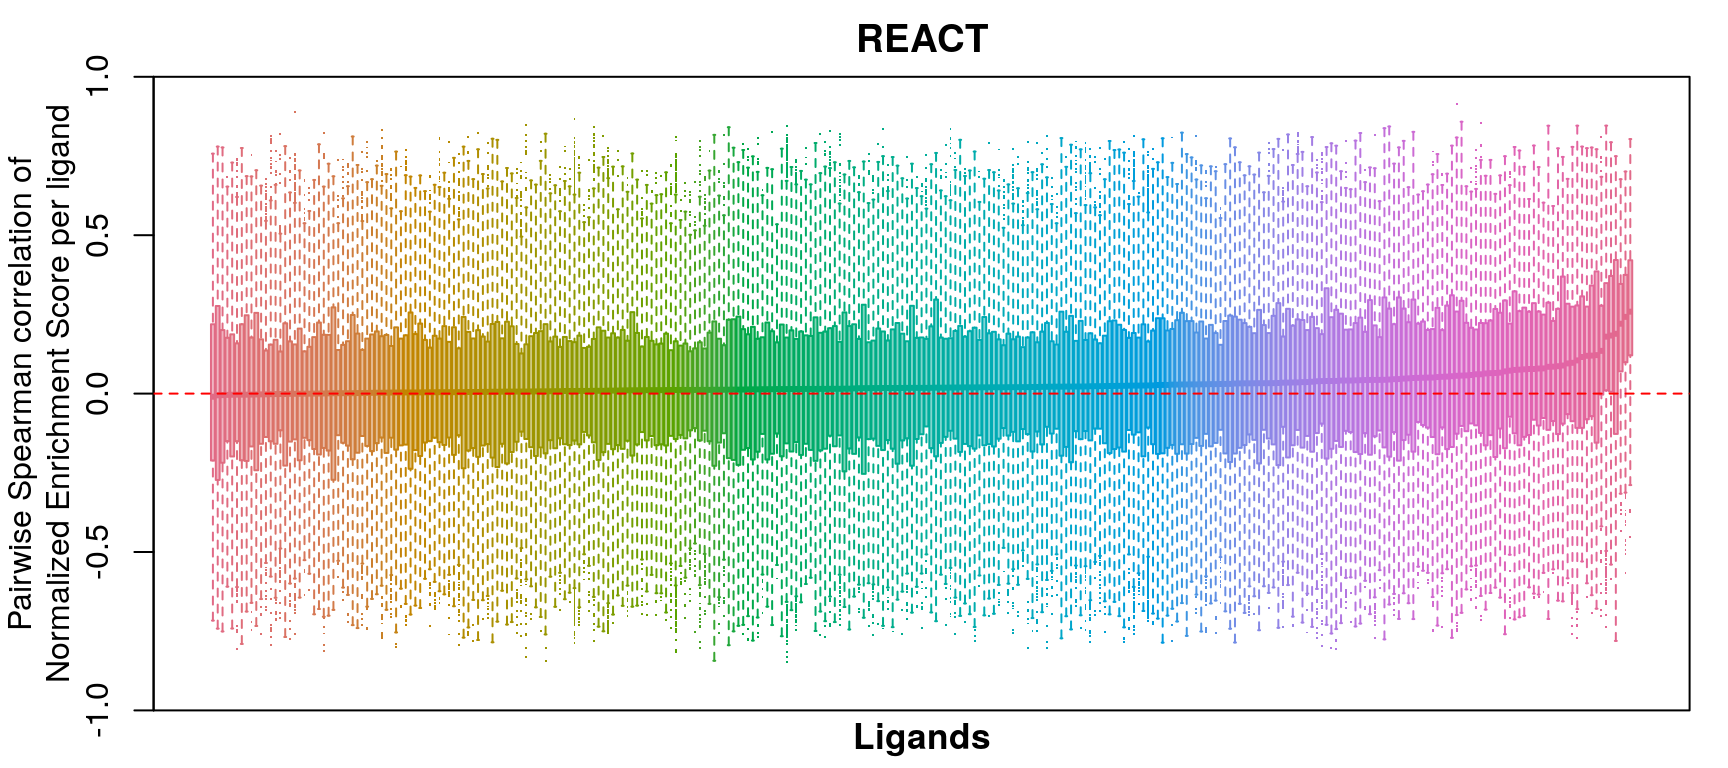
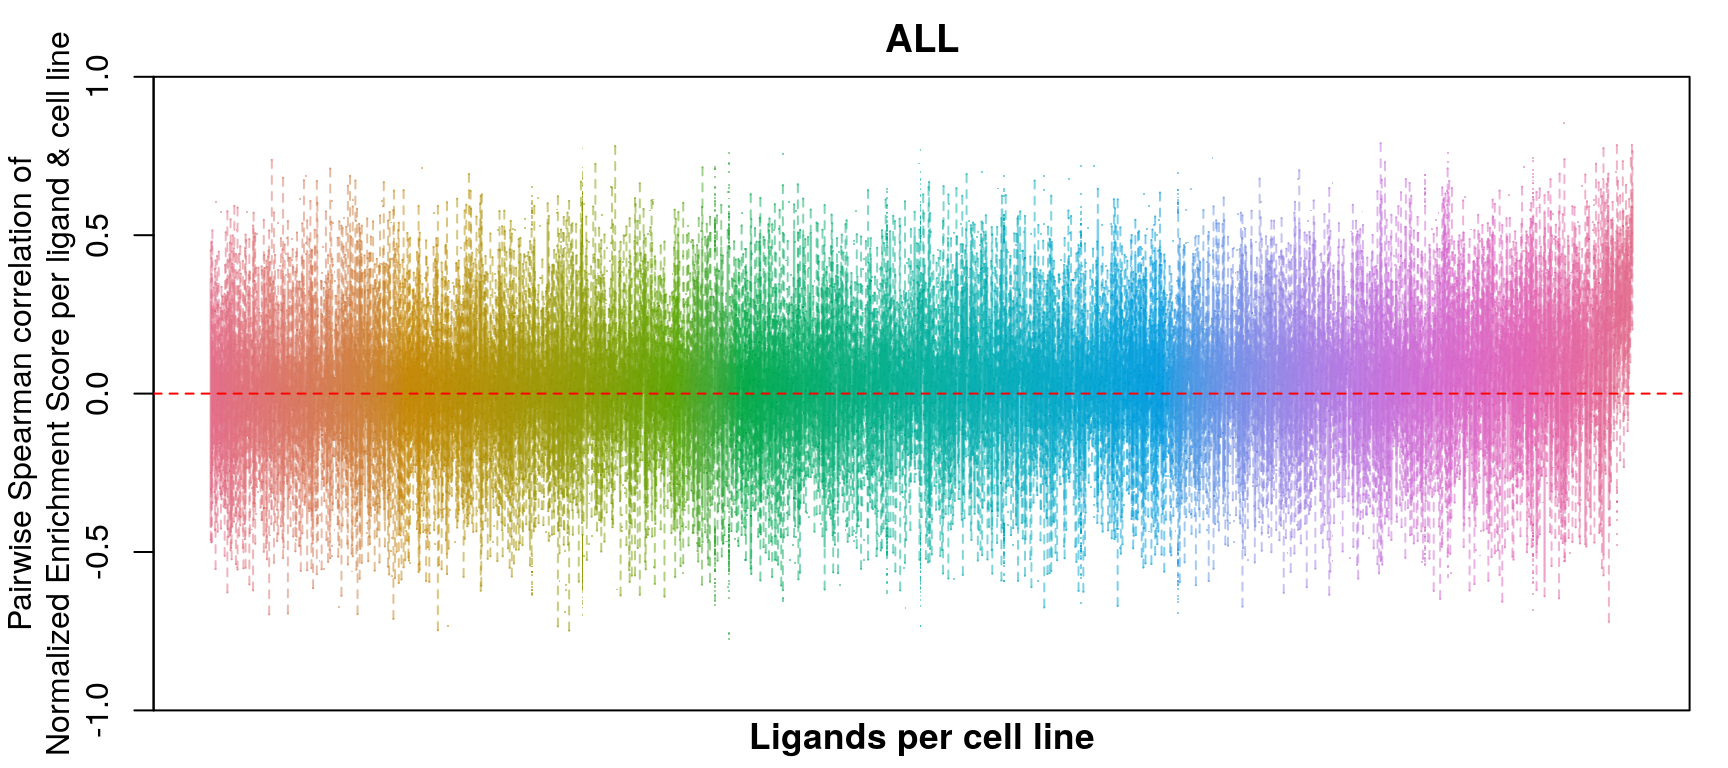
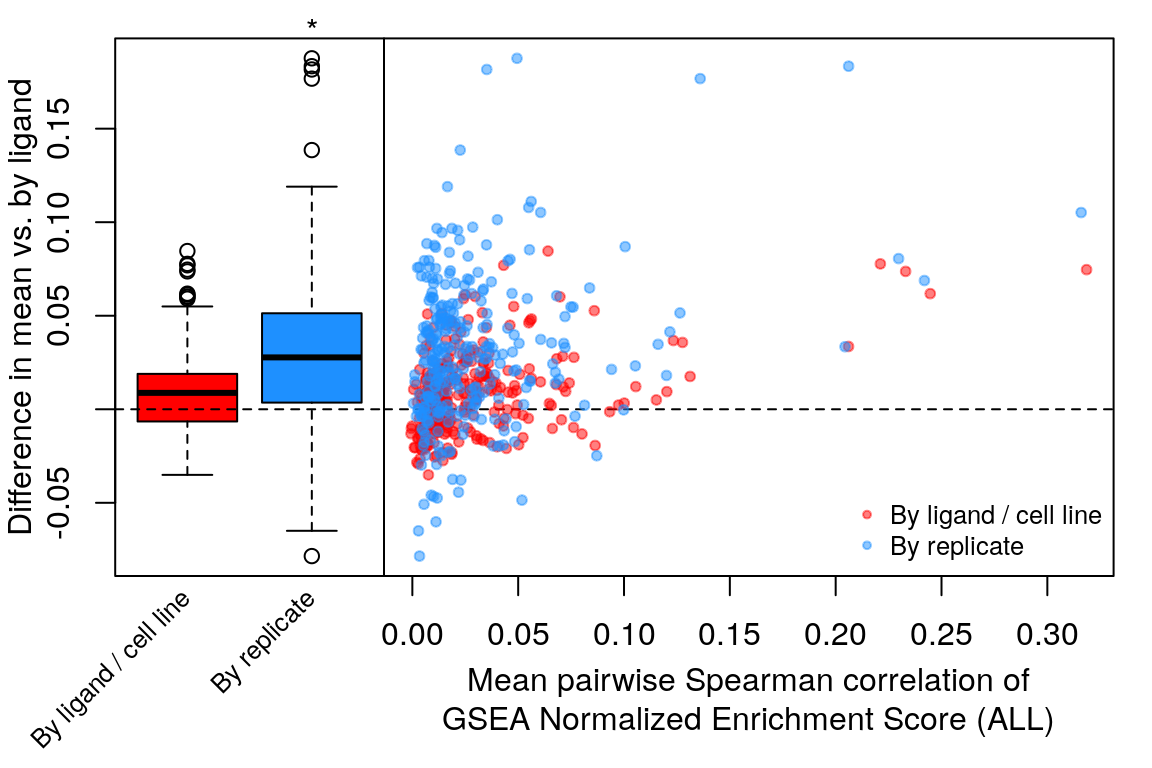
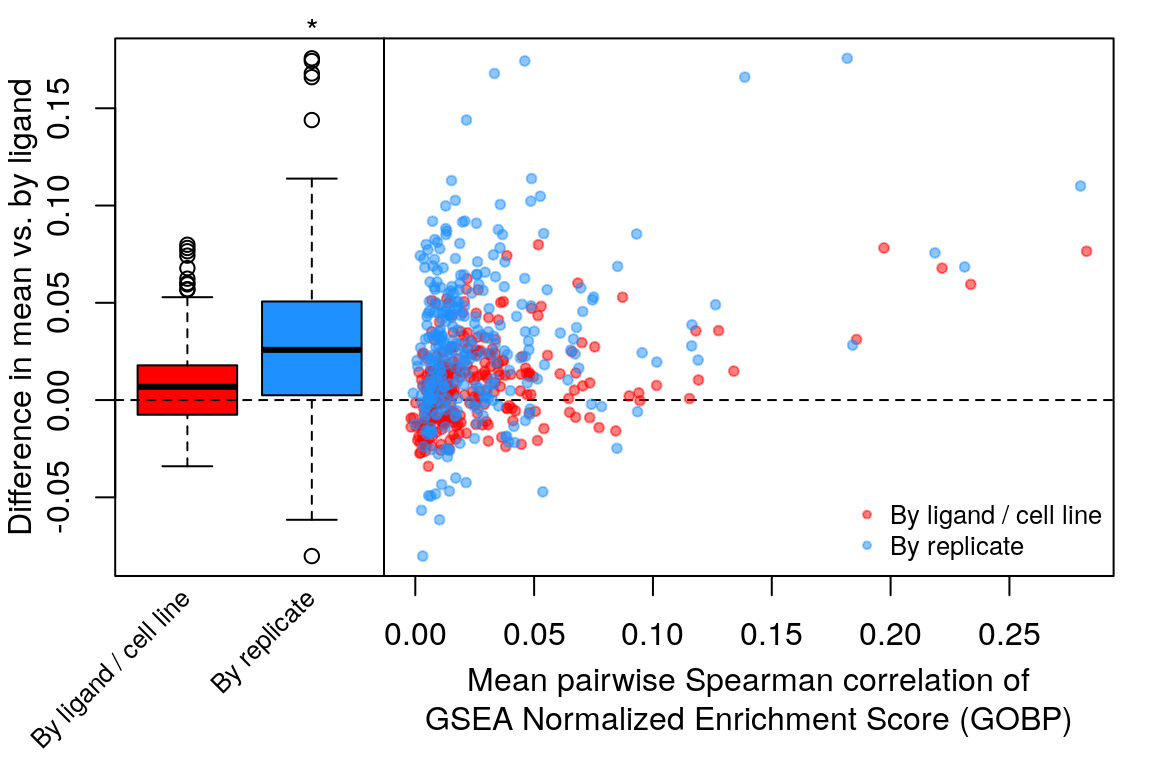
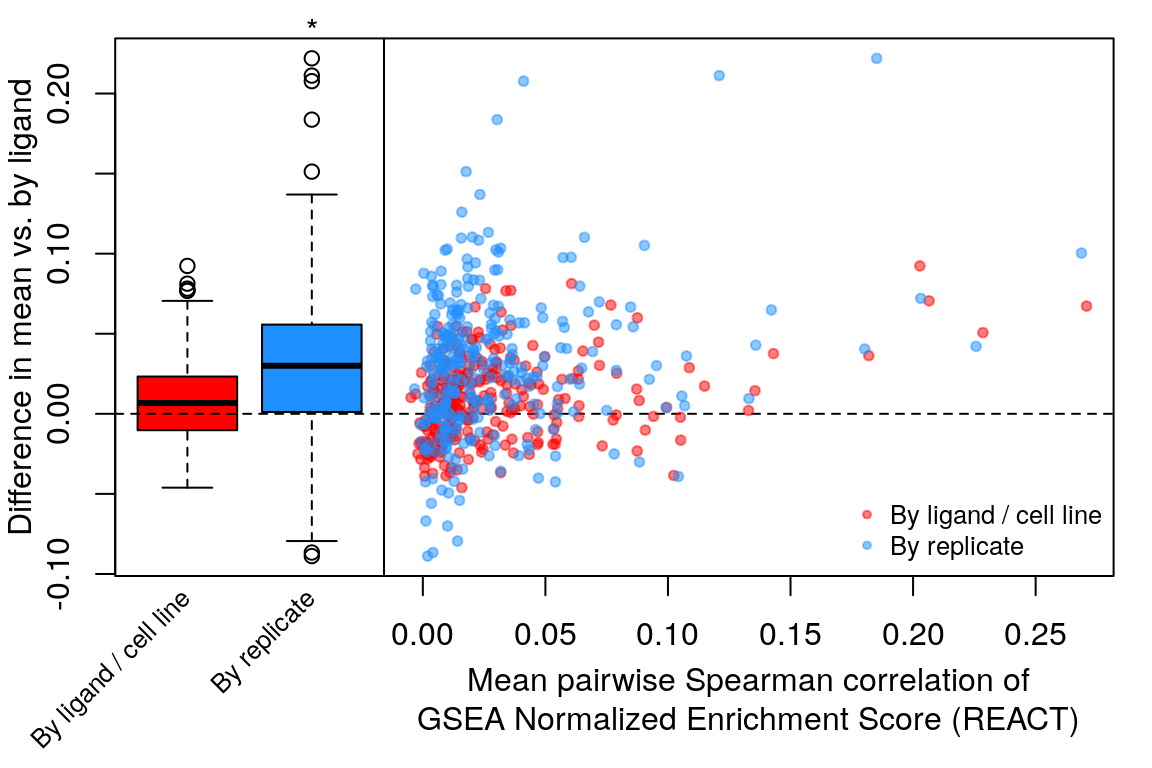
Level 4 data (Z-scores) including inferred genes were used in GSEA analysis. Pathway database was either GO-BP, Reactome, or All (Human_GOBP_AllPathways_no_GO_iea_March_01_2021_entrezgene.gmt from http://www.baderlab.org/GeneSets). Inferred genes were included because without them, most pathways were not covered, which both artificially increased correlation of NES and drastically reduced power due to lack of genes.
Correlation of NES is a really dumb way of comparing enriched gene sets, but I already did the analysis, so here it is.
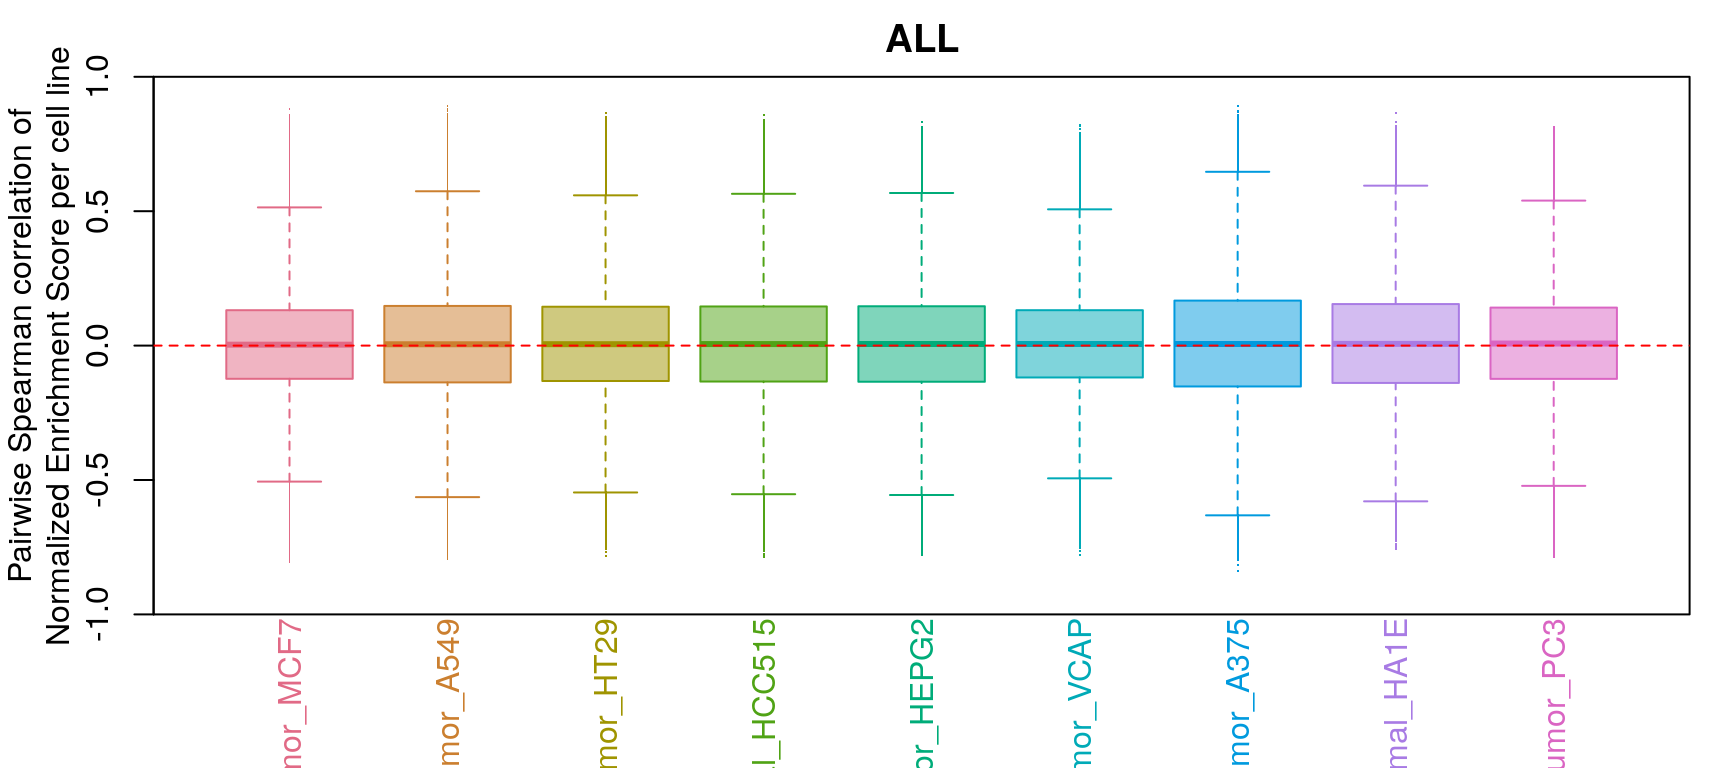
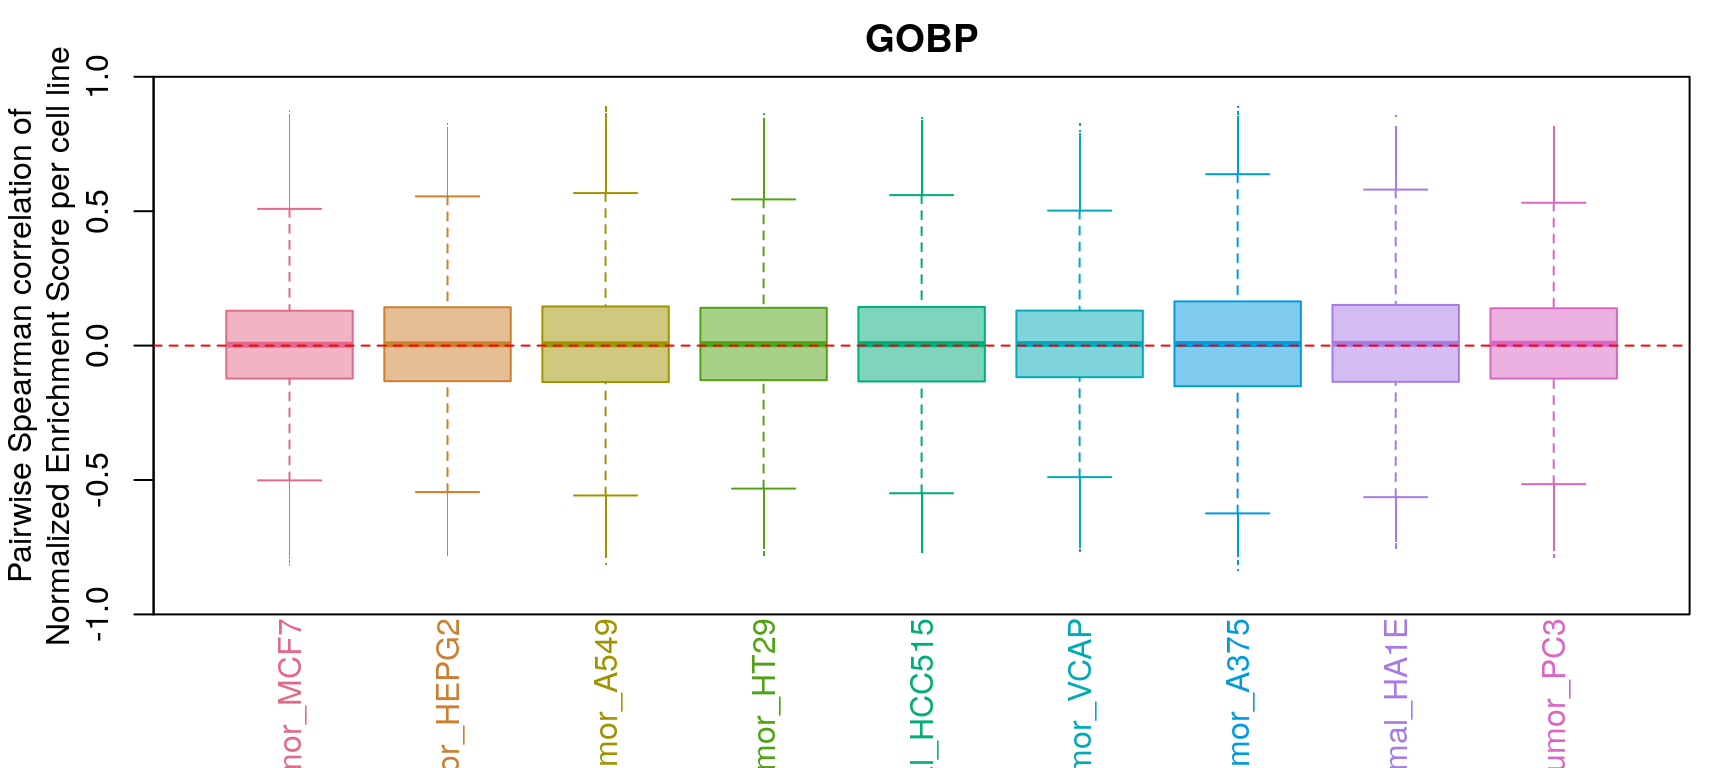
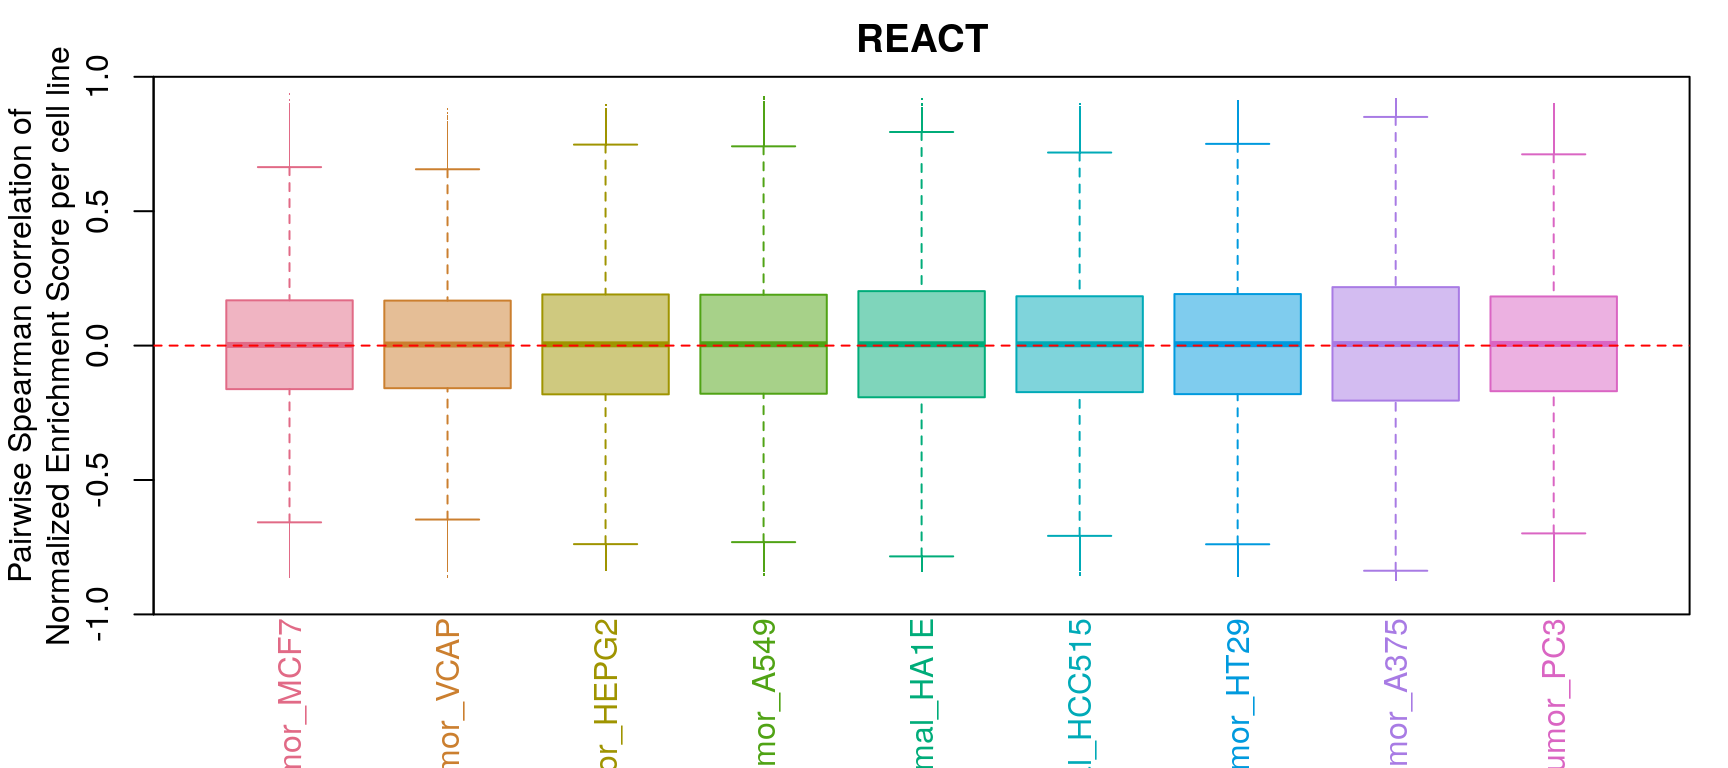
GSEA correlation per cell line
GSEA correlation per ligand
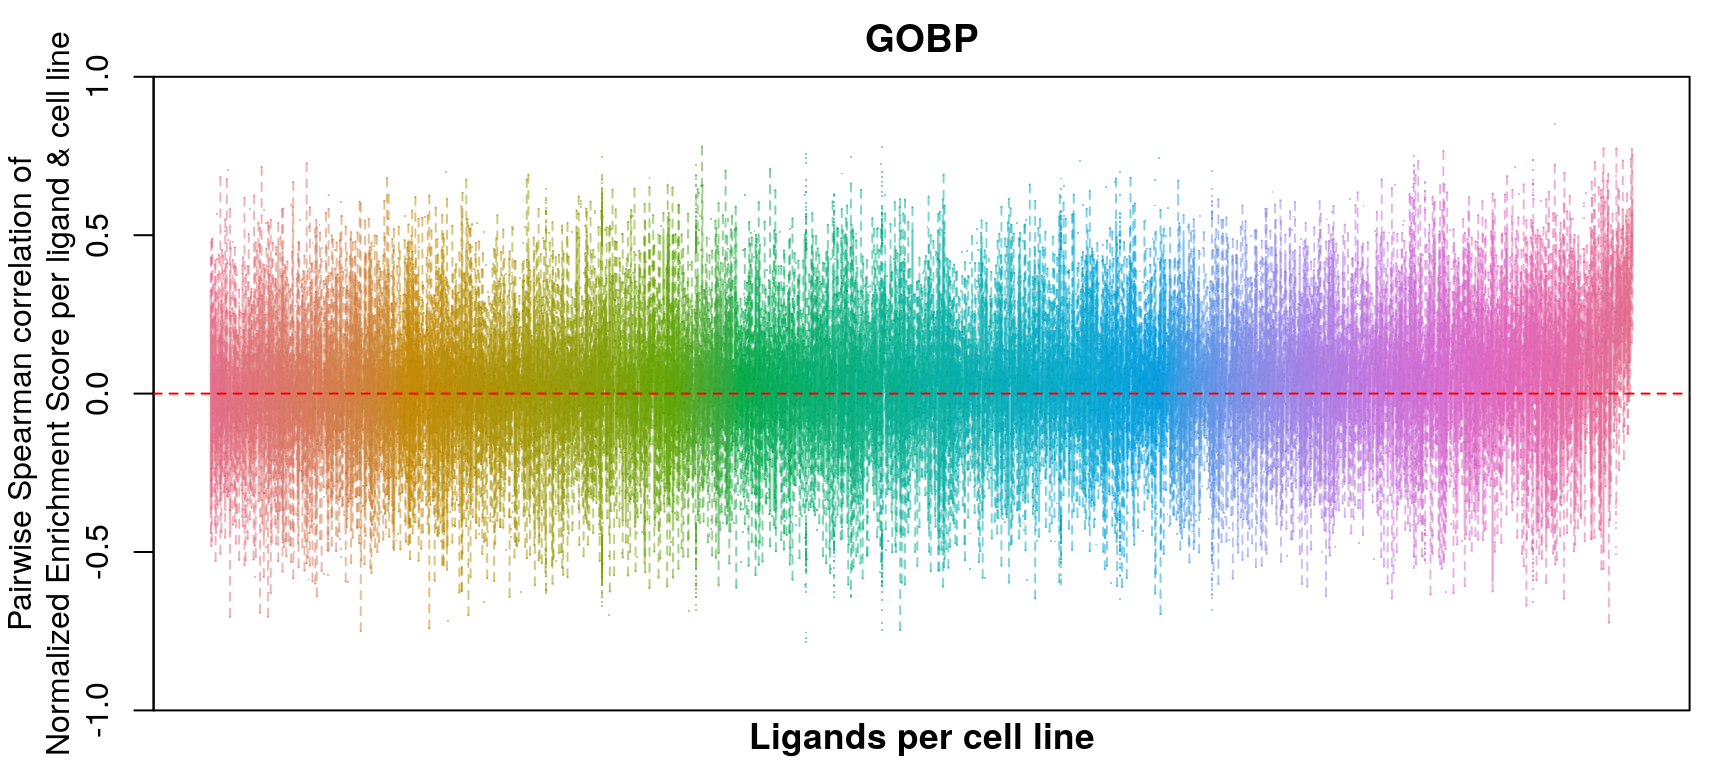
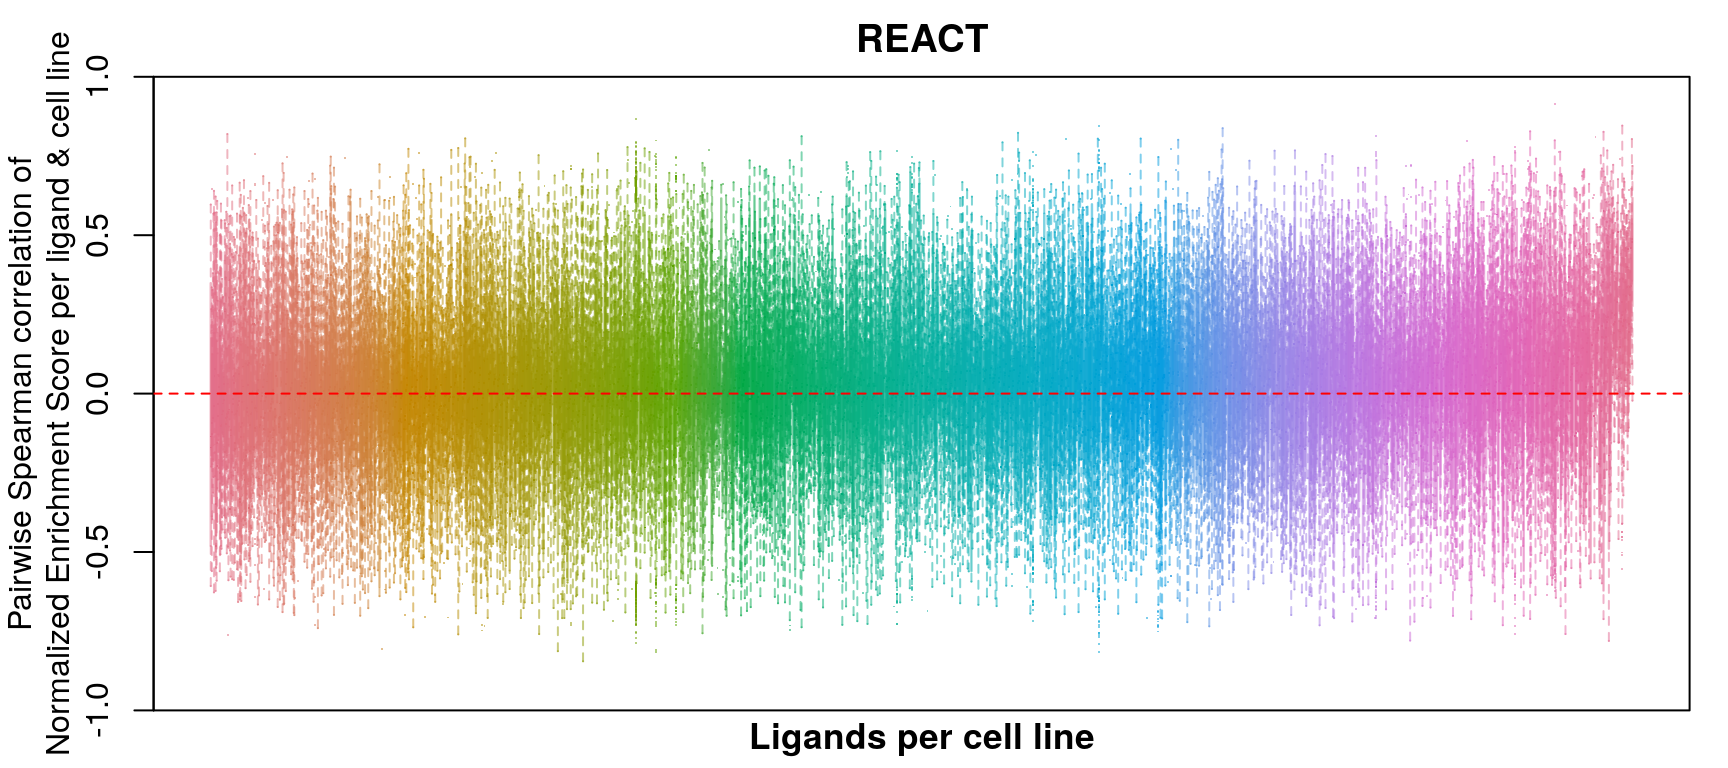
GSEA correlation per ligand & cell line
GSEA correlation per treatment condition (replicate)
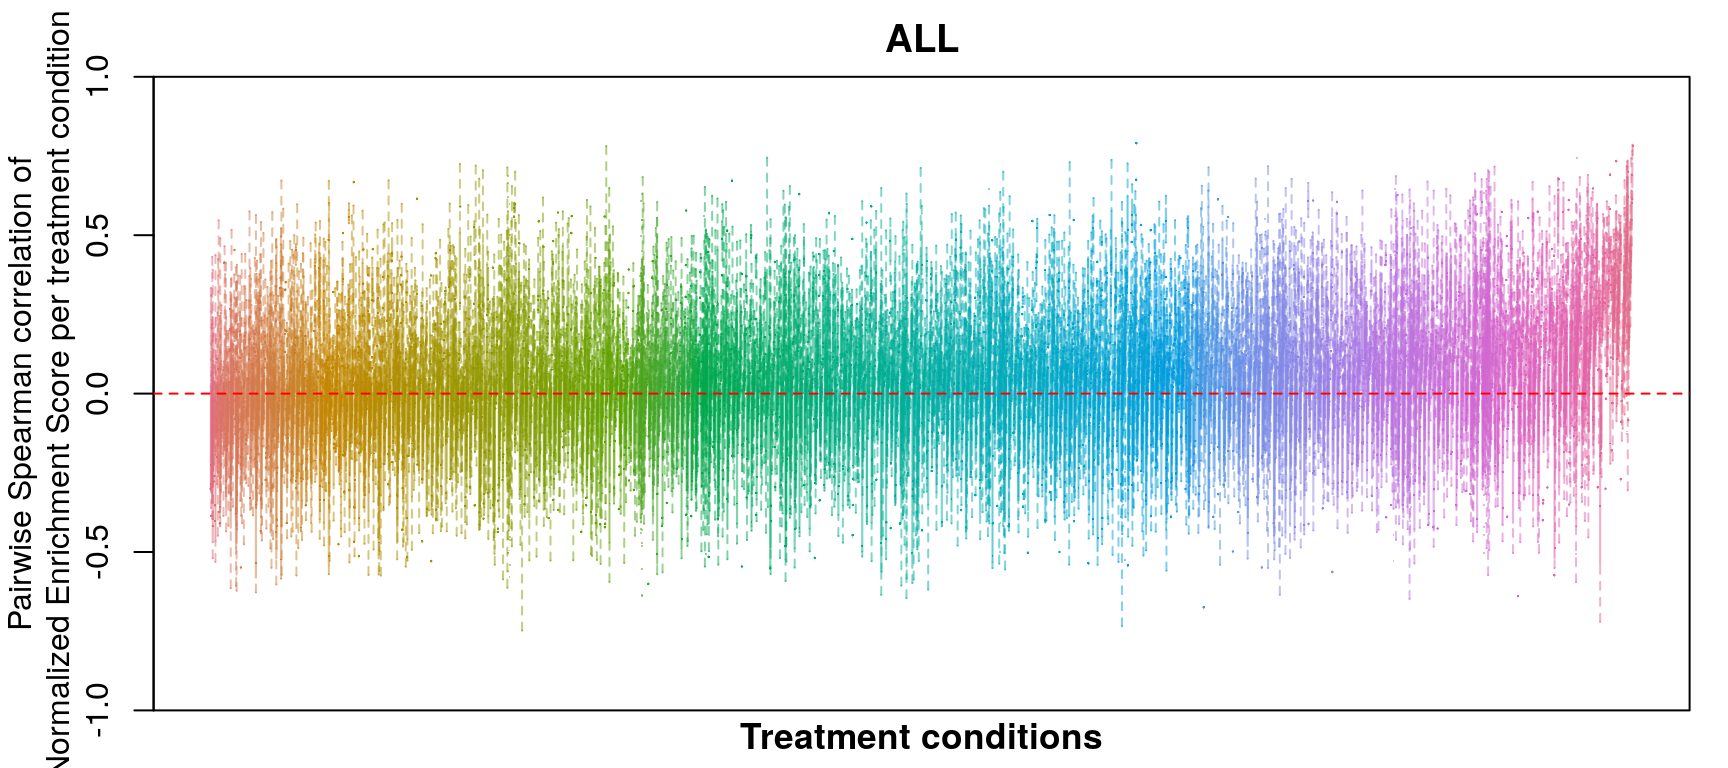

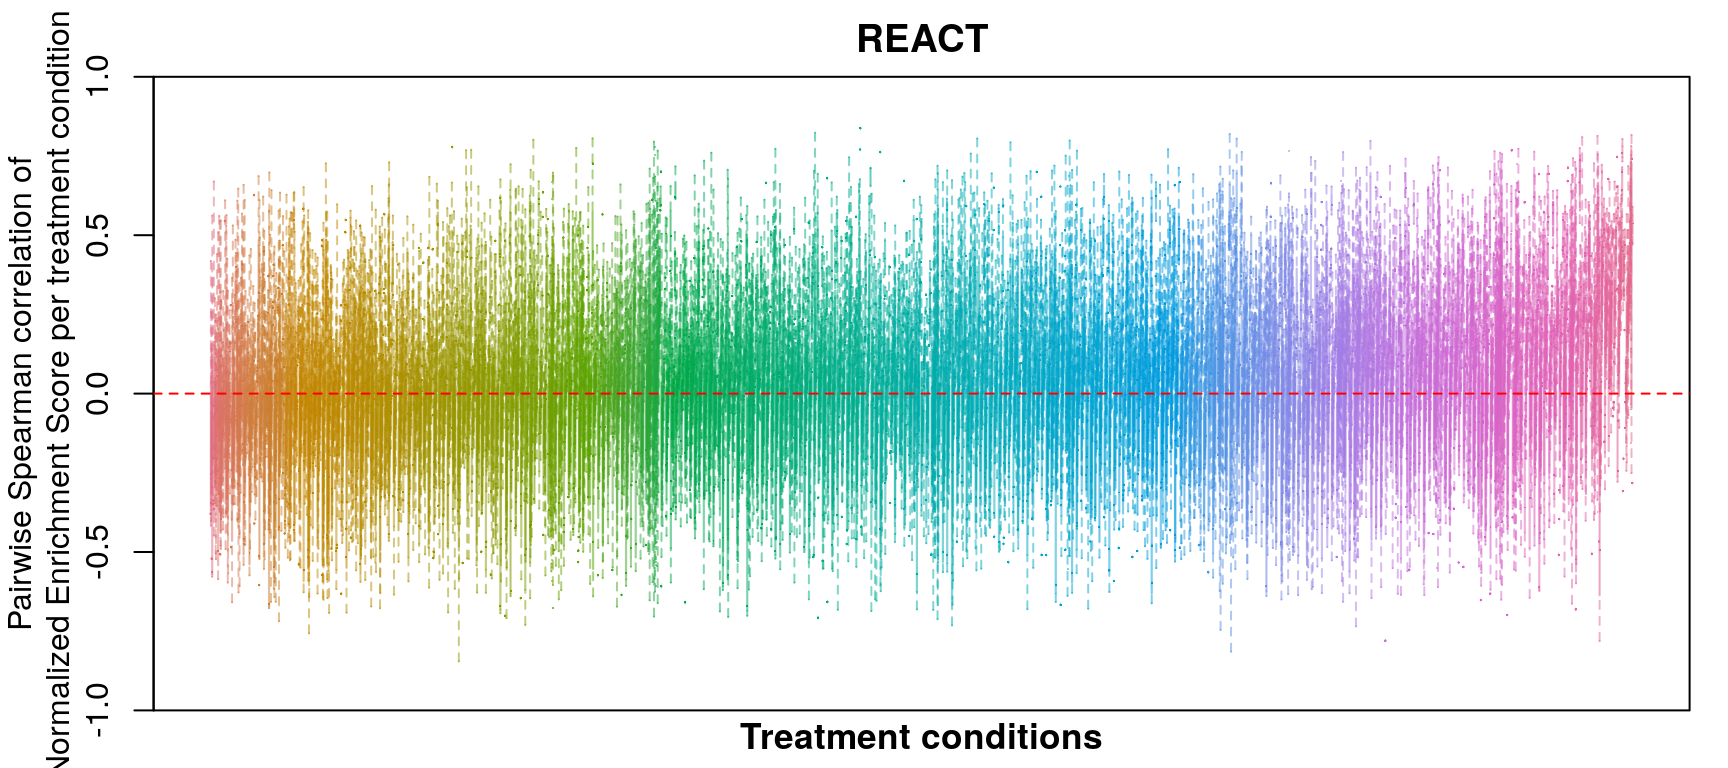
Comparison of all correlation distributions
As you can see, correlation of NES amongst replicates was the only thing that improved, which sort of makes sense as we don’t expect low magnitude NES pathways to correlate at all.
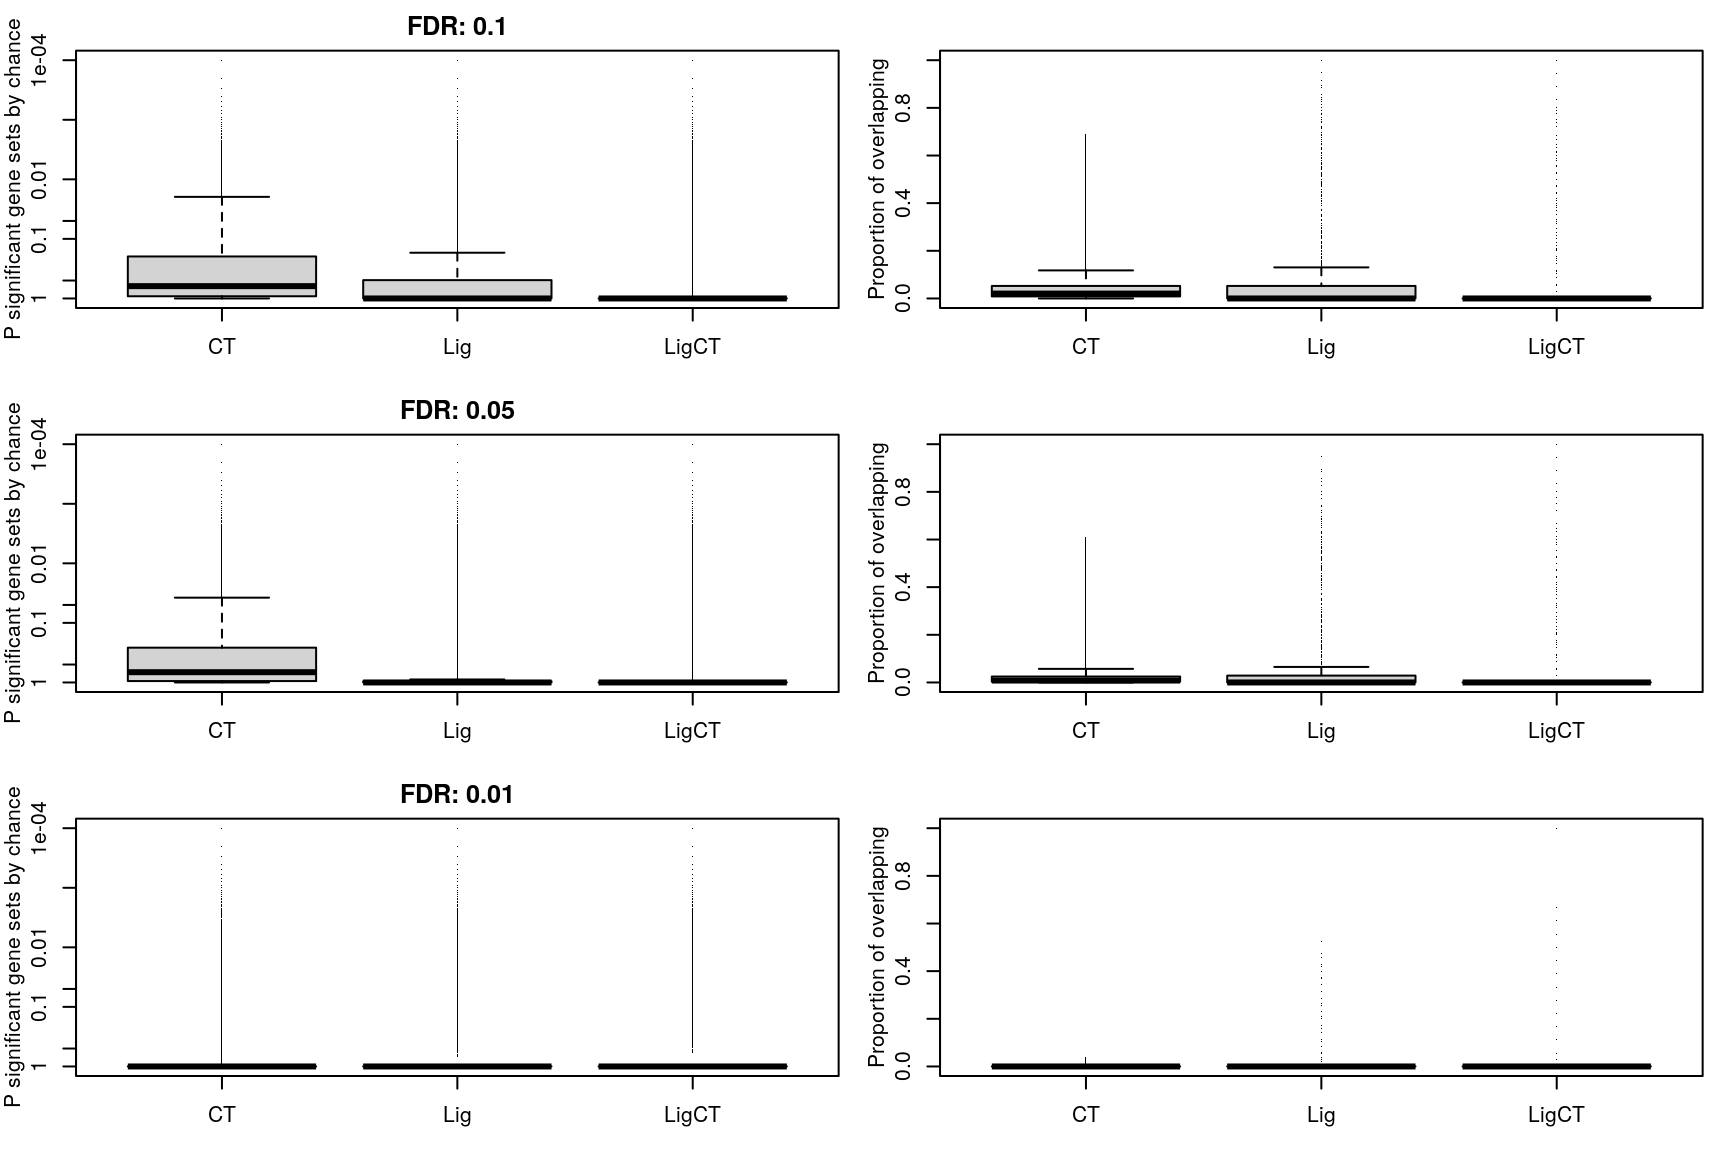
Overlap of enriched gene sets
This is per gene set, which is a weird way of thinking about it.
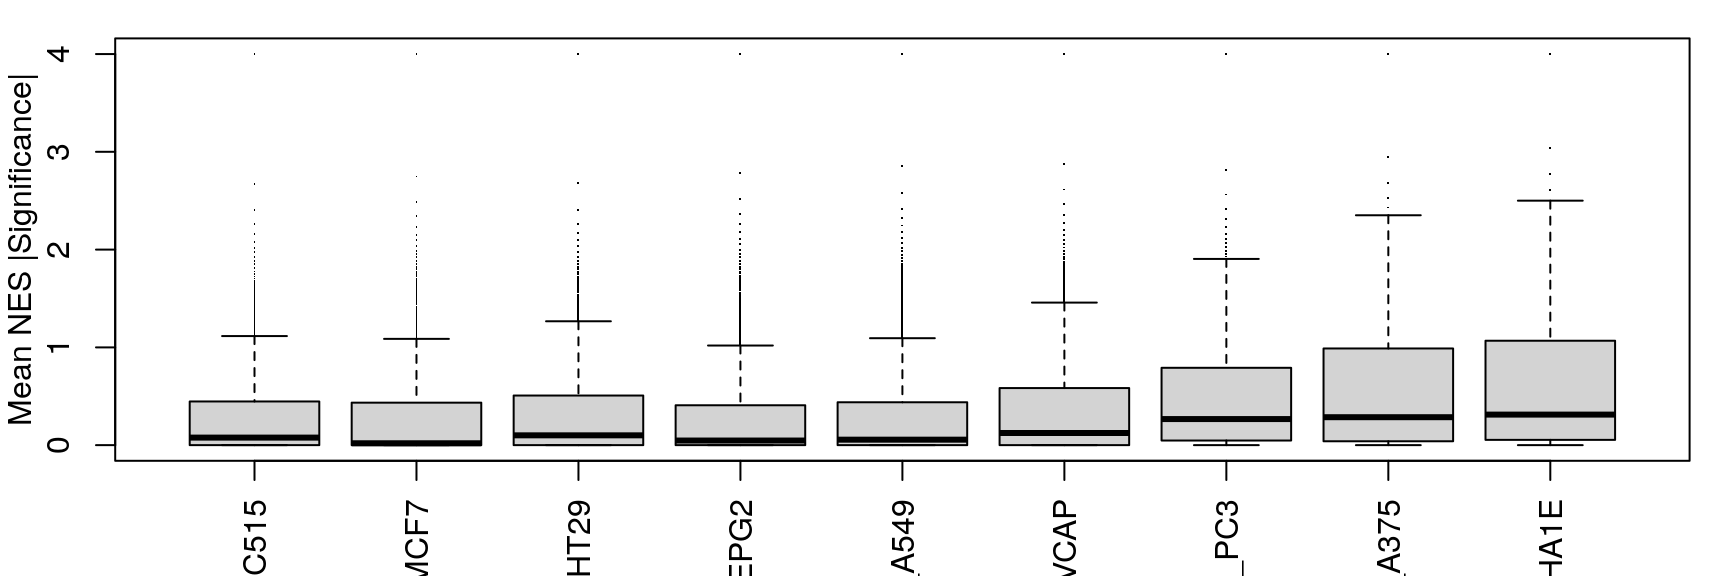
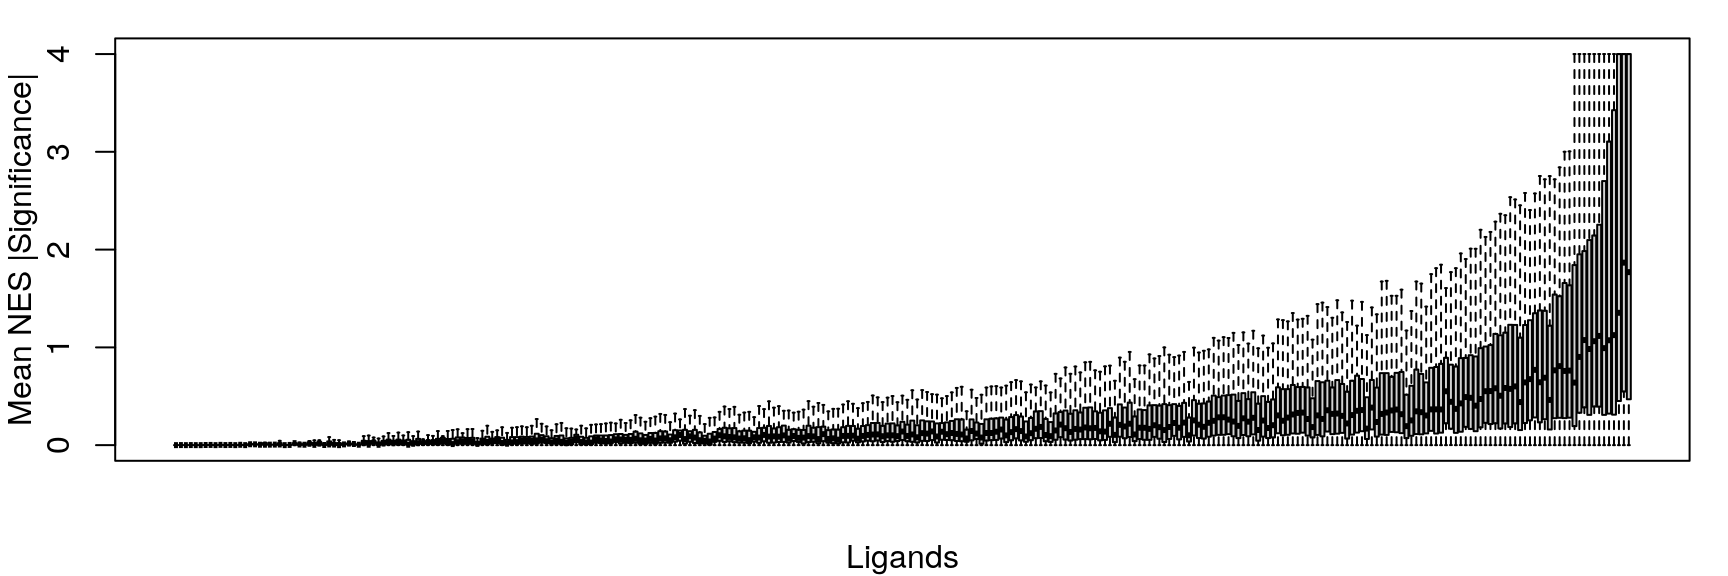
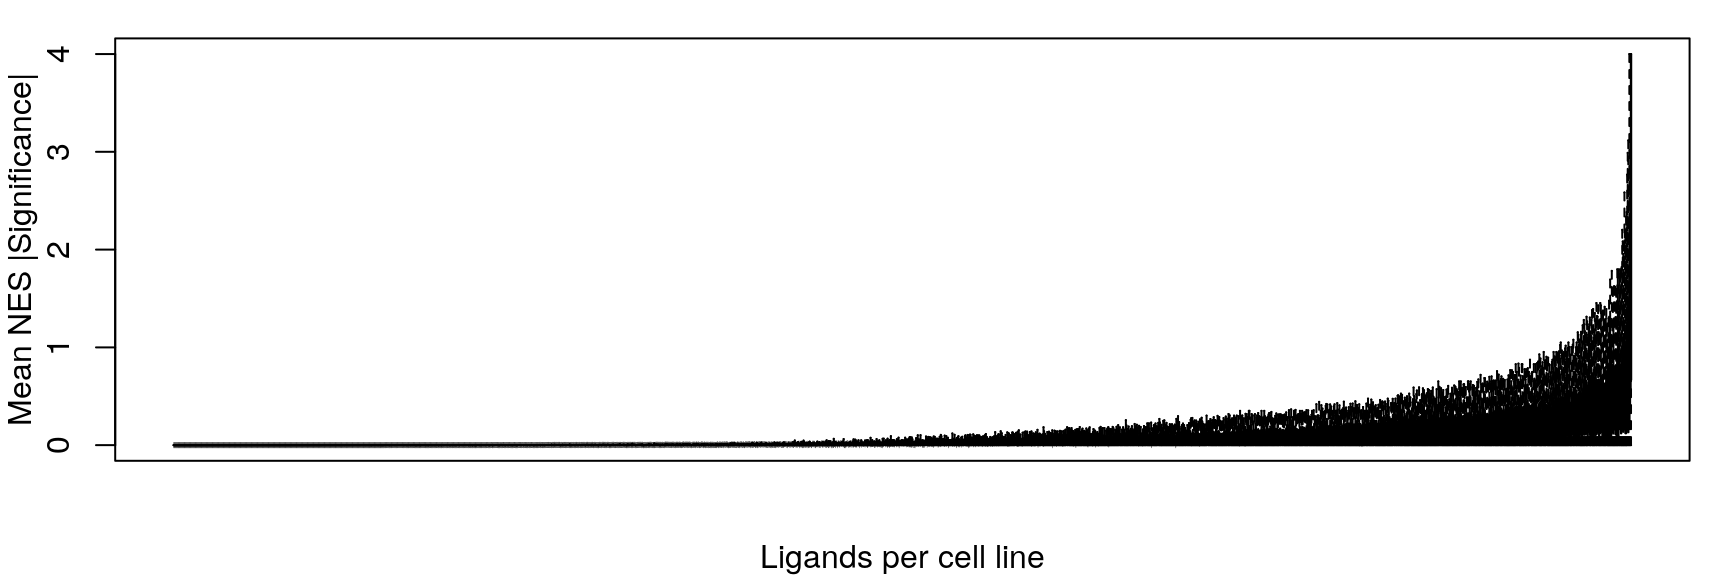
Mean NES
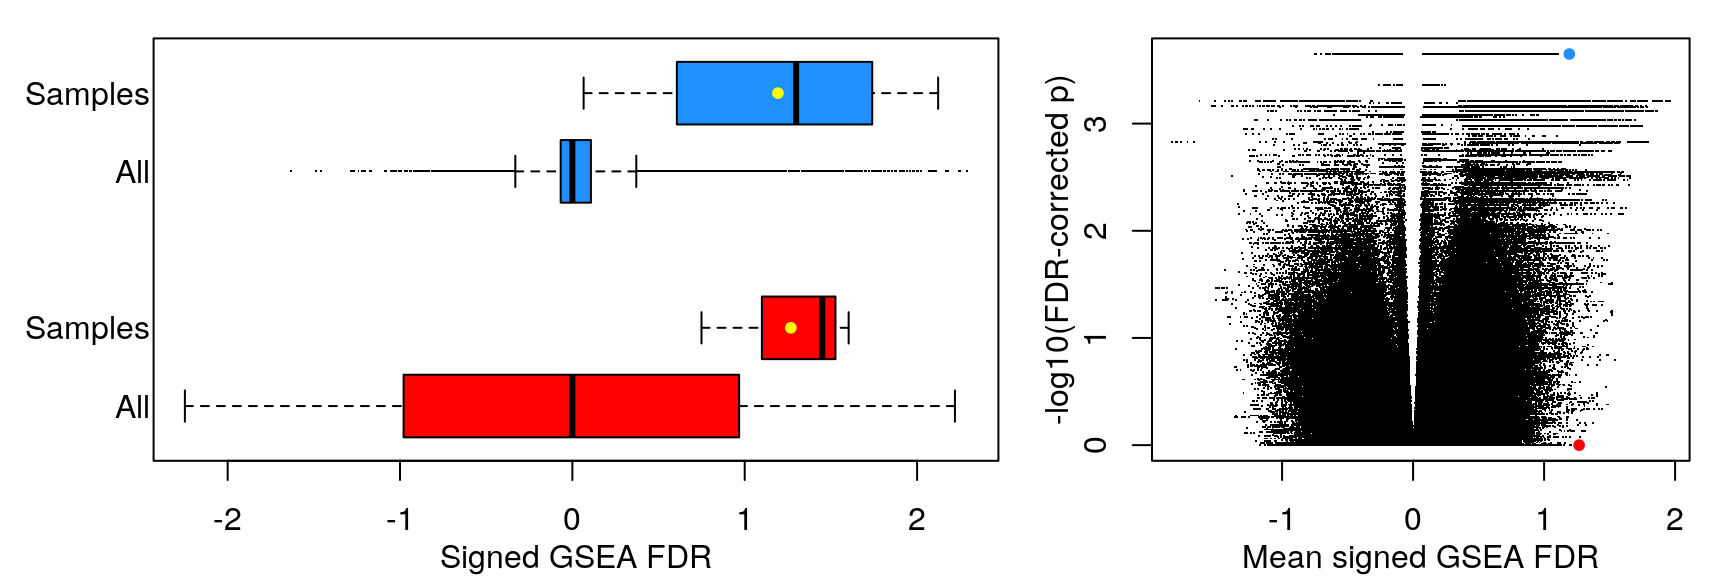
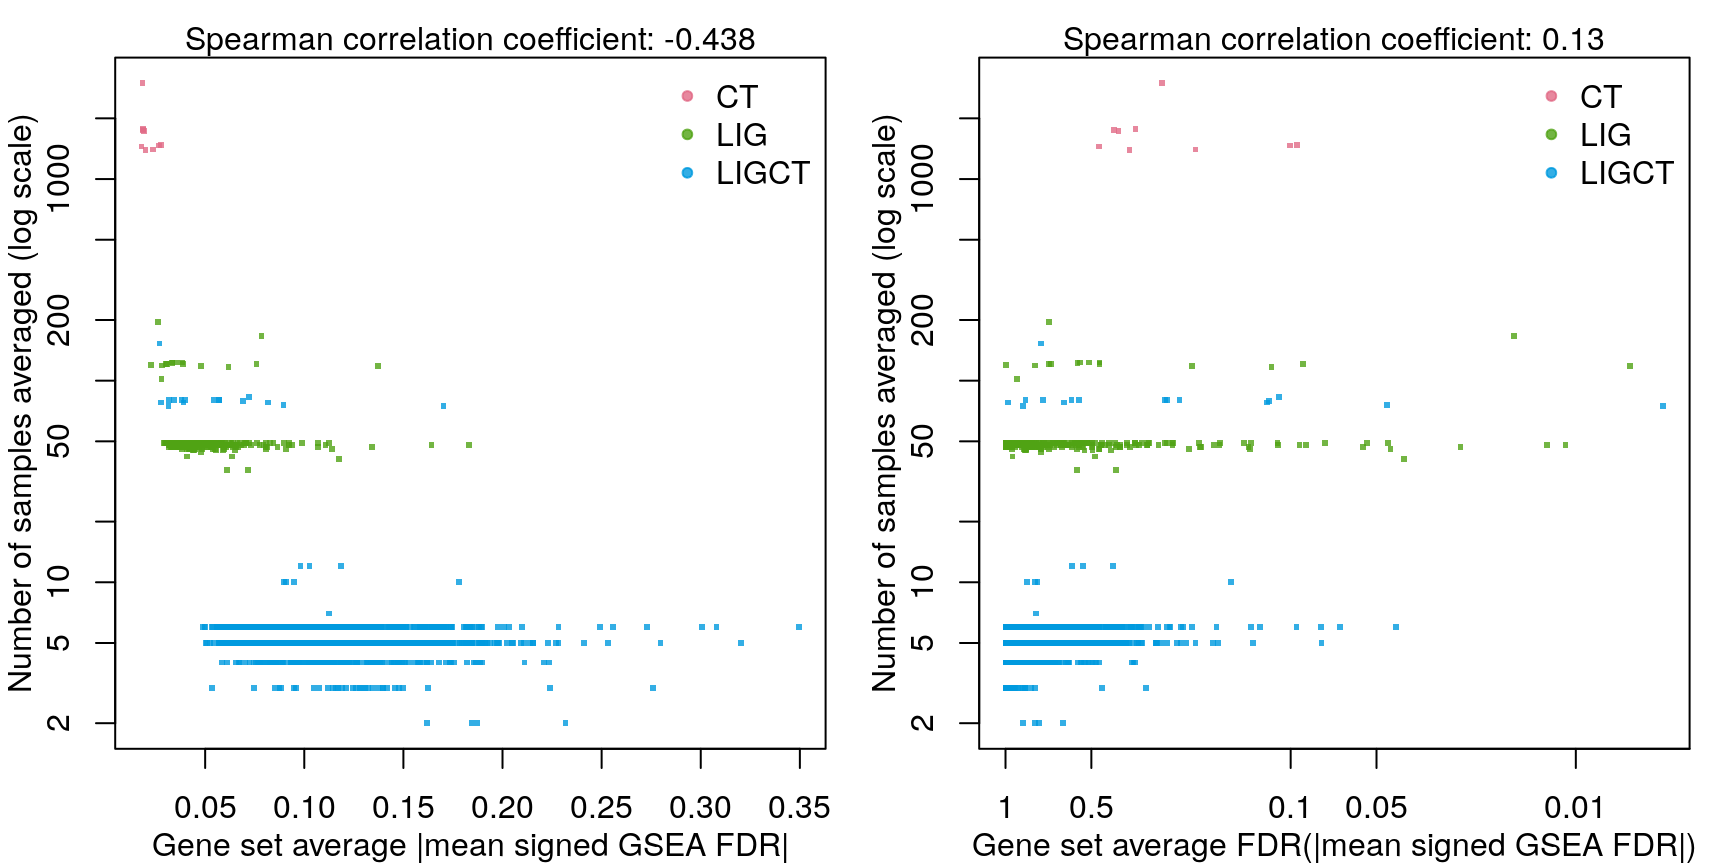
Mean signed FDR
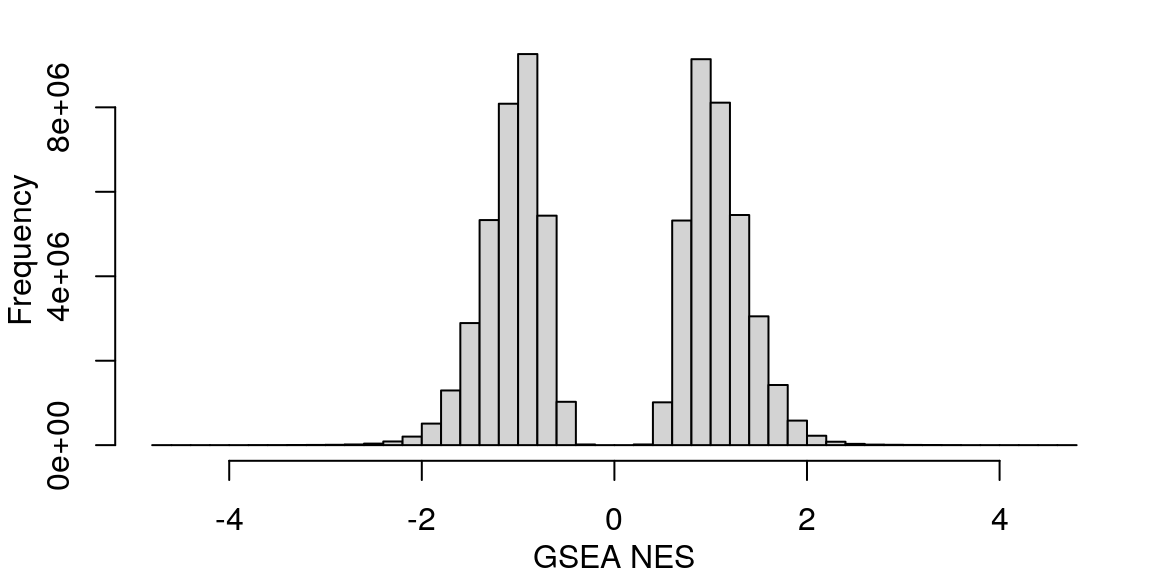
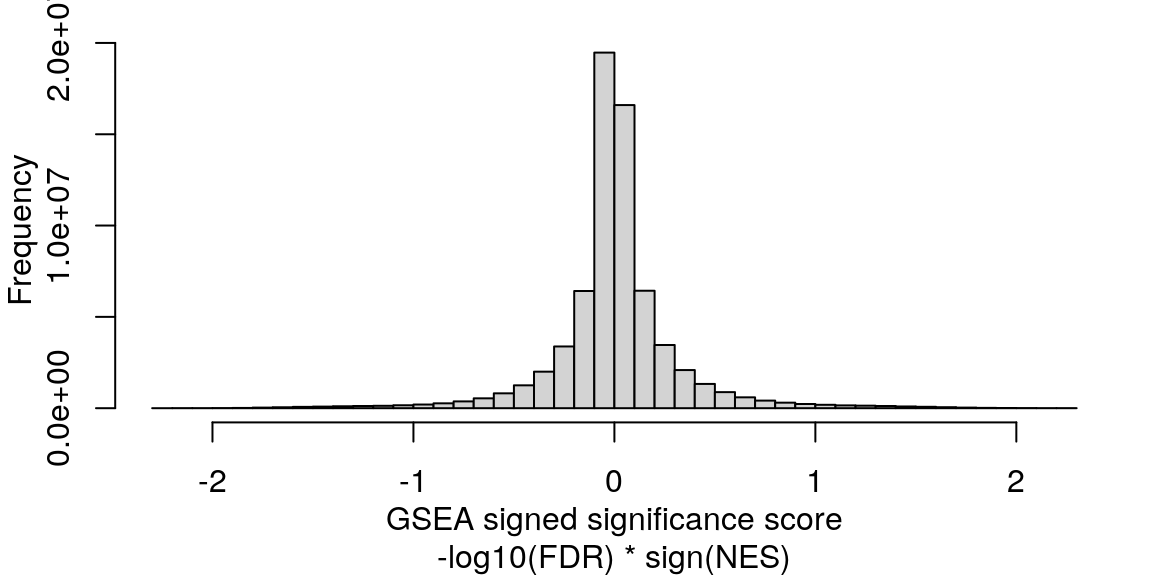
Averaging “significance score” of each gene set across samples. Score is -log10(FDR) * sign(NES). Example distribution:
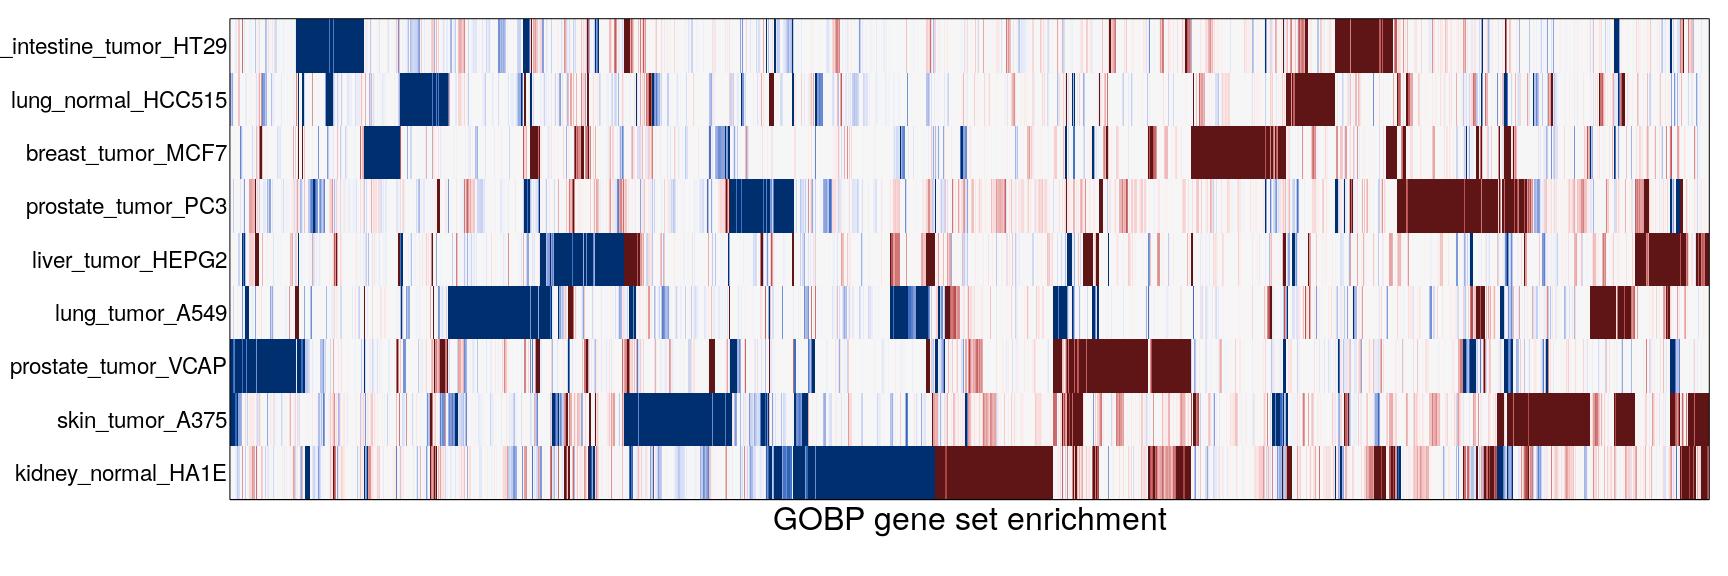
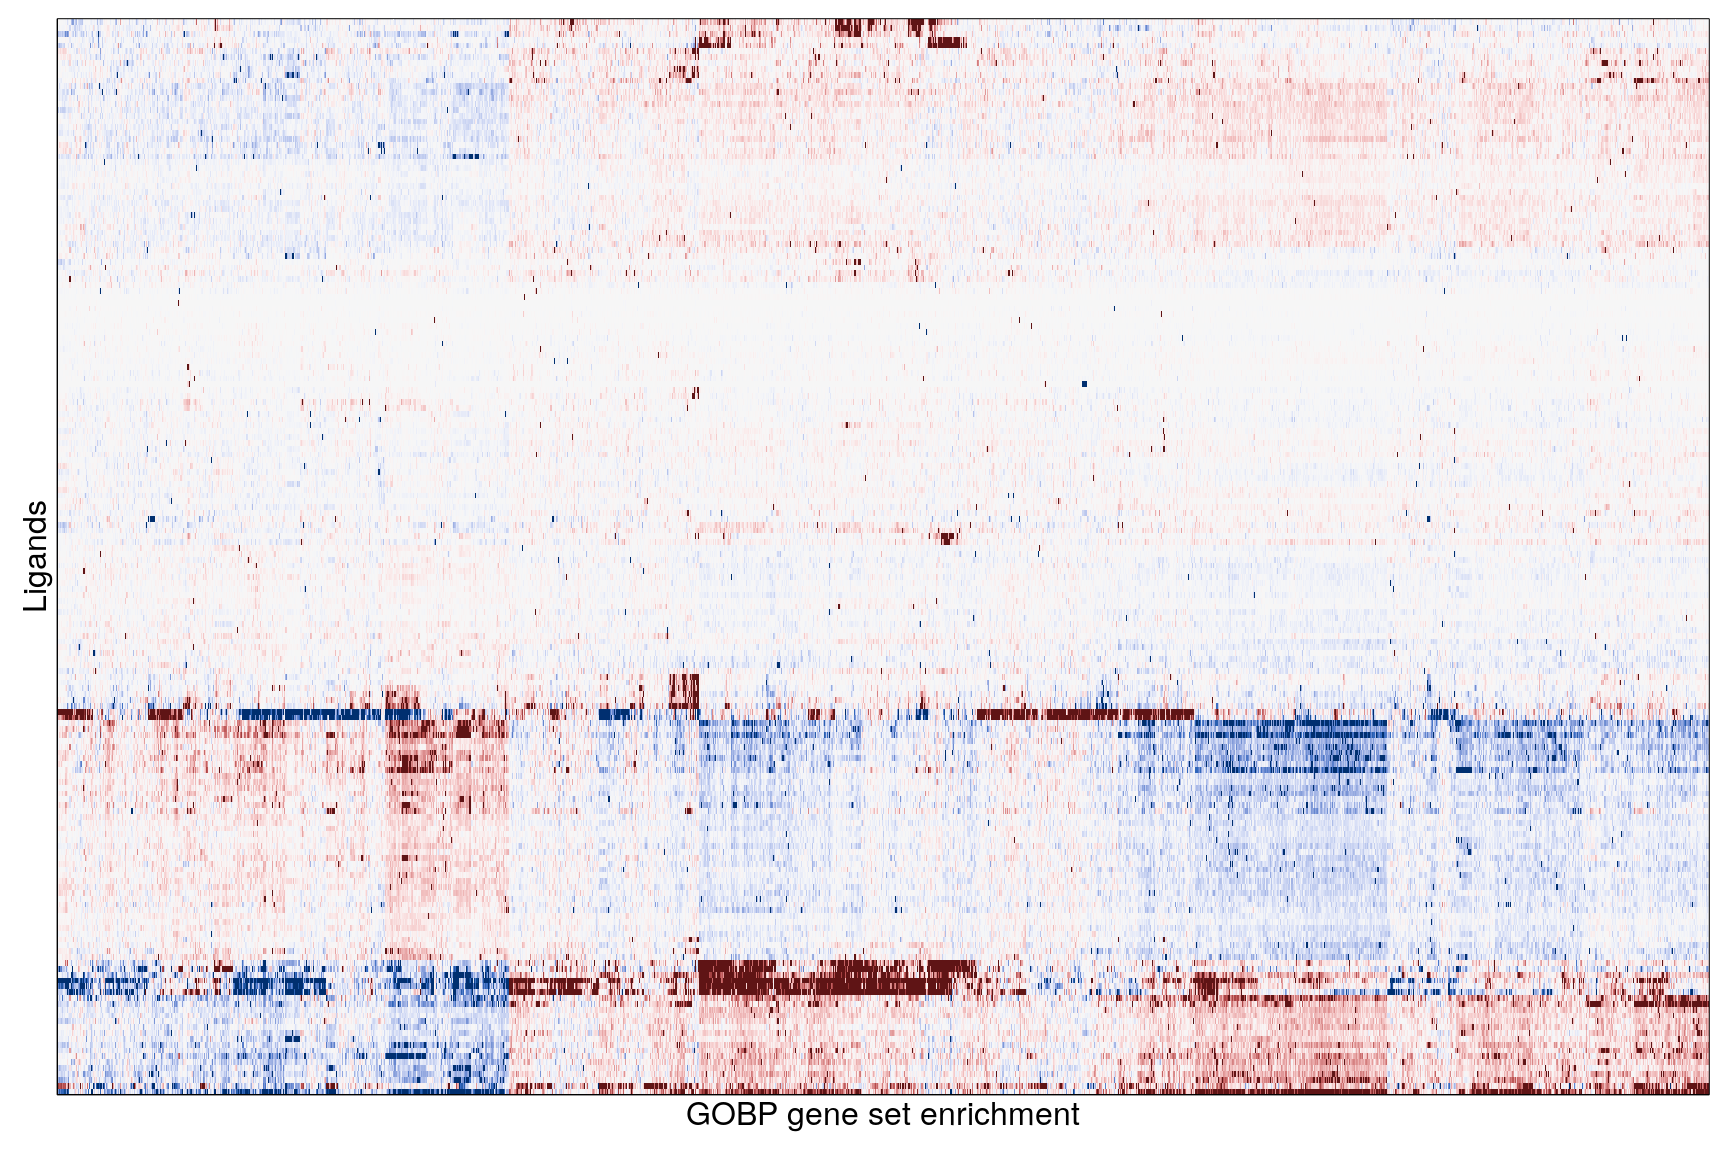
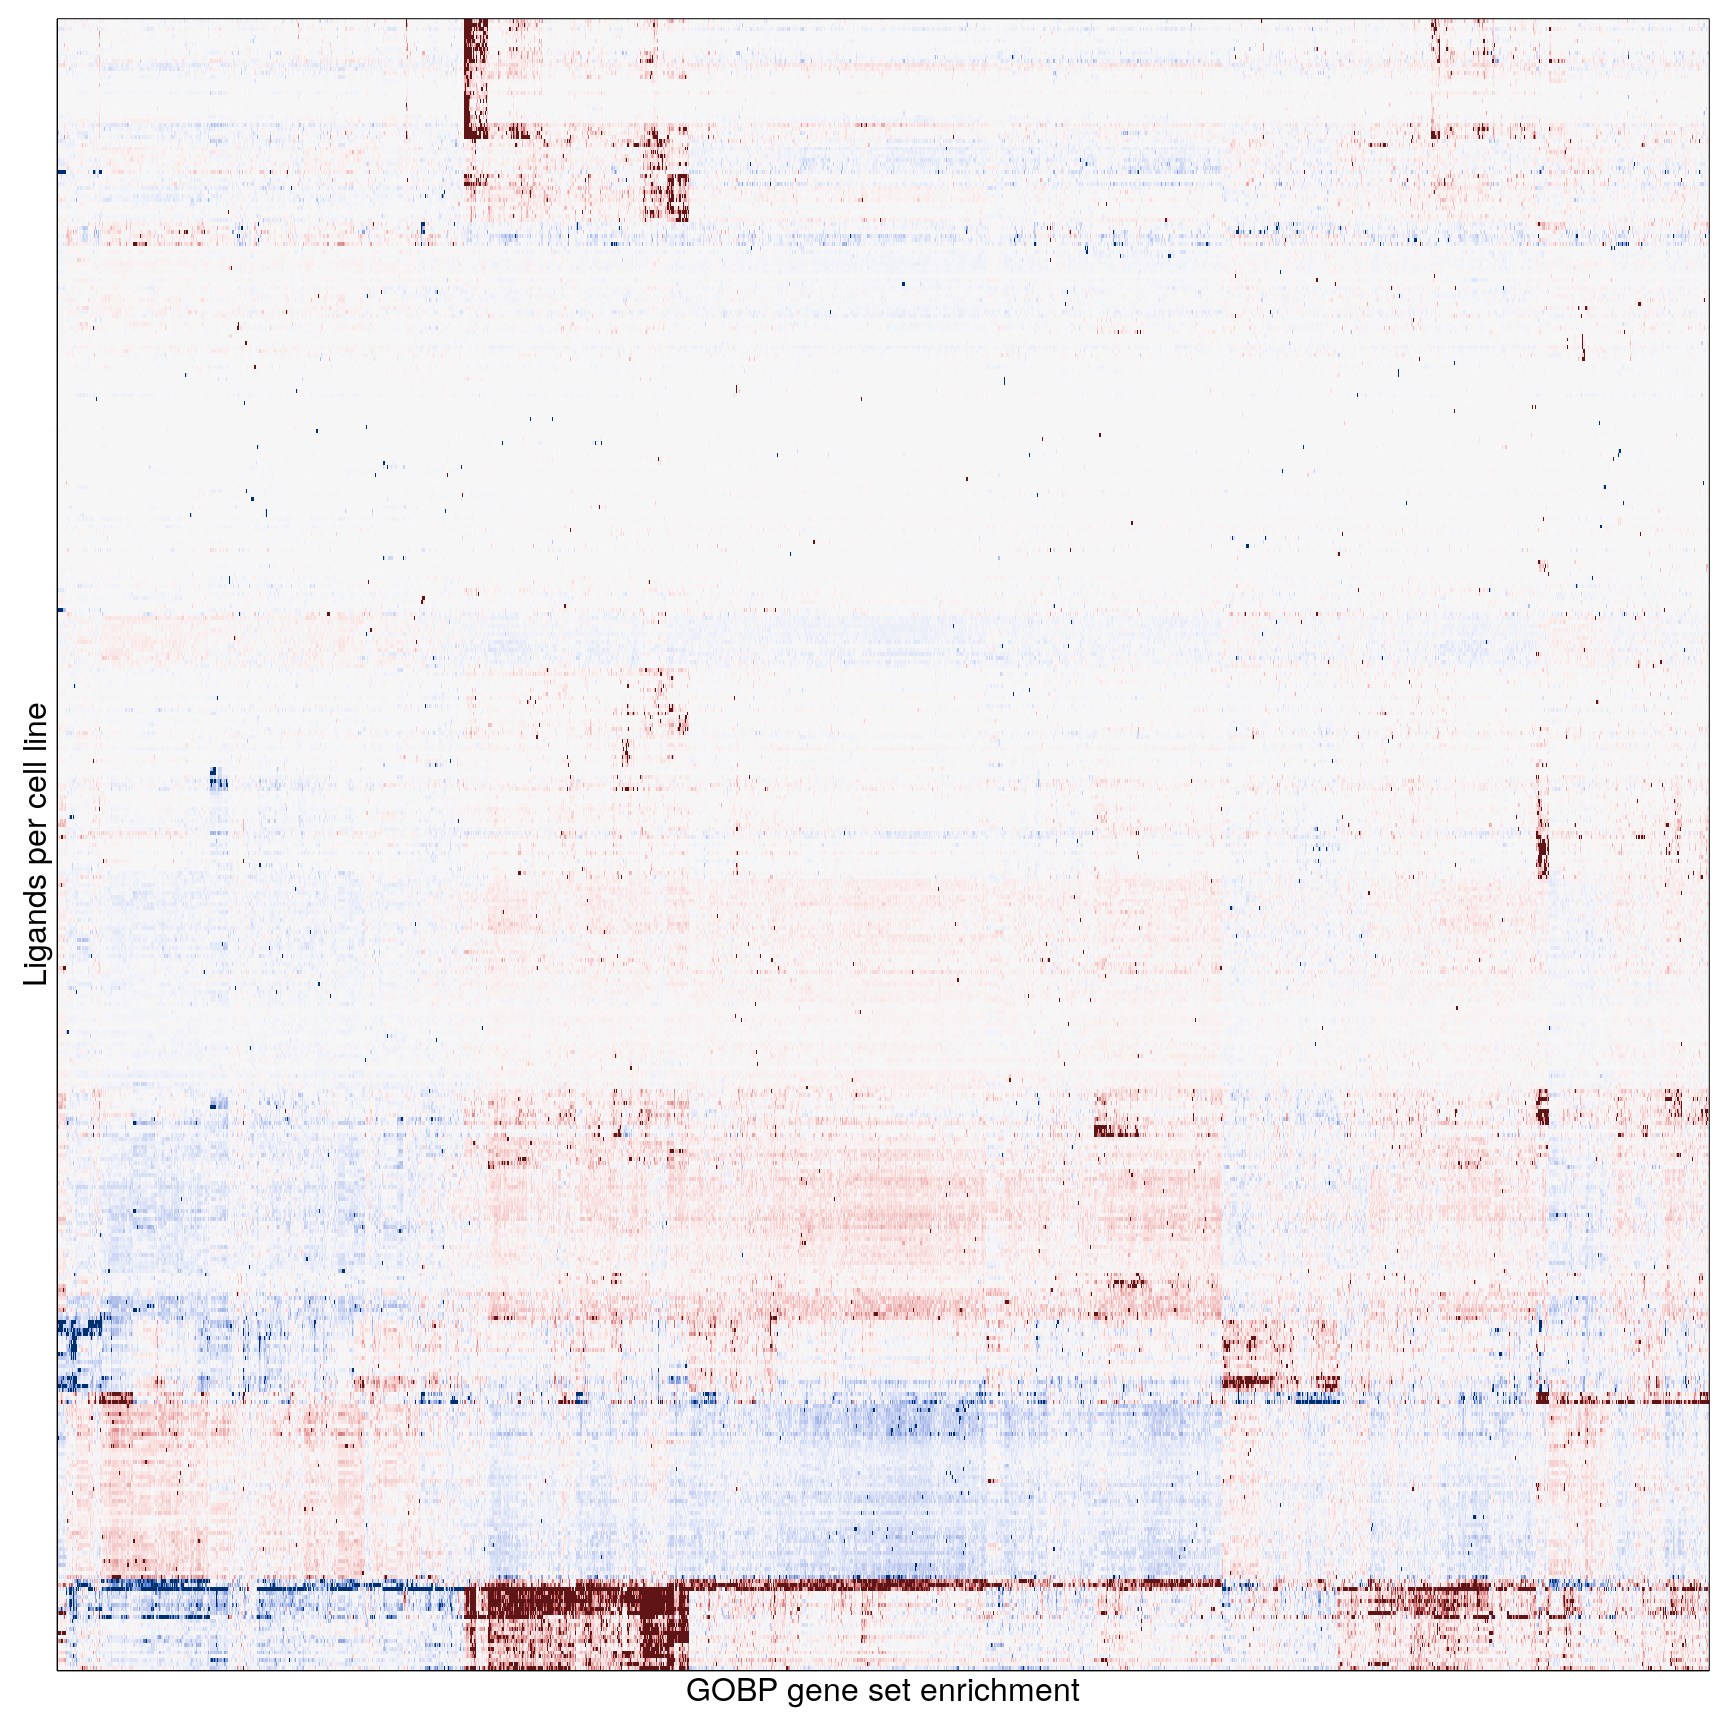
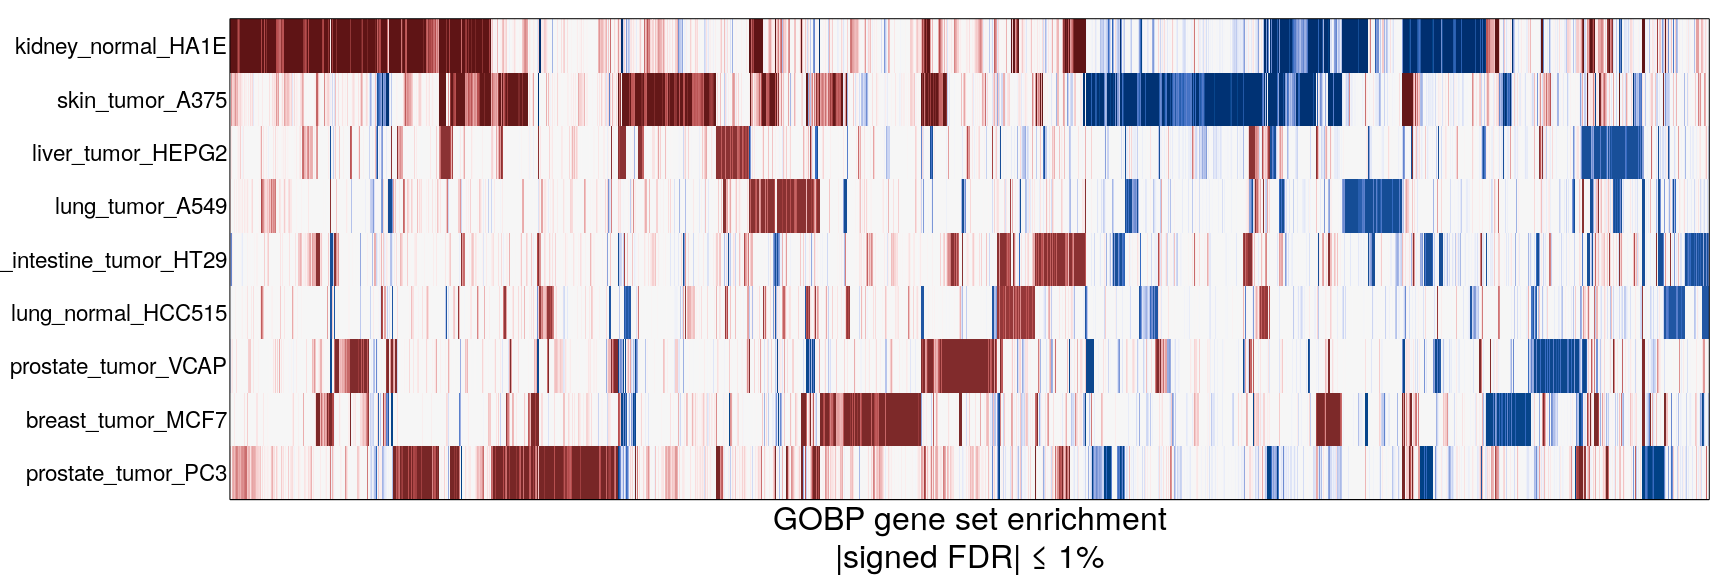
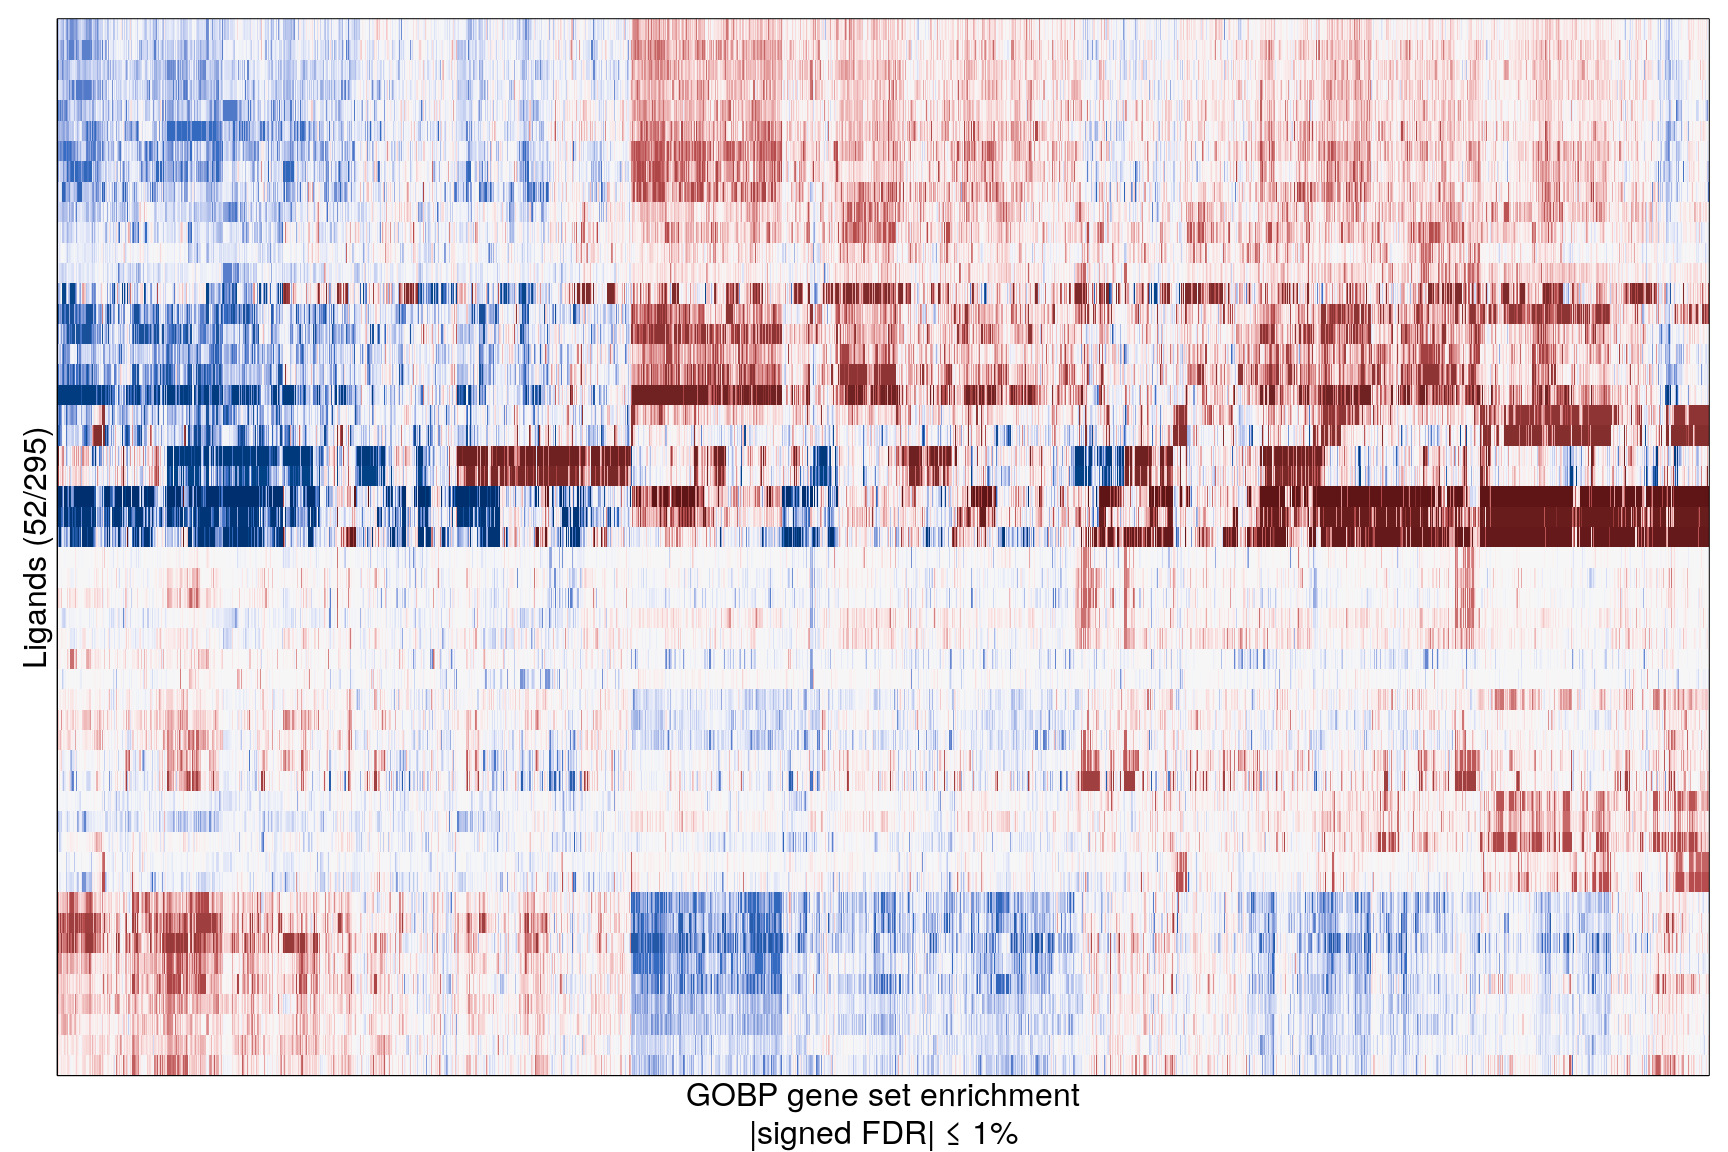
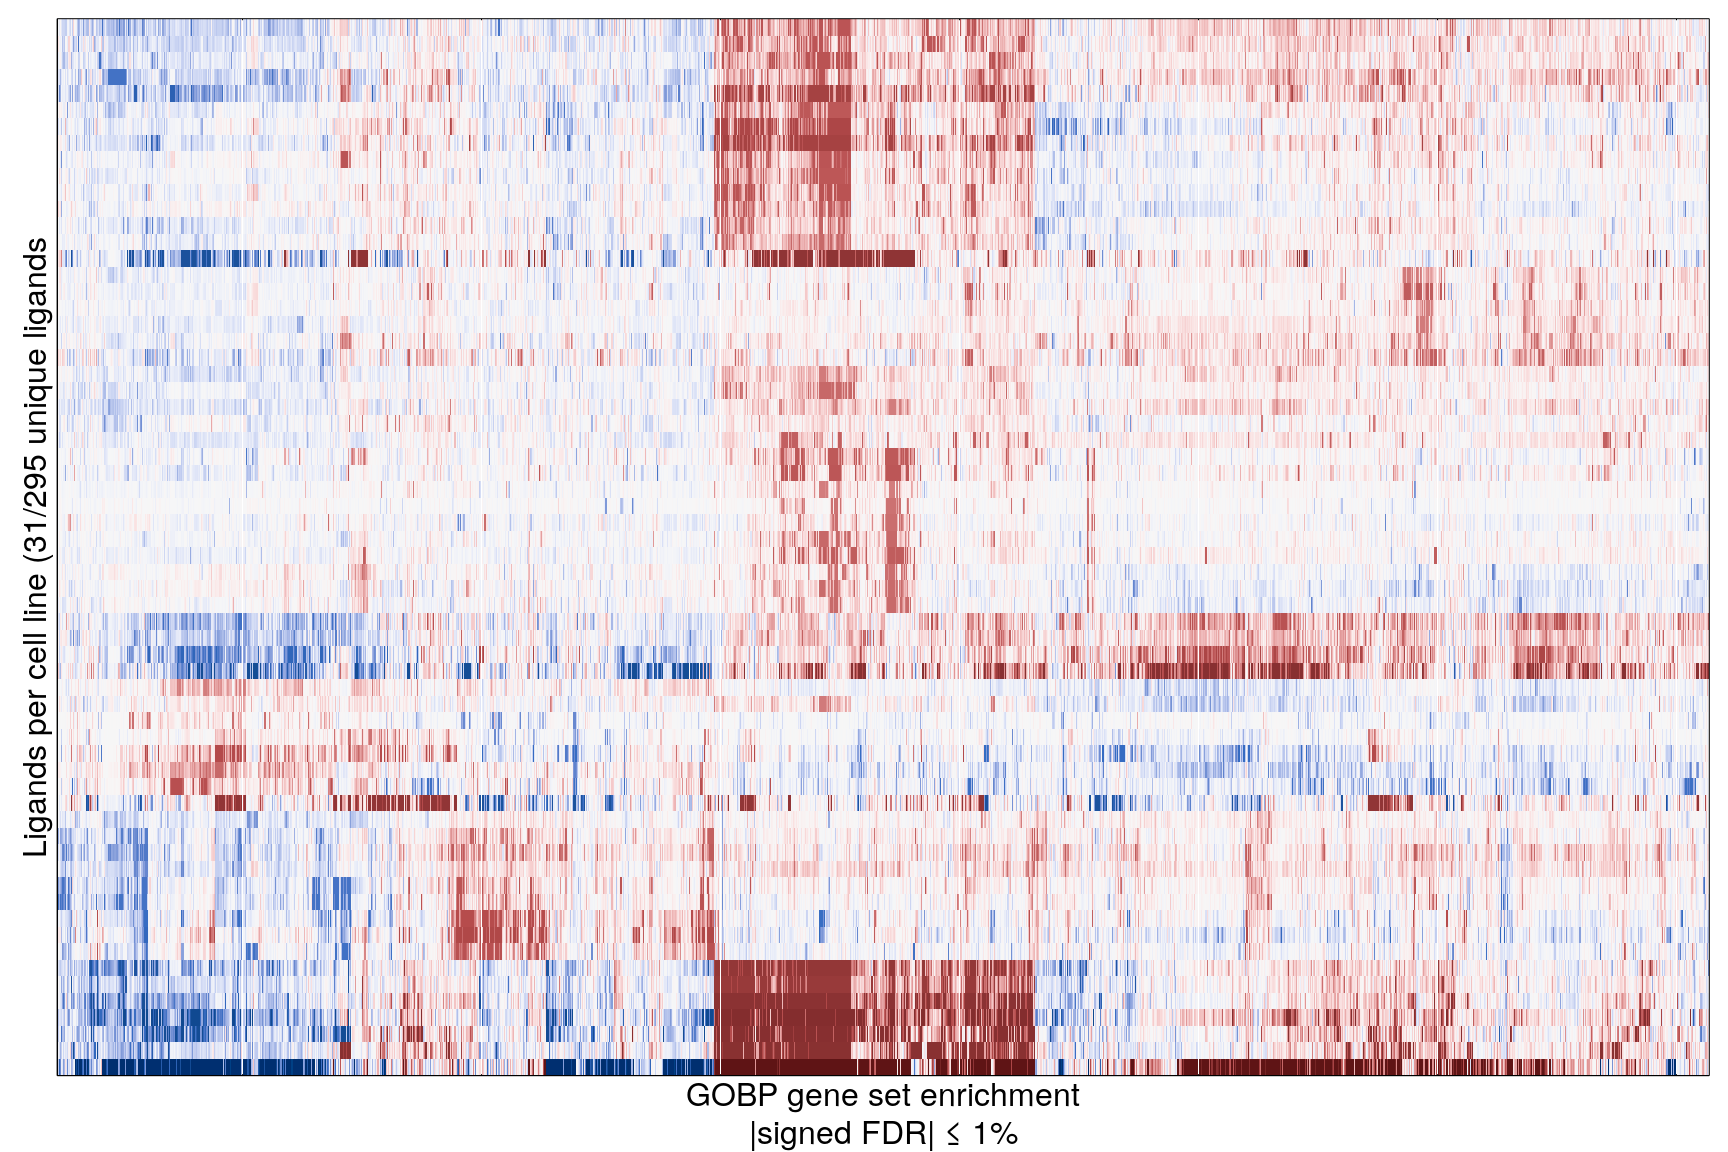
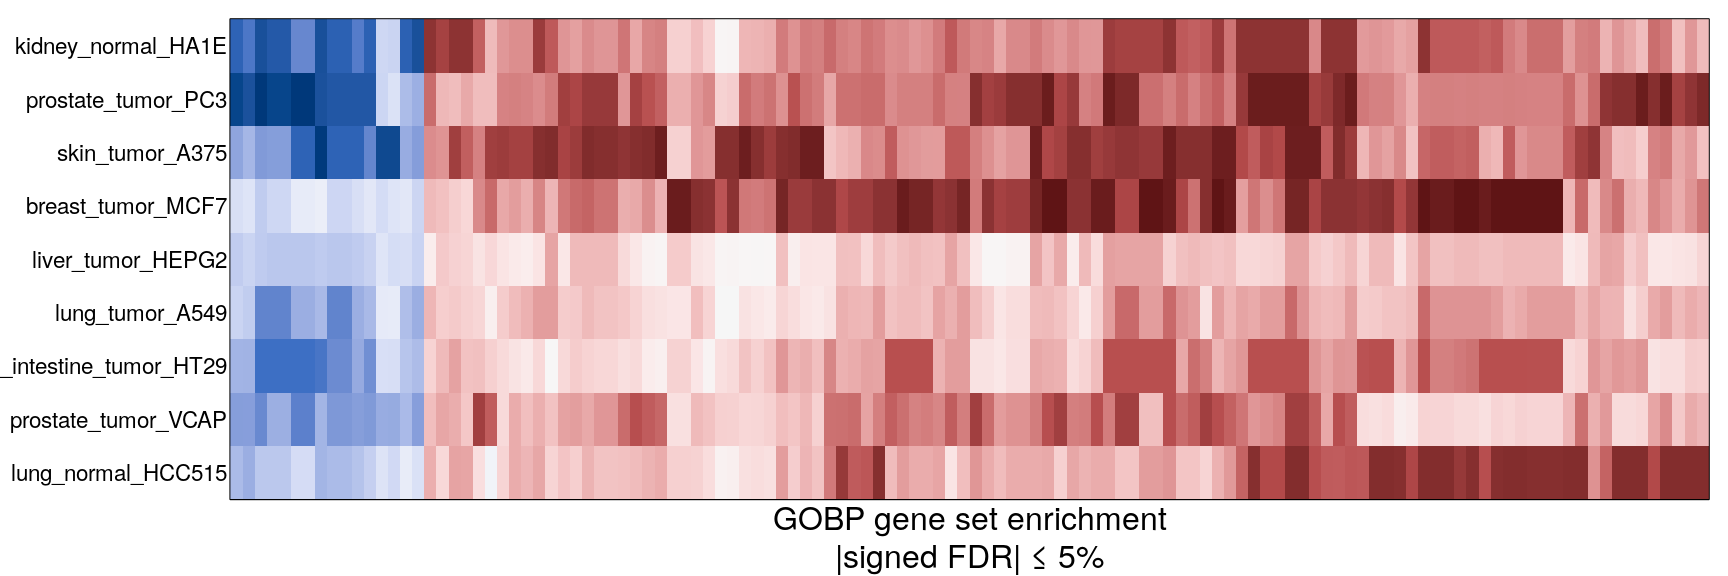
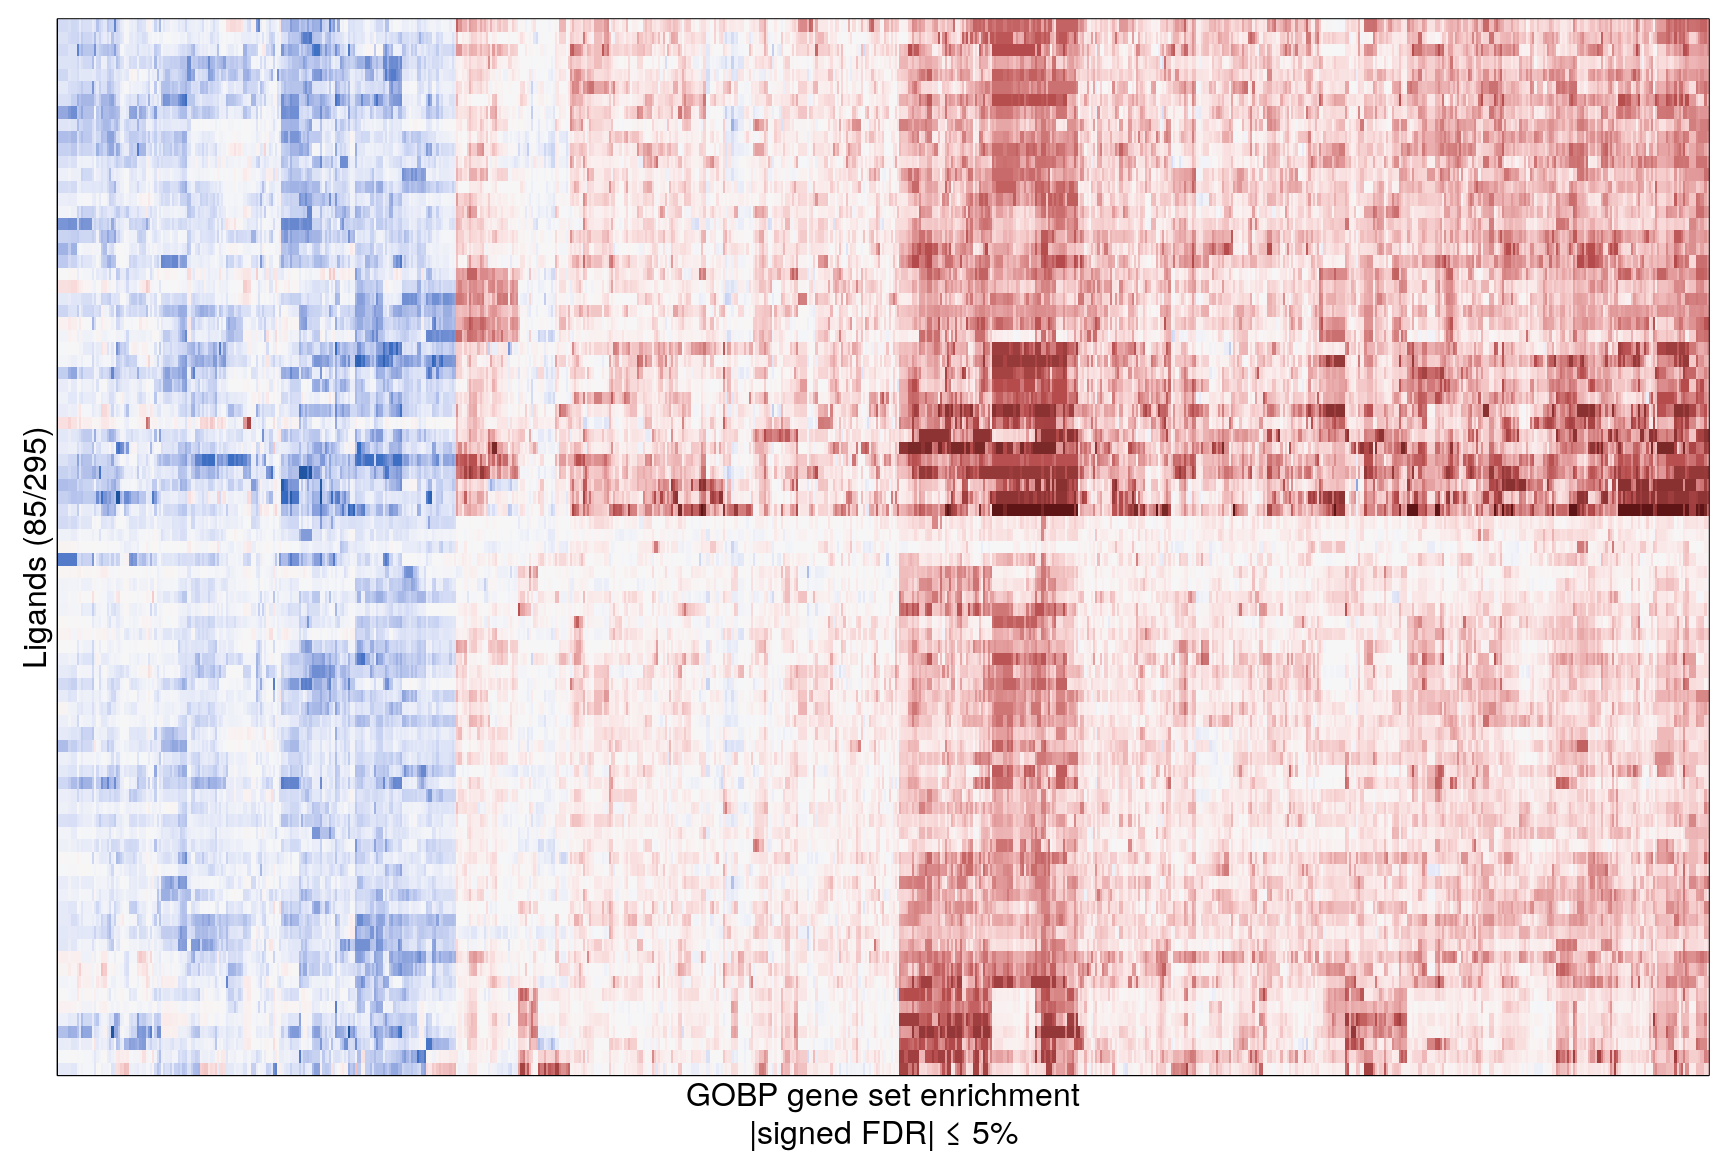
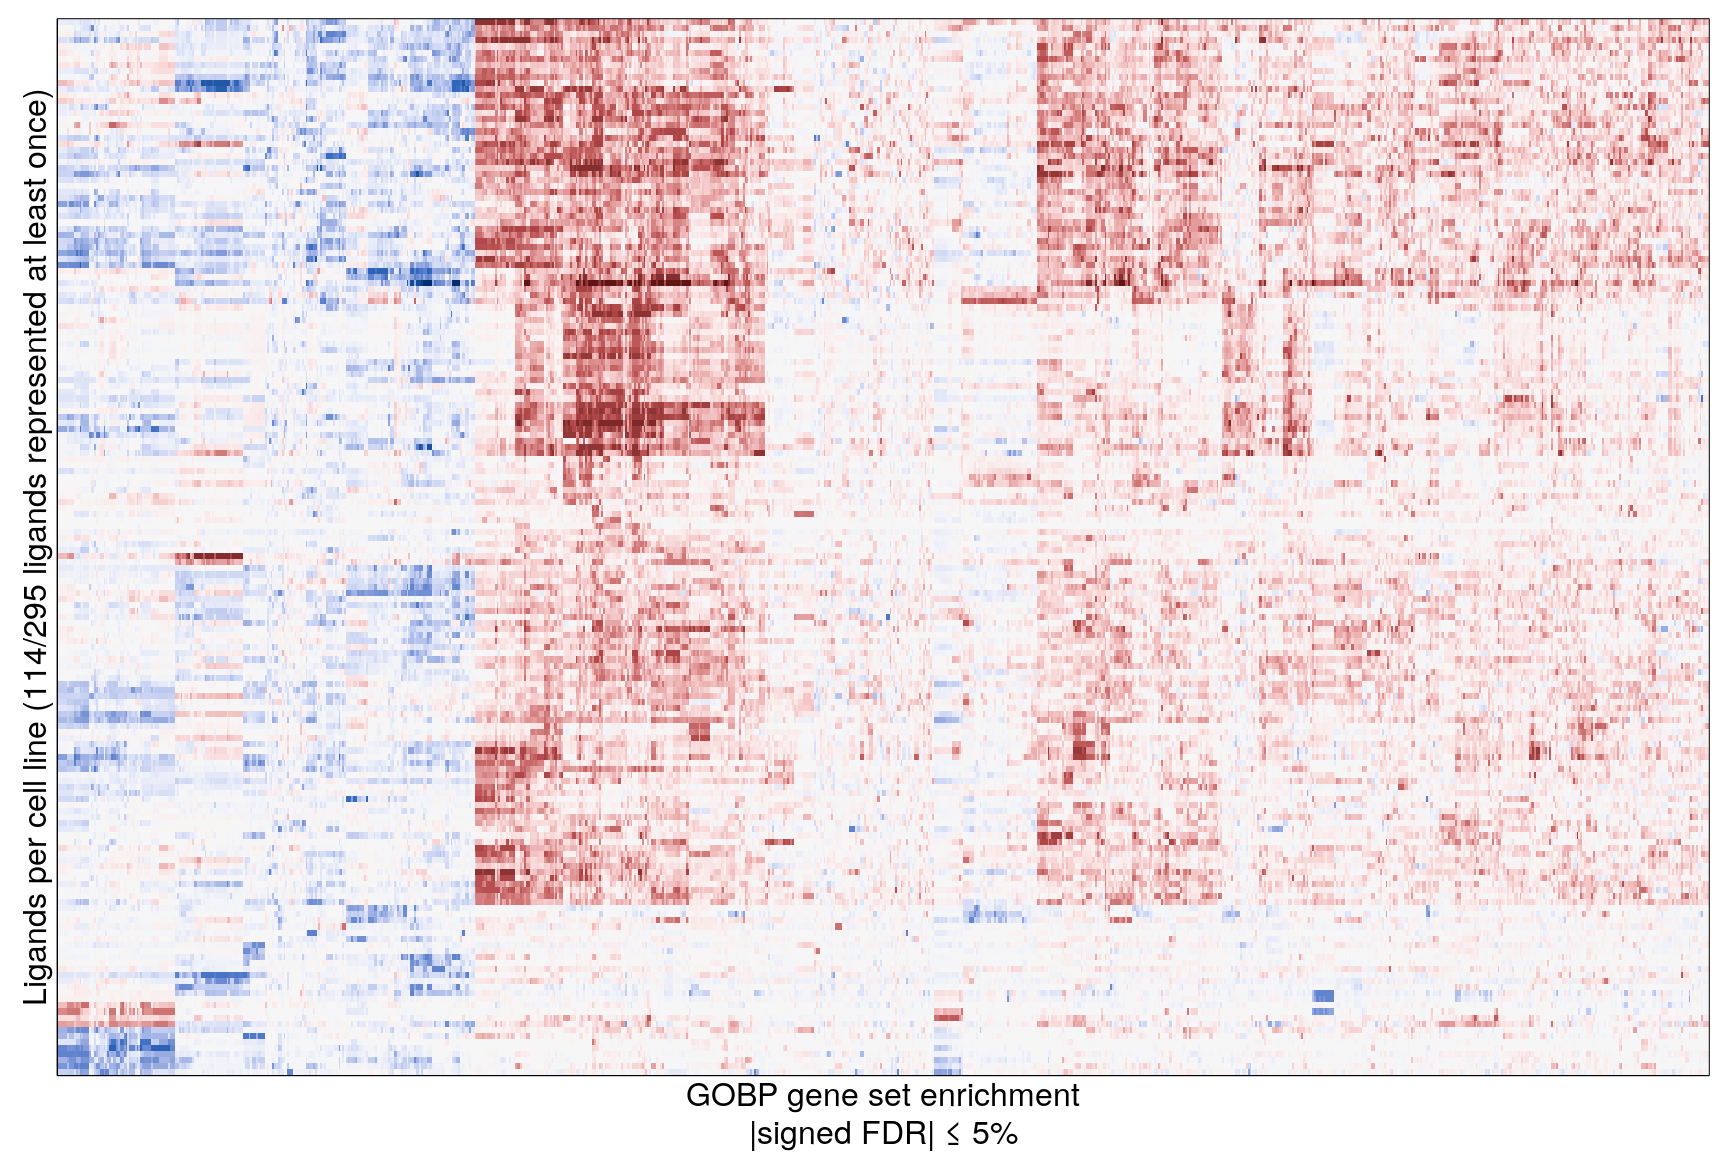
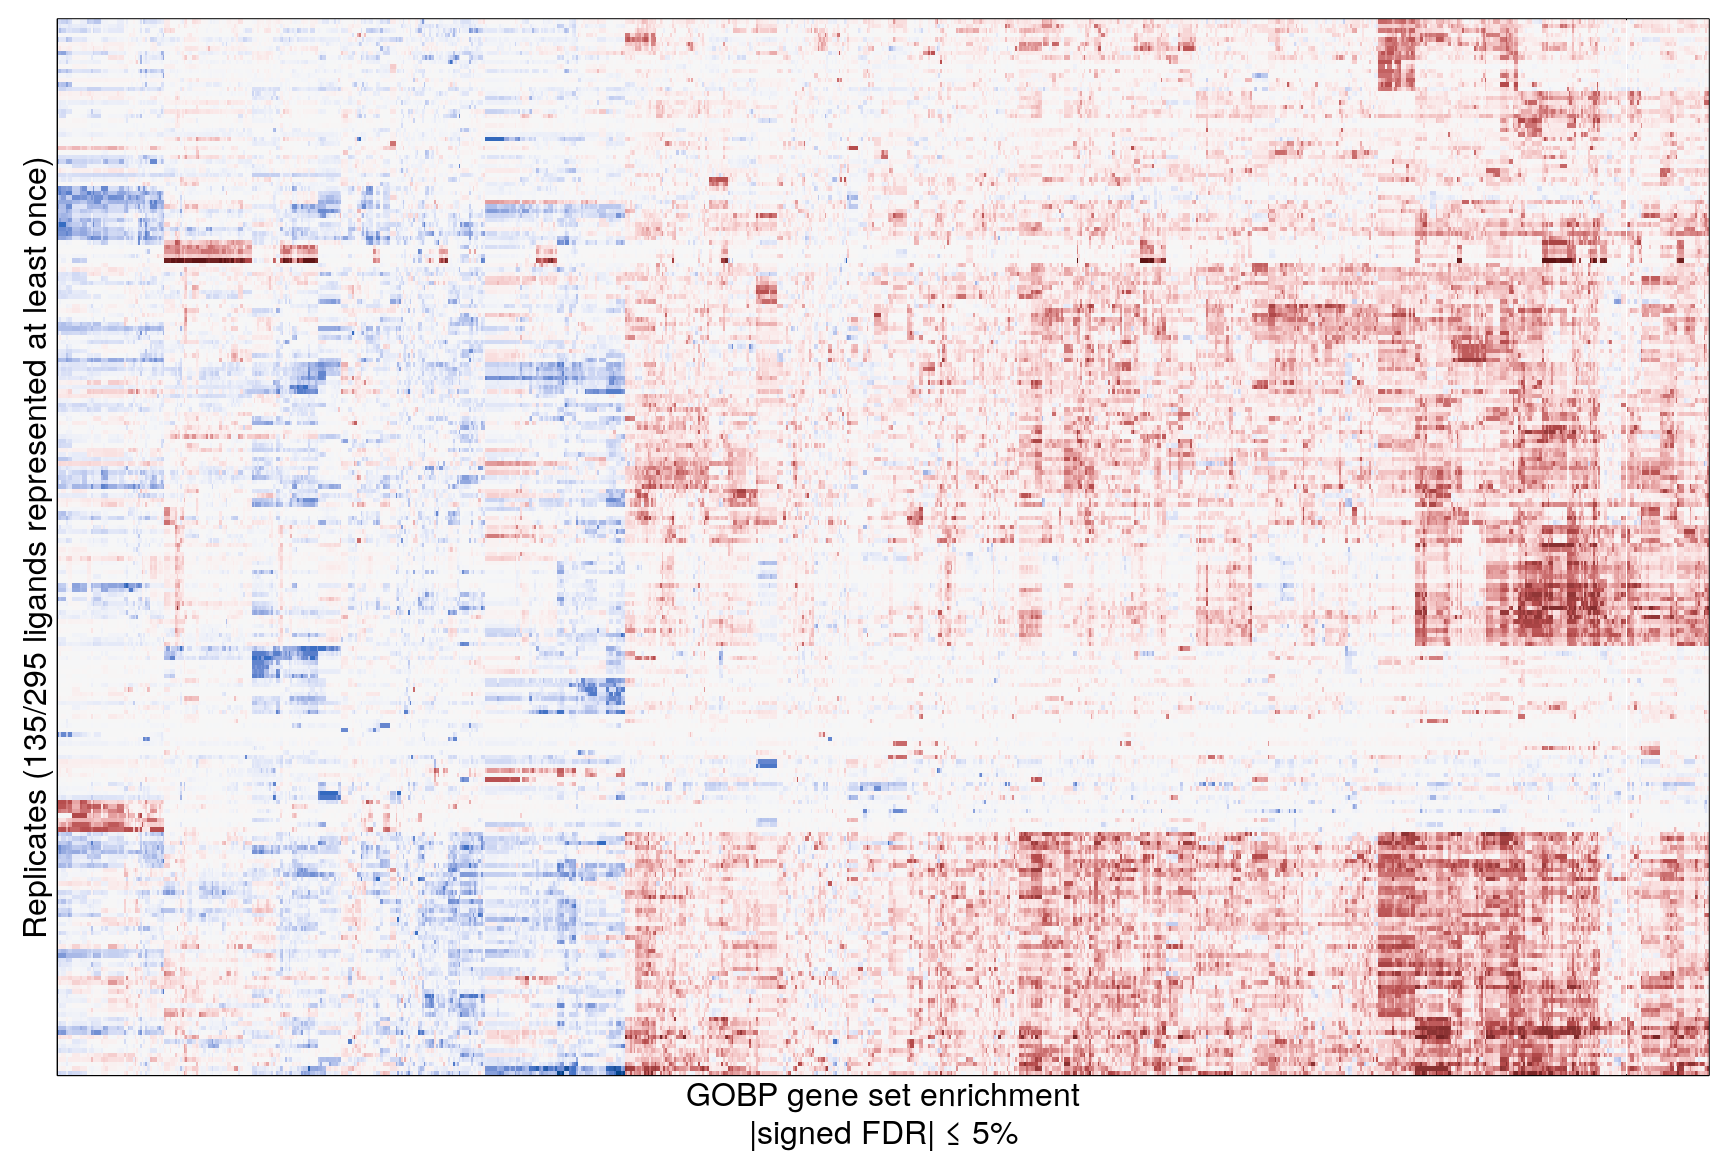
The following heatmaps are showing gene set enrichment per sample group (cell lines, ligands, or ligands per cell line). Values are signed FDR-corrected p-values representing the likelihood of seeing as extreme a value by chance when averaging signed GSEA FDR values across the sample group.
Cell line
Ligand
Ligand per cell line
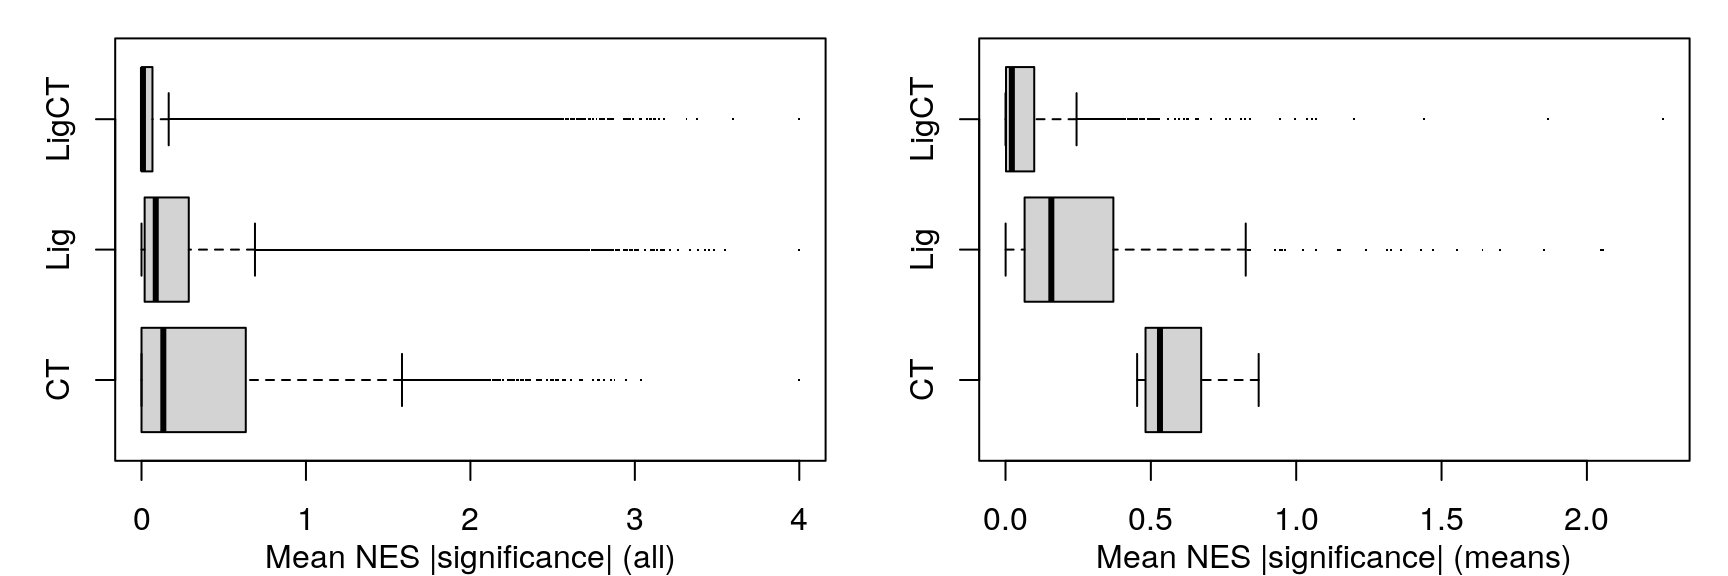
Compare
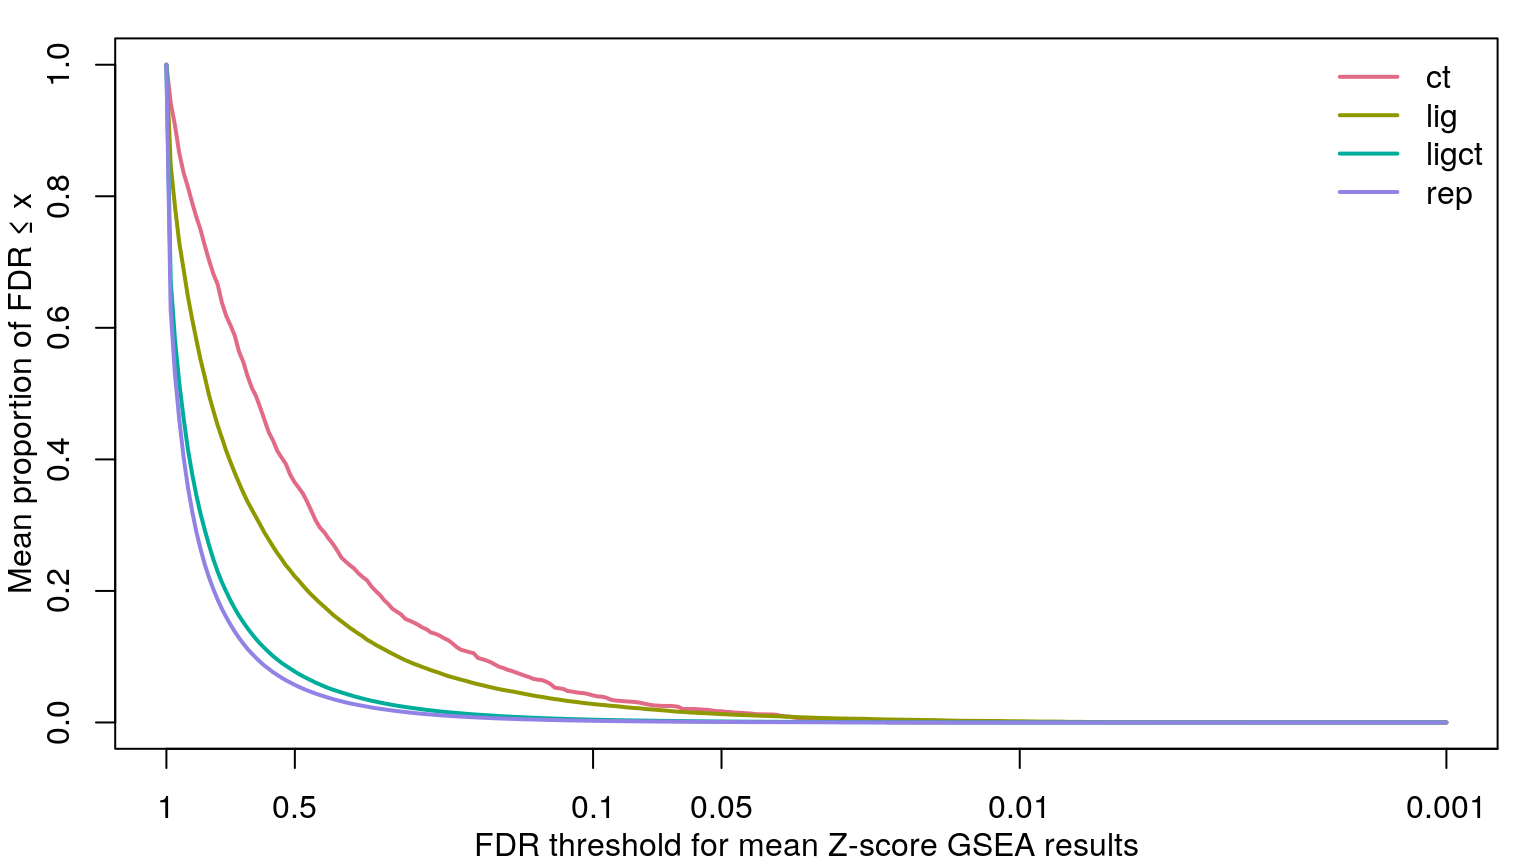
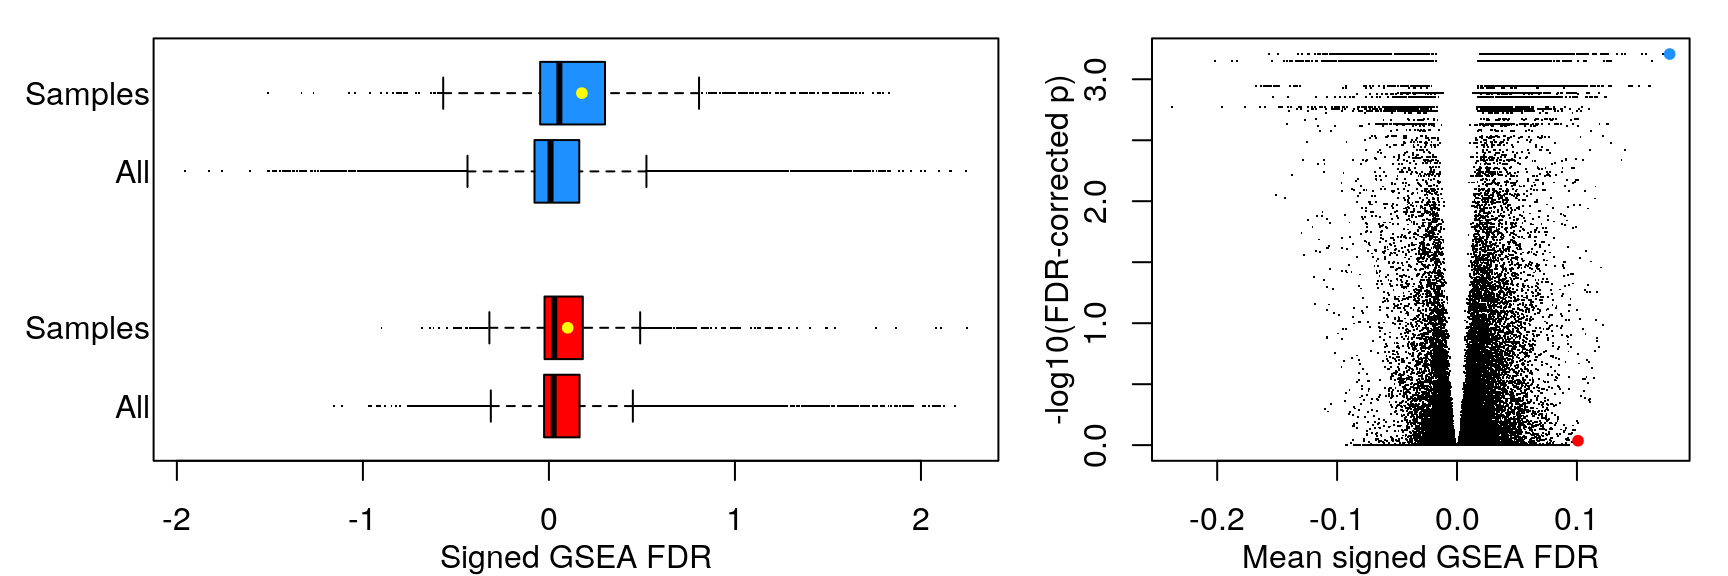
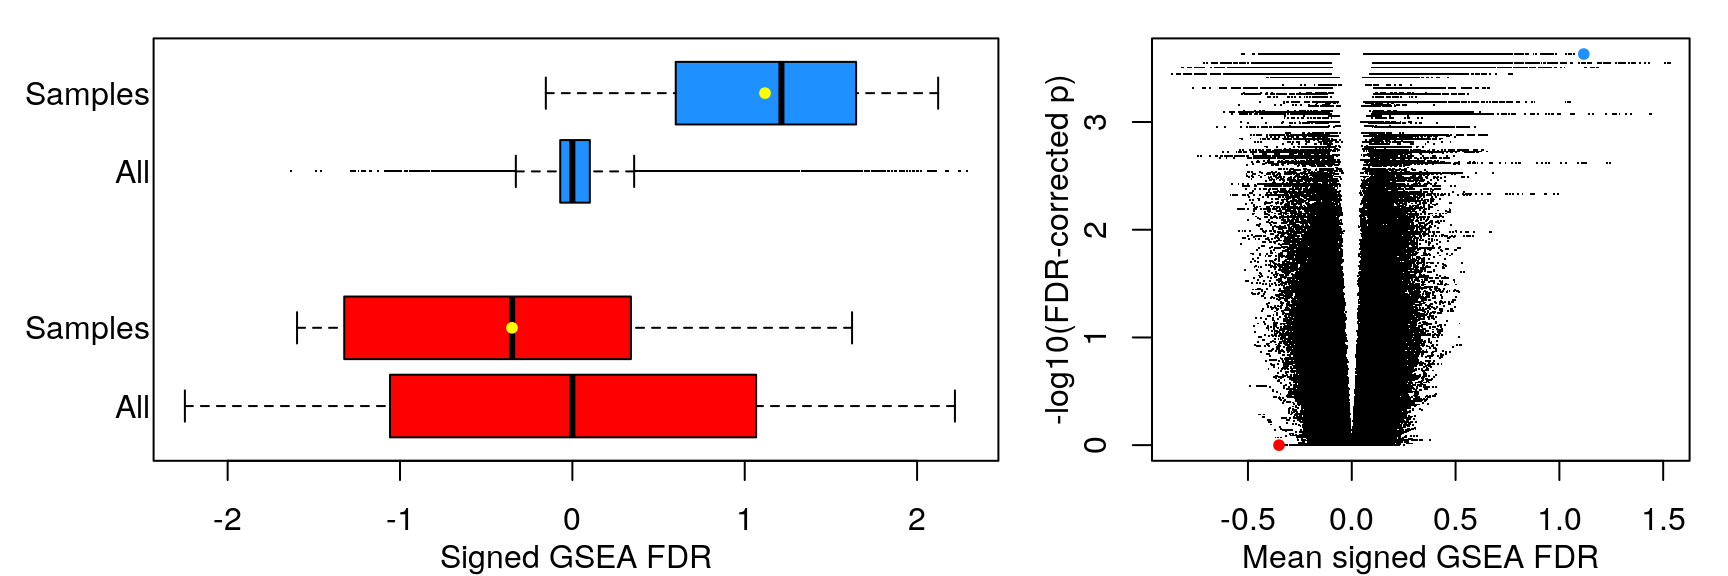
Rather than comparing number of significant gene sets at a handful of FDR thresholds, we’re using the KS-test to compare empirical cumulative distribution functions. On the left are the ECDFs for the FDR-corrected p-values testing the null hypothesis that the signed “significance score” for each gene set averaged over the sample set (cell line, ligand, or ligand per cell line) could occur by chance, given the signed significance scores for each sample (tested by permuting sample labels). On the right are ECDFs for the signed “significance score” for each gene set averaged over the sample set.
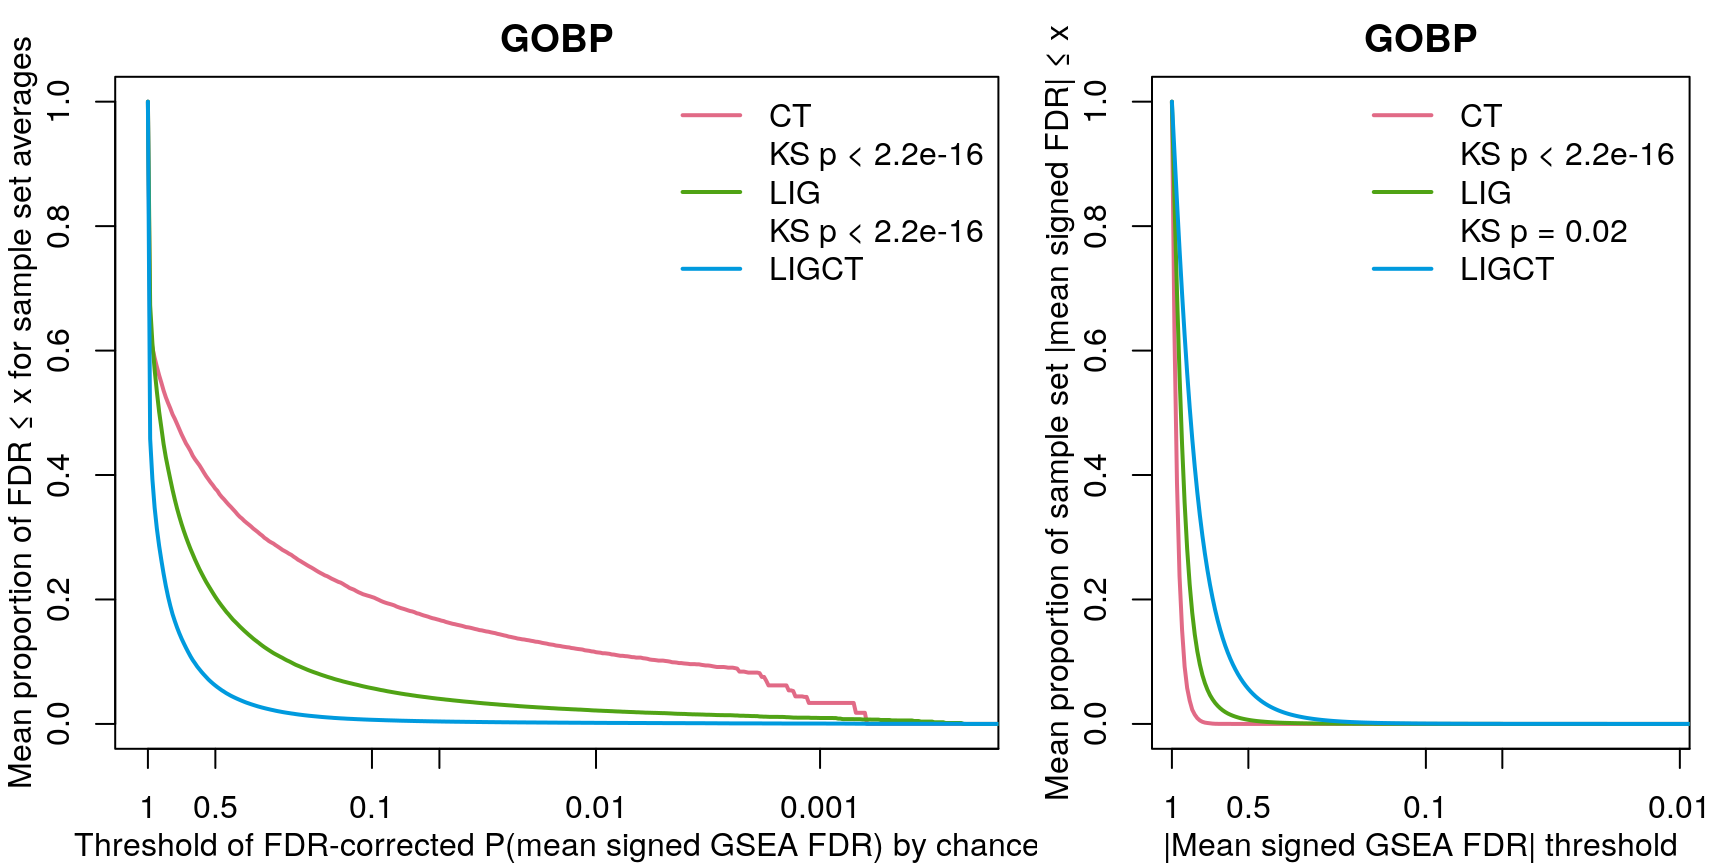
As one might expect, averaging across fewer samples yields higher magnitude values.
MeanZ GSEA
Cell line
Ligand
Ligand per cell line
Replicate
Compare