Identifying stimulated cells
Here we are training random forest models to distinguish between cells treated with a ligand and their respective controls. This should be a pretty easy task, but later we’ll see if the models can generalize to cell types they haven’t seen.
Training on all cell types
This is more of a positive control - can we train a random forest model to differentiate between treatment and control for each ligand perturbation, irrespective of cell type? As long as the perturbation causes some transcriptional deviation from each cell type’s untreated transcriptome, we’d expect this to work.
Random forest model source code
| acc_unb | pre_unb | rec_unb | acc_wt | pre_wt | rec_wt | acc_bal | pre_bal | rec_bal | |
|---|---|---|---|---|---|---|---|---|---|
| EGF | 0.980 | 0.718 | 0.607 | 0.980 | 0.718 | 0.617 | 0.979 | 0.615 | 0.925 |
| HGF | 0.983 | 0.673 | 0.139 | 0.983 | 0.765 | 0.165 | 0.950 | 0.268 | 0.958 |
| INS | 0.984 | 0.602 | 0.227 | 0.984 | 0.570 | 0.223 | 0.975 | 0.404 | 0.914 |
| IGF2 | 0.985 | 0.844 | 0.173 | 0.985 | 0.851 | 0.182 | 0.959 | 0.294 | 0.941 |
| TGFA | 0.988 | 0.813 | 0.397 | 0.988 | 0.824 | 0.406 | 0.970 | 0.359 | 0.913 |
| IGF1 | 0.985 | 0.769 | 0.183 | 0.985 | 0.789 | 0.205 | 0.970 | 0.358 | 0.909 |
| FGF1 | 0.985 | 0.772 | 0.201 | 0.985 | 0.818 | 0.205 | 0.967 | 0.338 | 0.922 |
| HBEGF | 0.985 | 0.759 | 0.201 | 0.985 | 0.754 | 0.196 | 0.971 | 0.369 | 0.909 |
| IL6 | 0.985 | 0.651 | 0.249 | 0.985 | 0.659 | 0.258 | 0.968 | 0.341 | 0.926 |
| IL4 | 0.986 | 0.707 | 0.300 | 0.986 | 0.736 | 0.295 | 0.973 | 0.383 | 0.889 |
| IFNG | 0.992 | 1.000 | 0.528 | 0.991 | 1.000 | 0.500 | 0.976 | 0.414 | 0.926 |
| BTC | 0.987 | 0.891 | 0.265 | 0.987 | 0.892 | 0.270 | 0.975 | 0.402 | 0.898 |
| GDNF | 0.985 | 0.632 | 0.257 | 0.985 | 0.630 | 0.271 | 0.976 | 0.405 | 0.897 |
| GAS6 | 0.982 | 0.411 | 0.108 | 0.982 | 0.415 | 0.103 | 0.970 | 0.349 | 0.892 |
| TNF | 0.993 | 0.992 | 0.597 | 0.993 | 0.992 | 0.607 | 0.978 | 0.423 | 0.929 |
| IL17A | 0.987 | 0.814 | 0.273 | 0.987 | 0.780 | 0.306 | 0.978 | 0.429 | 0.919 |
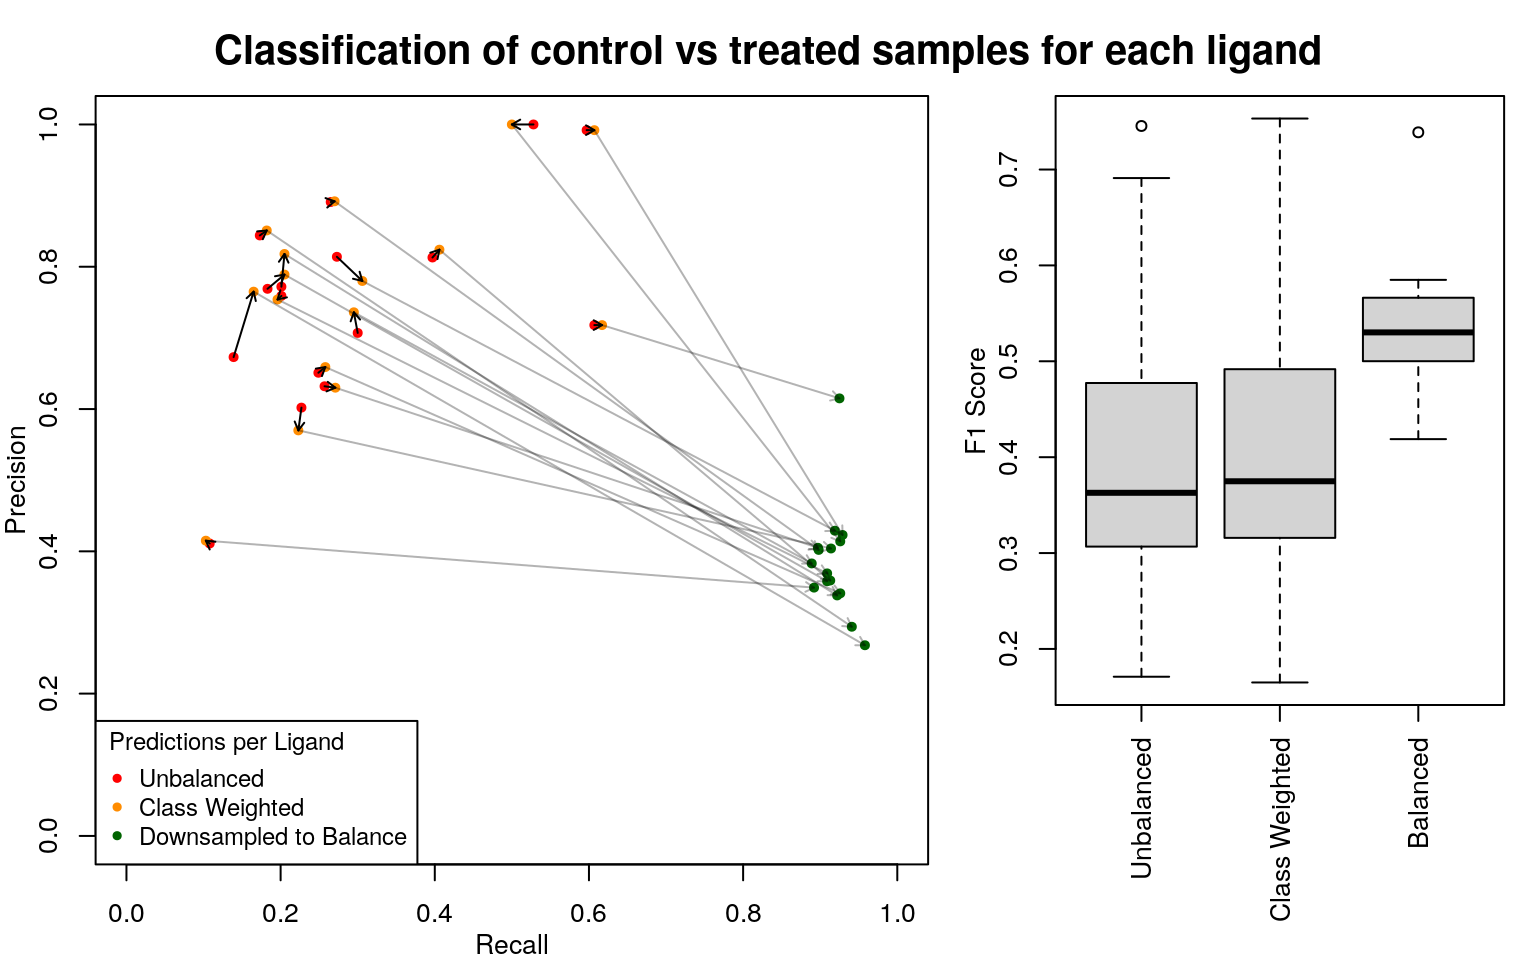
Using each of the 15 ligands tested in all cells as a test case, we trained a random forest classifier to classify treated vs untreated cells. The data for each ligand consisted of all treated and control samples from all cell types in which that ligand was tested, split at random into equally-sized training and test sets. The data was very unbalanced, with many more controls than ligand-treated samples. Upweighting the minor class didn’t seem to make a difference, so randomly downsampling of control samples in the training data was used to make the data balanced. Testing input was not balanced.
So this works pretty well, as expected.
Generalizing to novel cell types
Now we’ll start to get into the real question. We’re still just asking the model to differentiate between treatment and control (for each ligand individually), but now we’re holding out single cell type and training on the others, then testing the model’s ability to differentiate between treatment and control based on the transcriptome of a cell type it hasn’t seen. Since it doesn’t know what the unperturbed transcriptome is supposed to look like, it will probably have to learn what the ligand-treated transcriptome looks like in the other cell types, and extrapolate to the novel cell type’s ligand-treated transcriptome. If there are consistent transcriptional responses to ligand exposure, this should work, otherwise it seems unlikely to perform well.
Random forest model source code
| PC3 | MCF7 | A375 | A549 | HA1E | HCC515 | HEPG2 | HT29 | VCAP | BT20 | HS578T | MCF10A | MDAMB231 | SKBR3 | |
|---|---|---|---|---|---|---|---|---|---|---|---|---|---|---|
| EGF | 0.0701754 | 0.2164948 | 0.2500000 | 0.6250000 | 0.3636364 | 0.3478261 | 0.8000000 | 0.4444444 | 0.2857143 | 0.7628866 | 0.7033898 | 0.5933014 | 0.7692308 | 0.7450980 |
| HGF | 0.1538462 | 0.3725490 | 0.2325581 | 0.4705882 | 0.5882353 | 0.3703704 | 0.5833333 | 0.5454545 | 0.1333333 | 0.5285714 | 0.5774648 | 0.5906040 | 0.6304348 | 0.6153846 |
| INS | 0.1153846 | 0.5112108 | 0.2222222 | 0.5000000 | 0.4285714 | 0.2857143 | 0.6666667 | 0.5714286 | 0.1142857 | 0.5697674 | 0.2784810 | 0.3181818 | 0.6451613 | 0.6619718 |
| IGF2 | 0.0555556 | 0.5630252 | 0.3636364 | 0.4000000 | 0.5000000 | 0.4444444 | 0.6666667 | 0.5714286 | NaN | 0.5822785 | 0.3269231 | 0.4040404 | 0.6285714 | 0.5540541 |
| TGFA | 0.0869565 | 0.4259259 | 0.0769231 | 0.6000000 | 0.5714286 | 0.4000000 | 0.8000000 | 0.5000000 | 0.2857143 | 0.7453416 | 0.6666667 | 0.6808511 | 0.6250000 | 0.6867470 |
| IGF1 | 0.0571429 | 0.4615385 | 0.3333333 | 0.6000000 | 0.1538462 | 0.5000000 | 0.5000000 | 0.4000000 | NaN | 0.5970149 | 0.5522388 | 0.4230769 | 0.5673759 | 0.5955056 |
| FGF1 | 0.1219512 | 0.4470588 | 0.1250000 | 0.4761905 | 0.3636364 | 0.6666667 | 0.3750000 | 0.6000000 | NaN | 0.5747126 | 0.6194690 | 0.4444444 | 0.6250000 | 0.5987261 |
| HBEGF | 0.1000000 | 0.3826087 | 0.1025641 | 0.5333333 | 0.4705882 | 0.4705882 | 0.6666667 | 0.5000000 | NaN | 0.6363636 | 0.6240000 | 0.6178862 | 0.6250000 | 0.5897436 |
| IL6 | 0.3333333 | 0.0481928 | 0.3529412 | 0.4761905 | 0.2666667 | 0.5454545 | 0.6000000 | NaN | NaN | 0.6300000 | 0.5289256 | 0.4859813 | 0.6551724 | 0.7044025 |
| IL4 | 0.0888889 | 0.3841060 | 0.1860465 | 0.7500000 | 0.2000000 | 0.3333333 | 0.5714286 | 0.4000000 | NaN | 0.5426357 | 0.5964912 | 0.4646465 | 0.6344086 | 0.5694444 |
| IFNG | 0.8888889 | 0.6906475 | 0.5714286 | 1.0000000 | 0.8333333 | 1.0000000 | 0.9230769 | 1.0000000 | 0.6250000 | 0.6636364 | 0.7920792 | 0.8296296 | 0.6860465 | 0.5301205 |
| BTC | 0.0879121 | 0.5205479 | 0.1500000 | 0.3846154 | 0.5714286 | 0.4210526 | 0.4210526 | 0.3333333 | 0.2500000 | 0.7022901 | 0.7096774 | 0.6400000 | 0.6170213 | 0.7044025 |
| GDNF | 0.1818182 | 0.4000000 | 0.5454545 | 0.2352941 | NaN | 0.4285714 | 0.3333333 | 0.4000000 | 0.1666667 | 0.1428571 | 0.3191489 | 0.5584416 | 0.5500000 | 0.2666667 |
| GAS6 | 0.1428571 | 0.5194805 | 0.1428571 | 0.2222222 | 0.4285714 | 0.4444444 | 0.6666667 | 0.3333333 | 0.2222222 | 0.5900000 | 0.5696970 | 0.4074074 | 0.6033520 | 0.5957447 |
| TNF | 0.8000000 | 0.8701299 | 0.8888889 | 0.9230769 | 0.9090909 | 0.6250000 | 0.9230769 | 0.8000000 | NaN | 0.8636364 | 0.8172043 | 0.7294118 | 0.7724138 | 0.9056604 |
| IL17A | 0.3000000 | 0.2680412 | 0.2857143 | 0.8000000 | 0.1818182 | 0.1333333 | NaN | NaN | 0.4000000 | 0.3030303 | 0.1666667 | 0.5045045 | 0.6551724 | 0.5309735 |
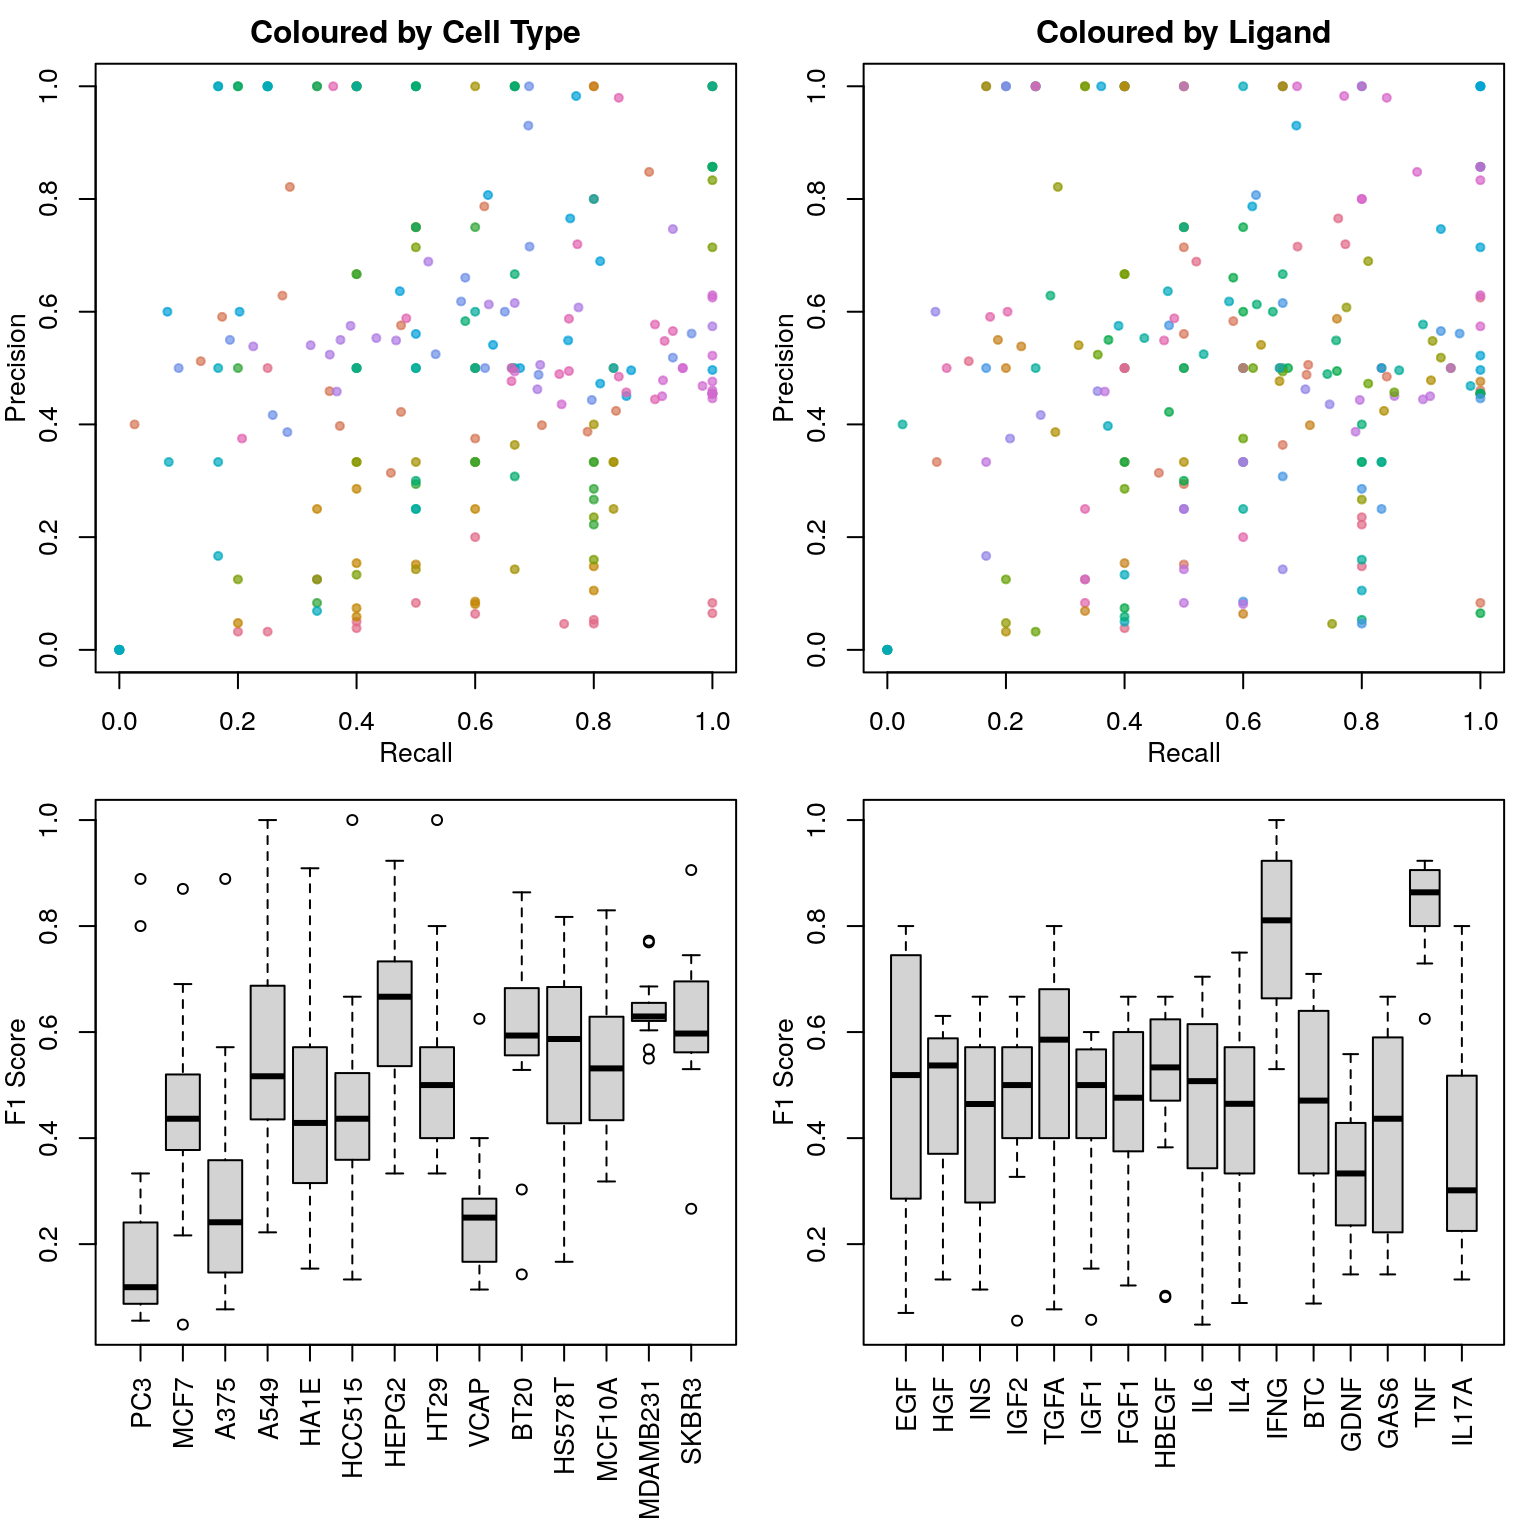
Note that only plate-matched data was used, in an attempt to reduce noise.