Connectivity Map ligand assay data summary
- Quantile-normalized transcriptomes from control and ligand-treated cell lines (level 3 data)
- Robust Z-scores of differences in cell line transcriptomes following ligand treatment (level 4 data)
- Replicate-collapsed robust Z-scores of differences in cell line transcriptomes following ligand treatment (level 5 data)
- Ligands / cell lines assayed
Quantile-normalized transcriptomes from control and ligand-treated cell lines (level 3 data)
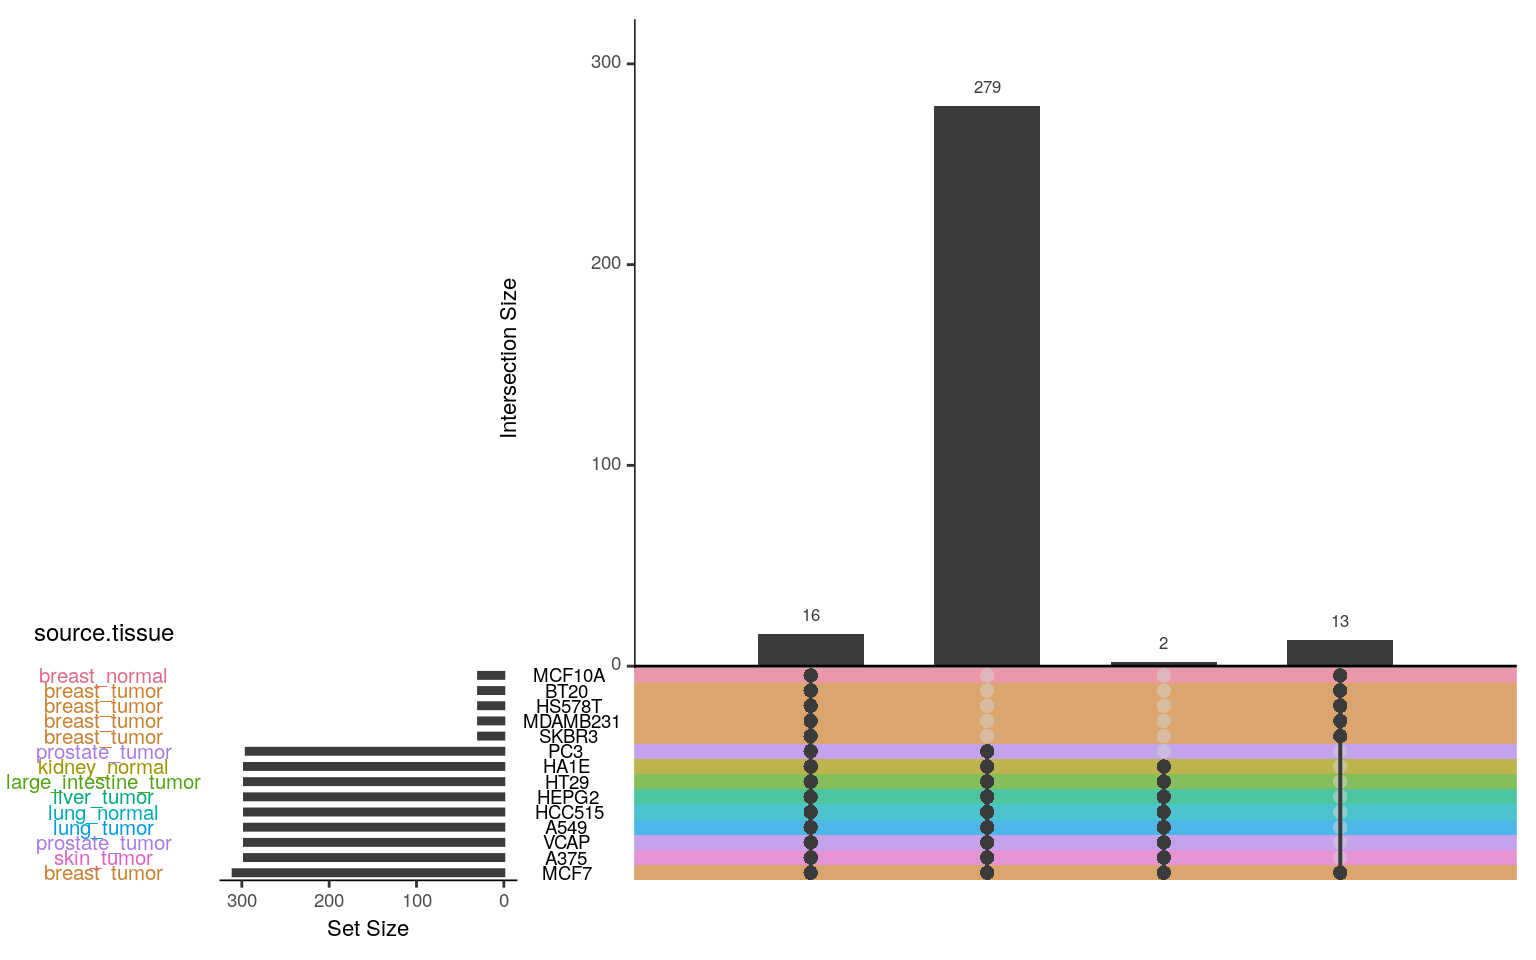
Ligands / cell lines assayed
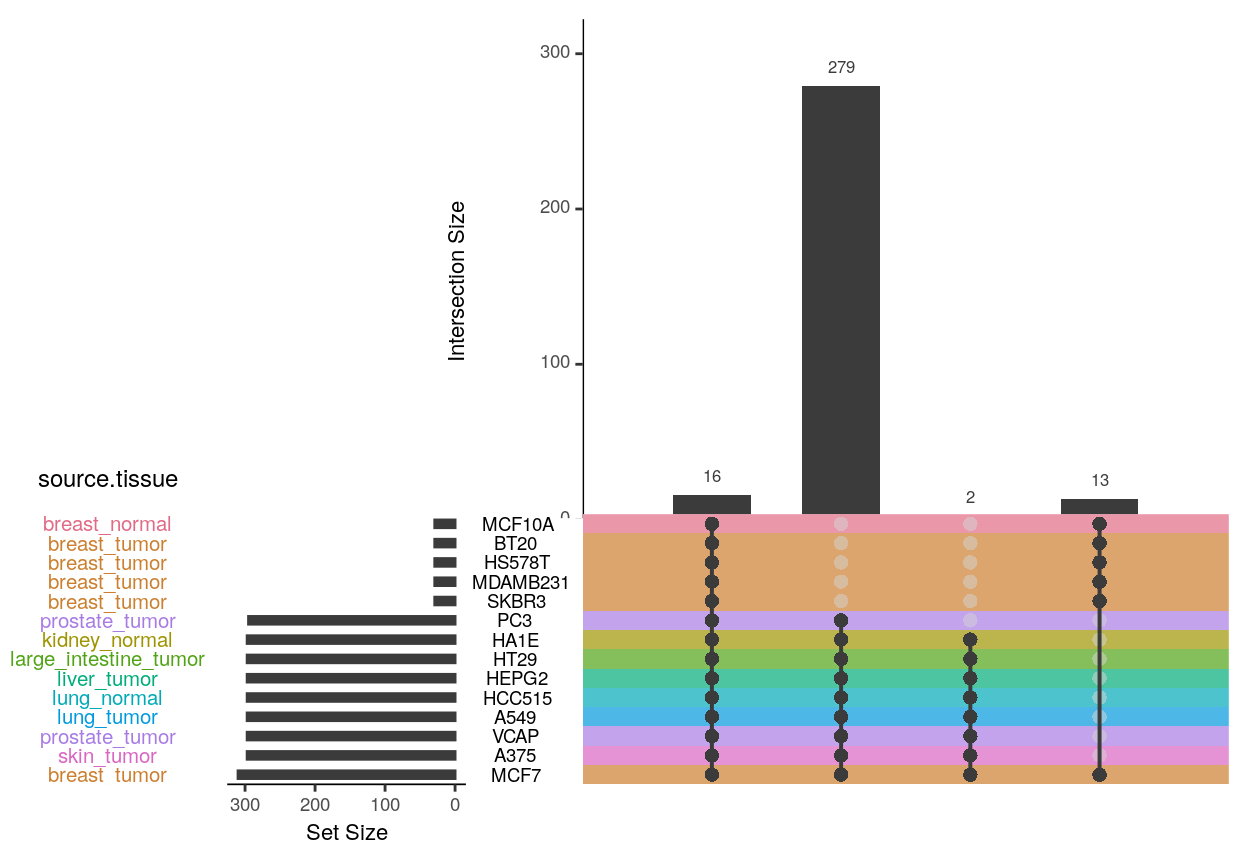
In the Connectivity Map data, there are 16 ligands assayed in all 14 cell lines, and 300 ligands assayed in 8 cell lines.
| EGF | HGF | INS | IGF2 | TGFA | IGF1 | FGF1 | HBEGF | IL6 | IL4 | IFNG | BTC | GDNF | GAS6 | TNF | IL17A | ctrl | min.ctrl.ratio | |
|---|---|---|---|---|---|---|---|---|---|---|---|---|---|---|---|---|---|---|
| breast_normal_MCF10A | 119 | 62 | 62 | 62 | 62 | 62 | 59 | 61 | 60 | 59 | 60 | 60 | 61 | 60 | 62 | 60 | 196 | 0.6071429 |
| breast_tumor_BT20 | 146 | 74 | 74 | 73 | 74 | 74 | 74 | 74 | 73 | 74 | 73 | 74 | 74 | 69 | 74 | 74 | 273 | 0.5347985 |
| breast_tumor_HS578T | 120 | 58 | 59 | 60 | 60 | 60 | 60 | 60 | 60 | 59 | 58 | 57 | 58 | 59 | 55 | 60 | 232 | 0.5172414 |
| breast_tumor_MCF7 | 153 | 83 | 80 | 80 | 80 | 80 | 80 | 80 | 78 | 78 | 78 | 80 | 79 | 76 | 75 | 75 | 4389 | 0.0348599 |
| breast_tumor_MDAMB231 | 120 | 58 | 60 | 60 | 60 | 60 | 60 | 60 | 60 | 60 | 59 | 58 | 59 | 59 | 56 | 60 | 251 | 0.4780876 |
| breast_tumor_SKBR3 | 123 | 57 | 62 | 62 | 62 | 62 | 62 | 62 | 62 | 62 | 61 | 60 | 58 | 62 | 57 | 62 | 265 | 0.4641509 |
| kidney_normal_HA1E | 5 | 10 | 5 | 5 | 5 | 5 | 5 | 5 | 5 | 5 | 5 | 5 | 5 | 5 | 5 | 3 | 1135 | 0.0088106 |
| large_intestine_tumor_HT29 | 5 | 10 | 5 | 5 | 4 | 4 | 5 | 4 | 5 | 4 | 5 | 4 | 4 | 4 | 5 | 3 | 2059 | 0.0048567 |
| liver_tumor_HEPG2 | 6 | 12 | 6 | 6 | 6 | 6 | 6 | 6 | 6 | 6 | 6 | 6 | 5 | 6 | 6 | 3 | 780 | 0.0153846 |
| lung_normal_HCC515 | 5 | 10 | 5 | 5 | 5 | 5 | 5 | 5 | 5 | 5 | 5 | 5 | 5 | 5 | 5 | 3 | 957 | 0.0104493 |
| lung_tumor_A549 | 6 | 12 | 6 | 6 | 6 | 6 | 6 | 5 | 6 | 5 | 6 | 6 | 6 | 6 | 6 | 3 | 2847 | 0.0042150 |
| prostate_tumor_PC3 | 5 | 7 | 5 | 5 | 4 | 4 | 5 | 5 | 4 | 5 | 5 | 5 | 3 | 4 | 5 | 5 | 4060 | 0.0017241 |
| prostate_tumor_VCAP | 6 | 12 | 6 | 6 | 6 | 6 | 6 | 6 | 6 | 6 | 6 | 6 | 6 | 6 | 6 | 4 | 5071 | 0.0023664 |
| skin_tumor_A375 | 5 | 10 | 5 | 5 | 5 | 5 | 5 | 5 | 5 | 5 | 5 | 5 | 5 | 5 | 5 | 3 | 2264 | 0.0044170 |
| Totals | 824 | 475 | 440 | 440 | 439 | 439 | 438 | 438 | 435 | 433 | 432 | 431 | 428 | 426 | 422 | 418 | 24779 | 0.0332540 |
In a subset of cell lines, ligands were tested over a variety of doses and times (and EGF was especially rigorously assayed), while in most cell lines ligands were tested at a single concentration over two time points. Note that the number of control samples per cell type is much greater than the number of treatments.
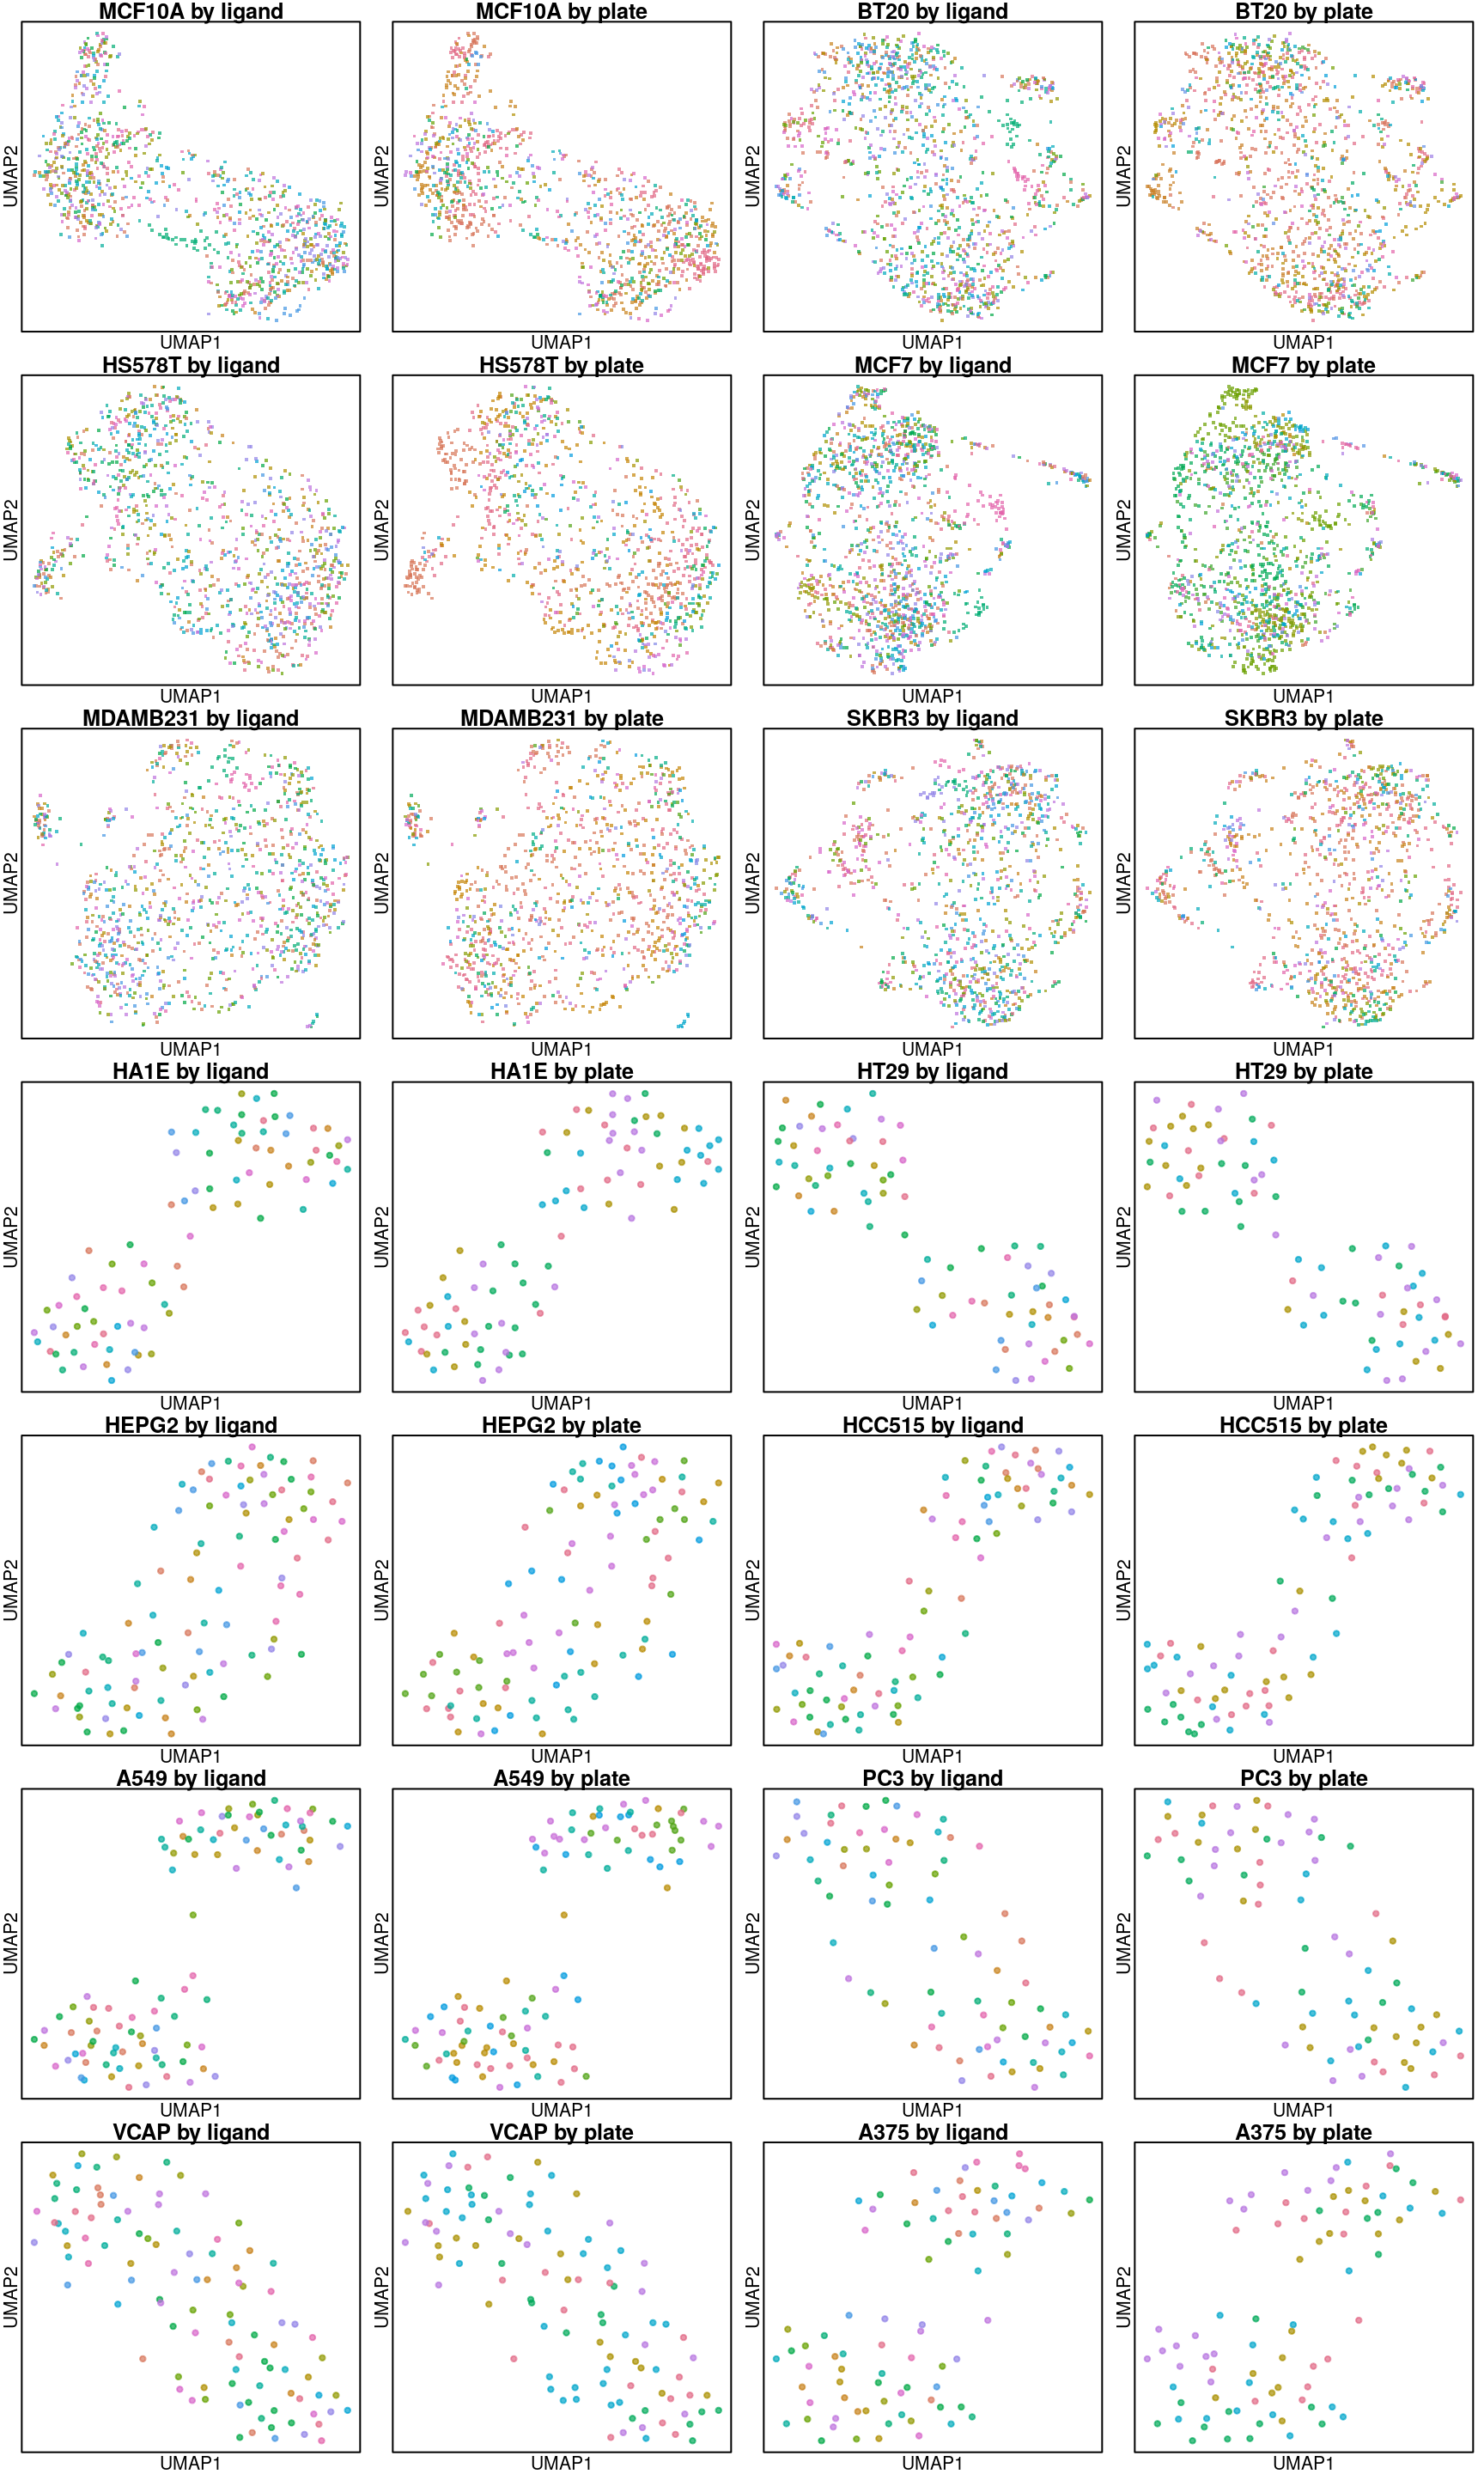
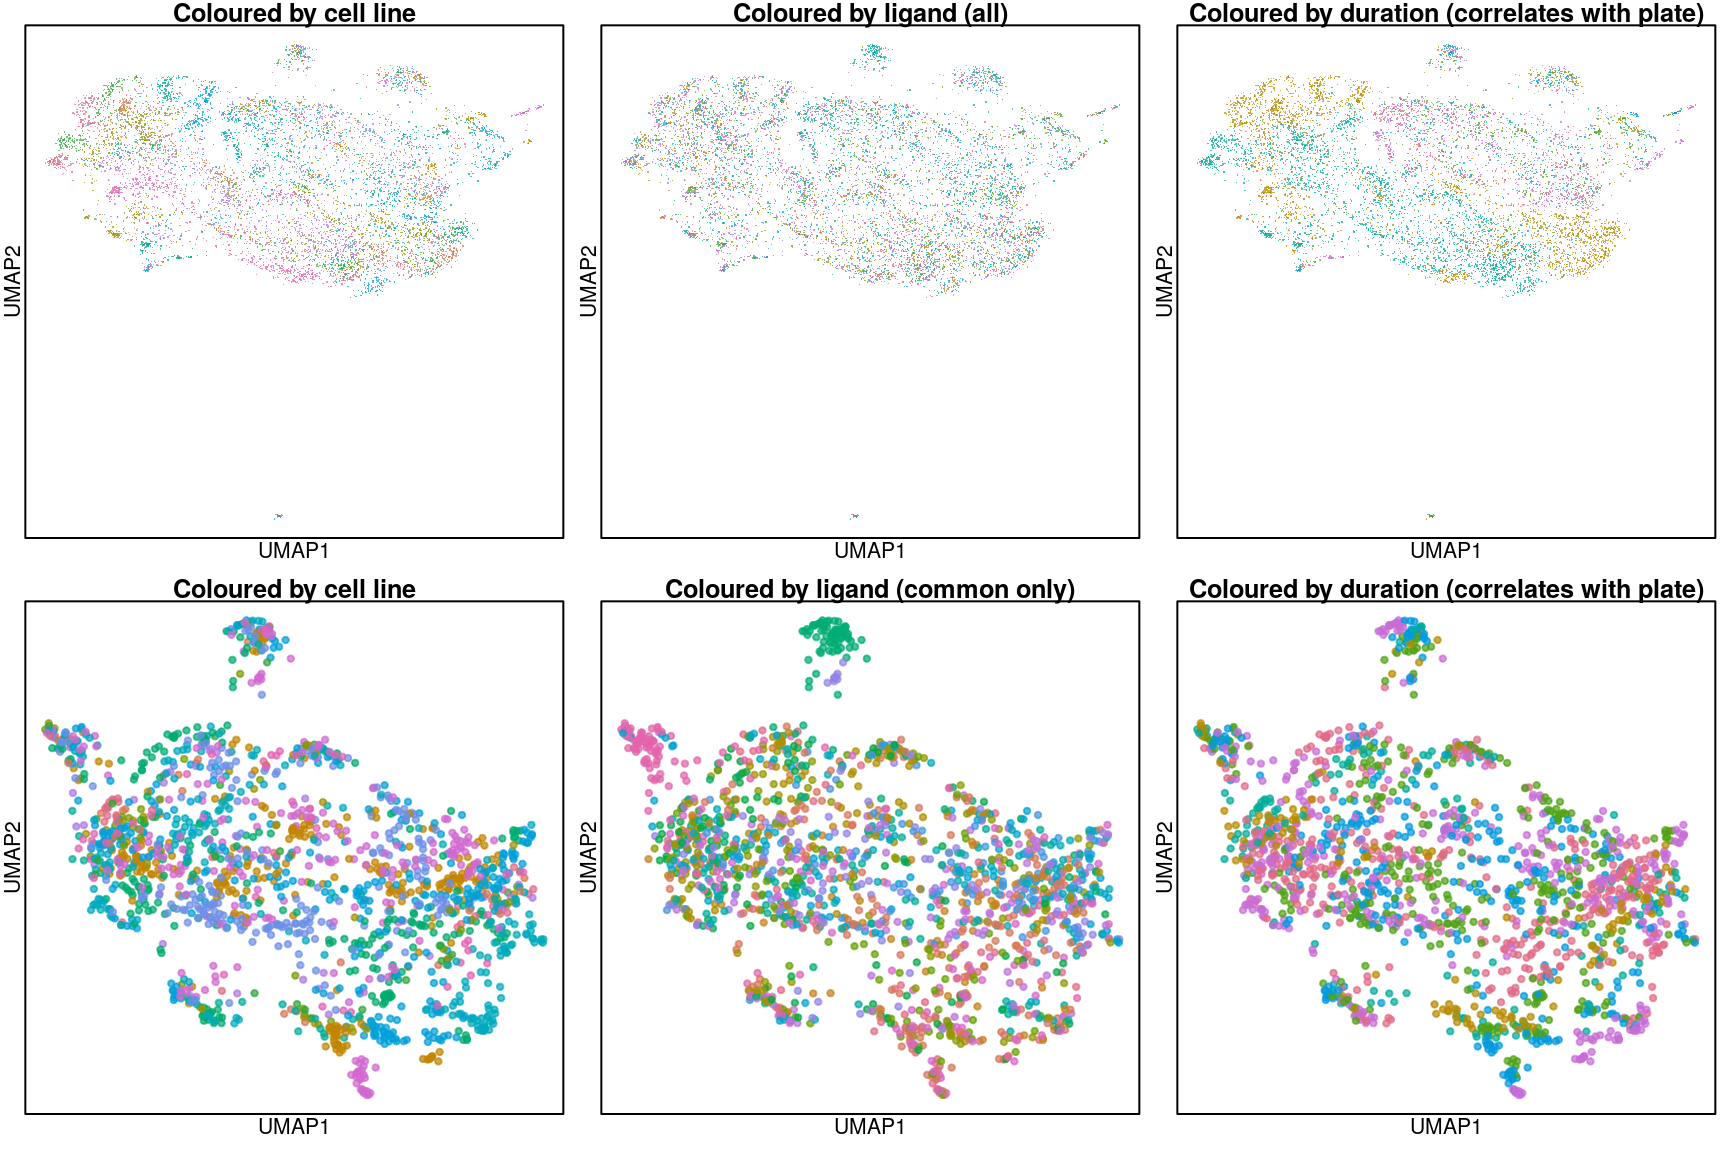
Overall UMAP
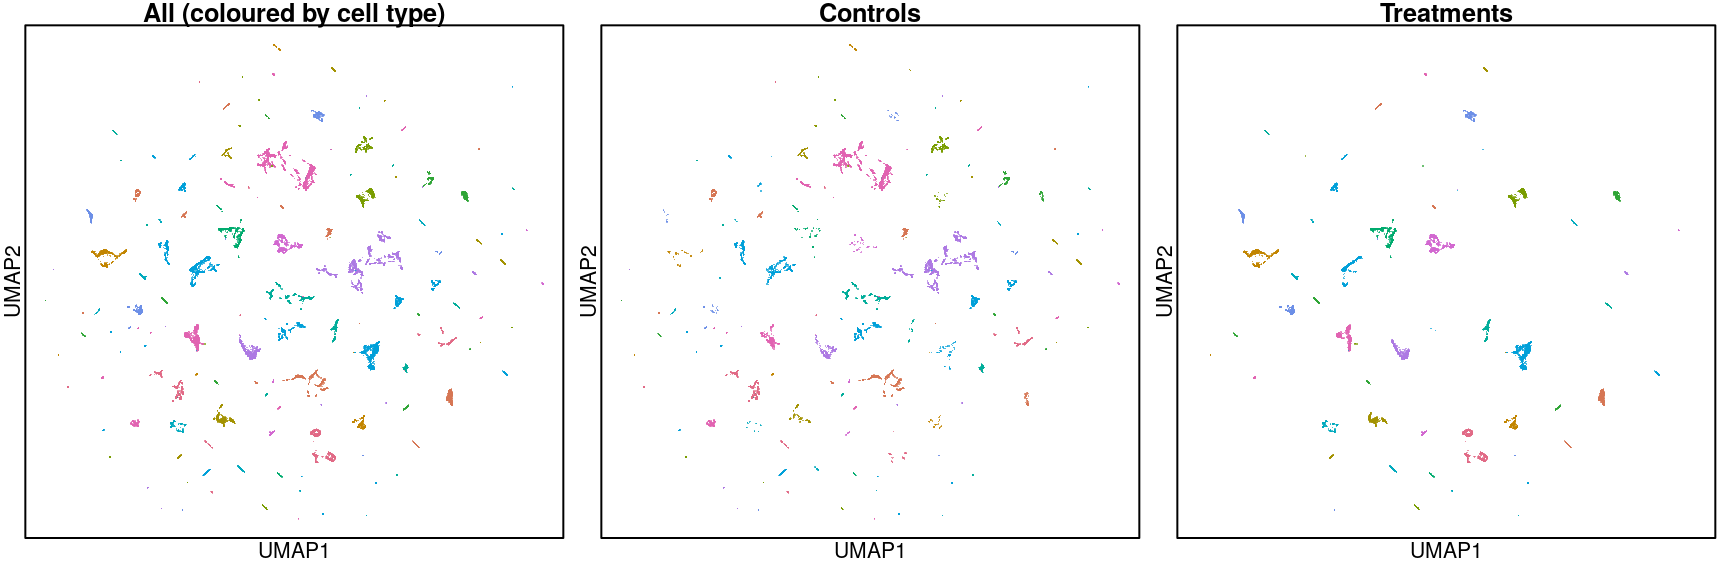
Above are UMAP projections (from assayed genes) of all Connectivity Map ligand-treated and control data coloured by cell type.
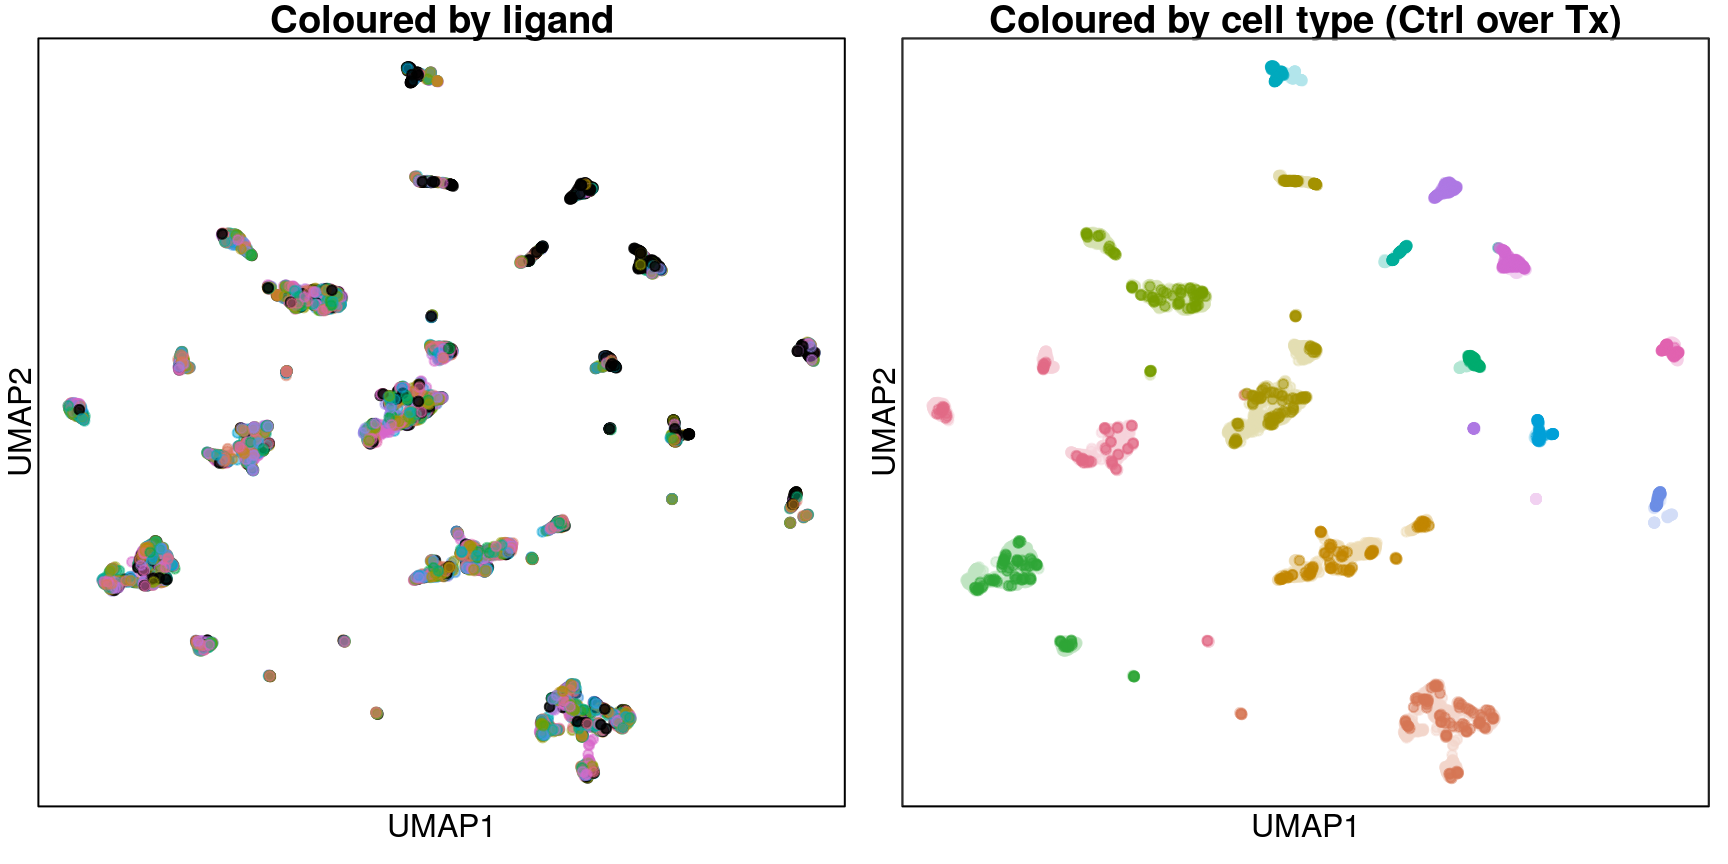
UMAP for common ligands only
Zooming in to include only the 16 ligands assayed in all cell types and their plate-matched controls (coloured in black).
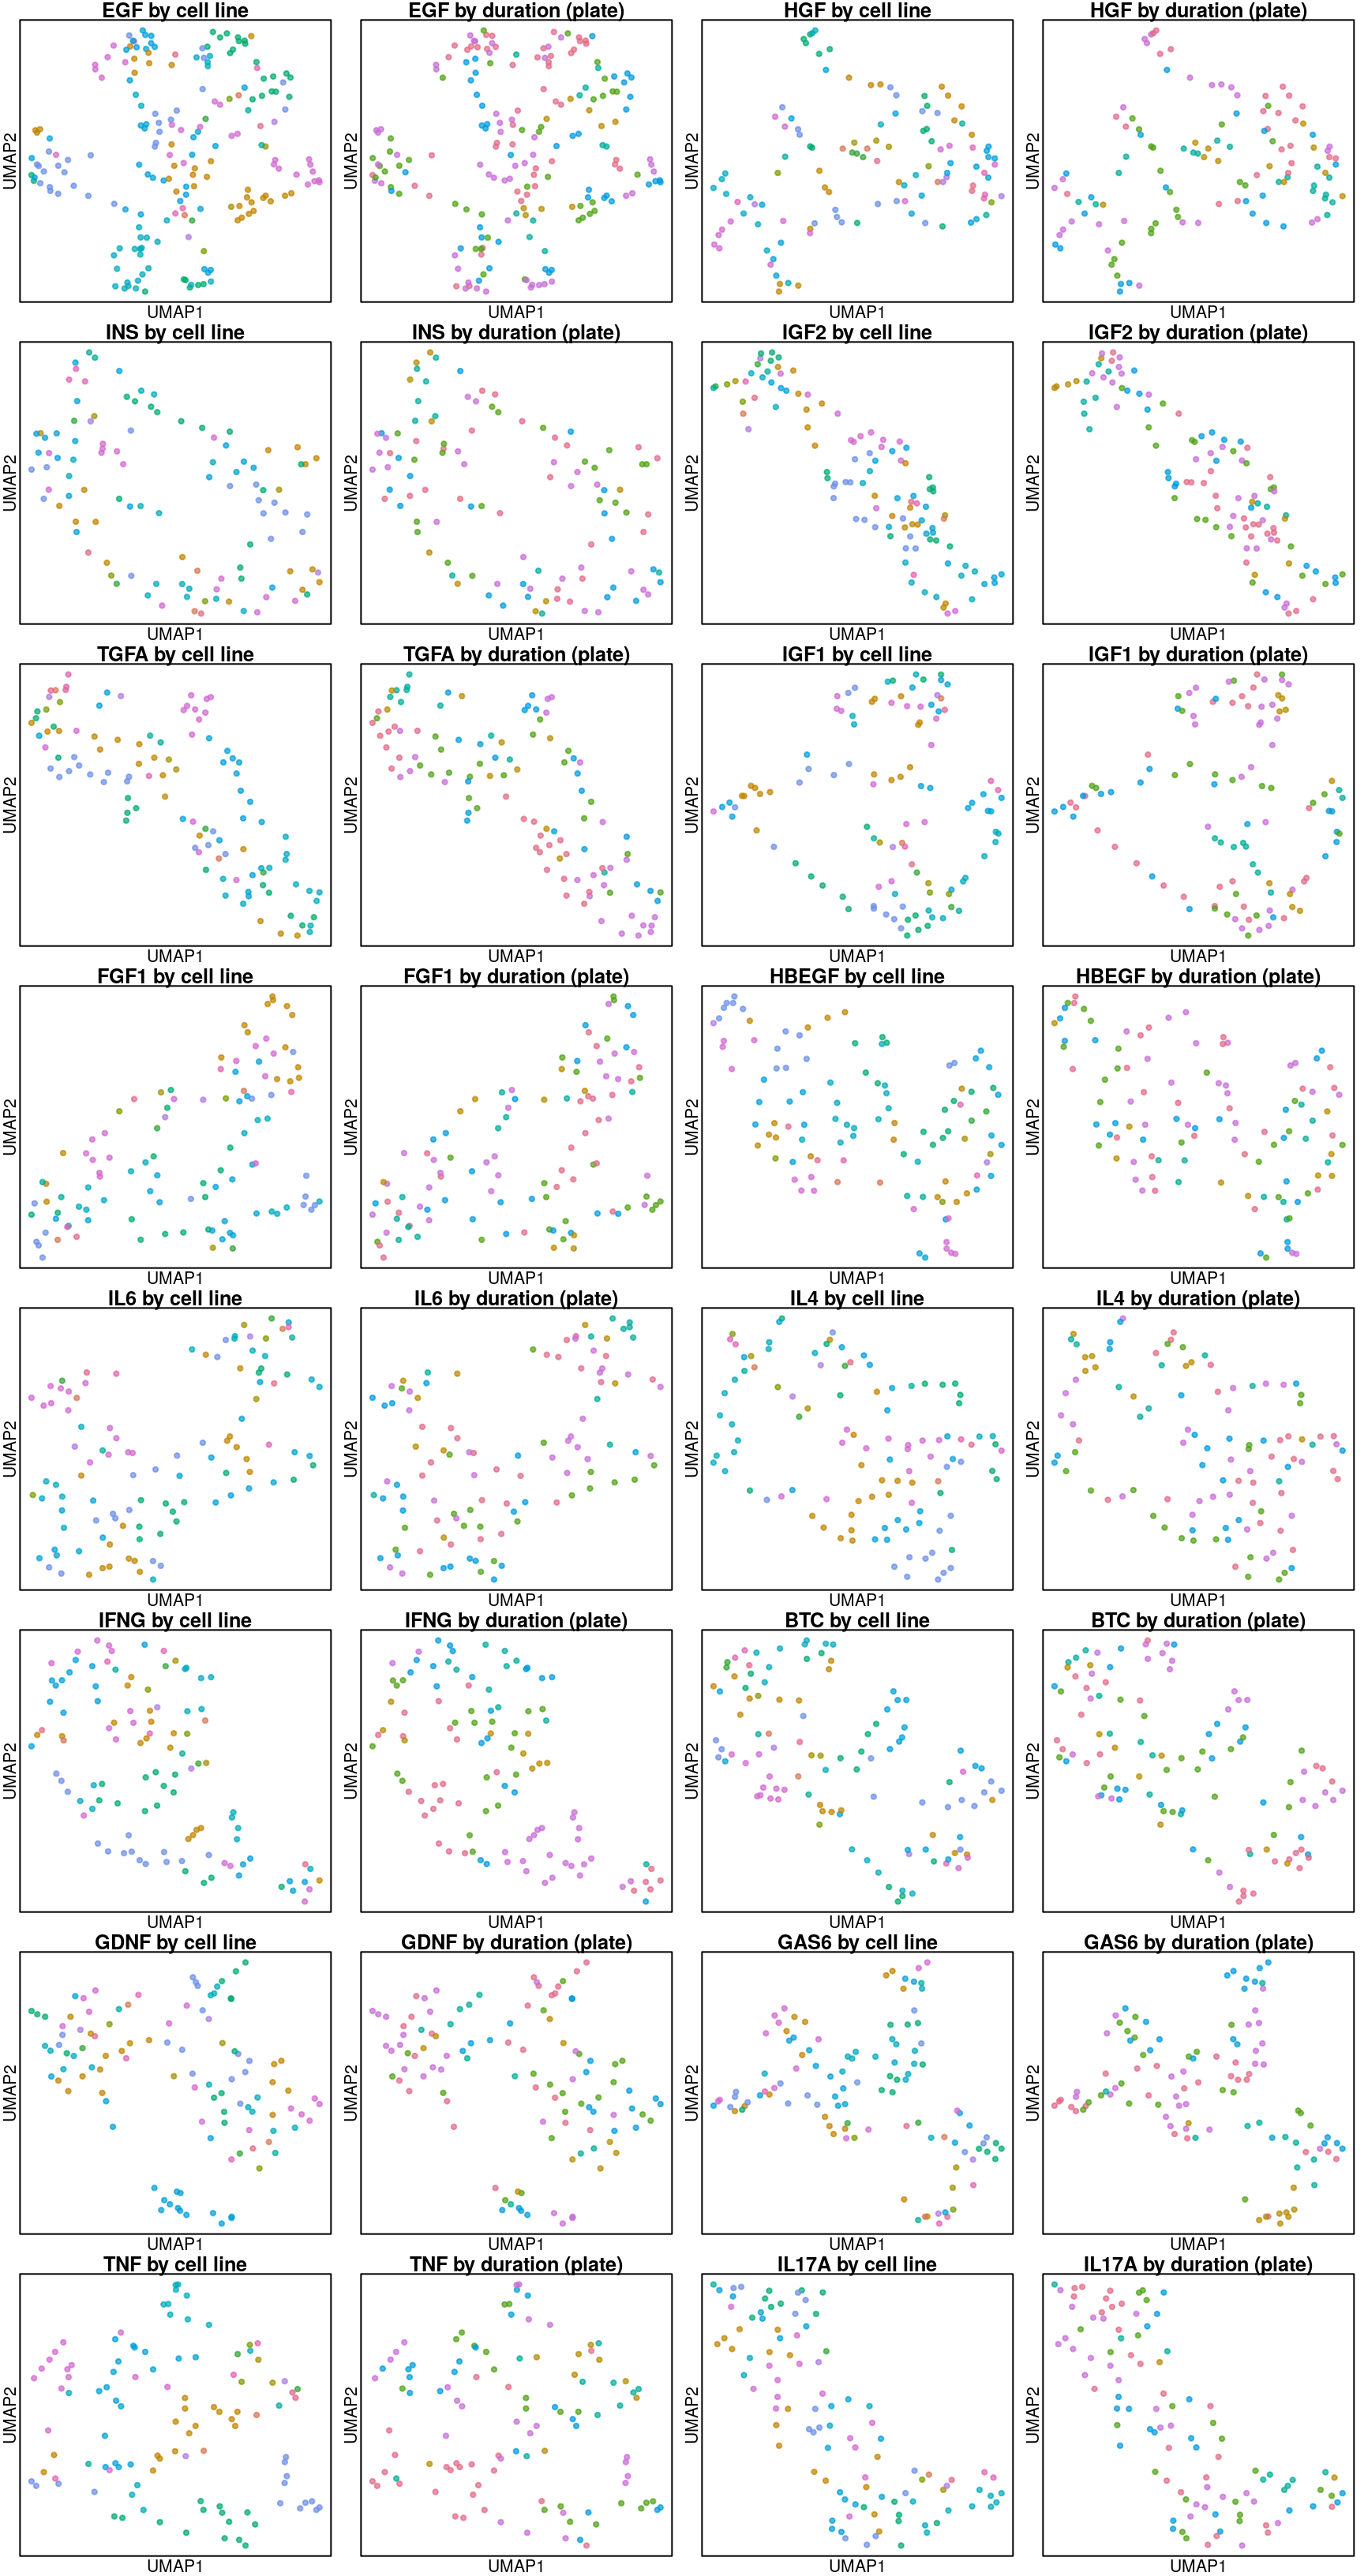
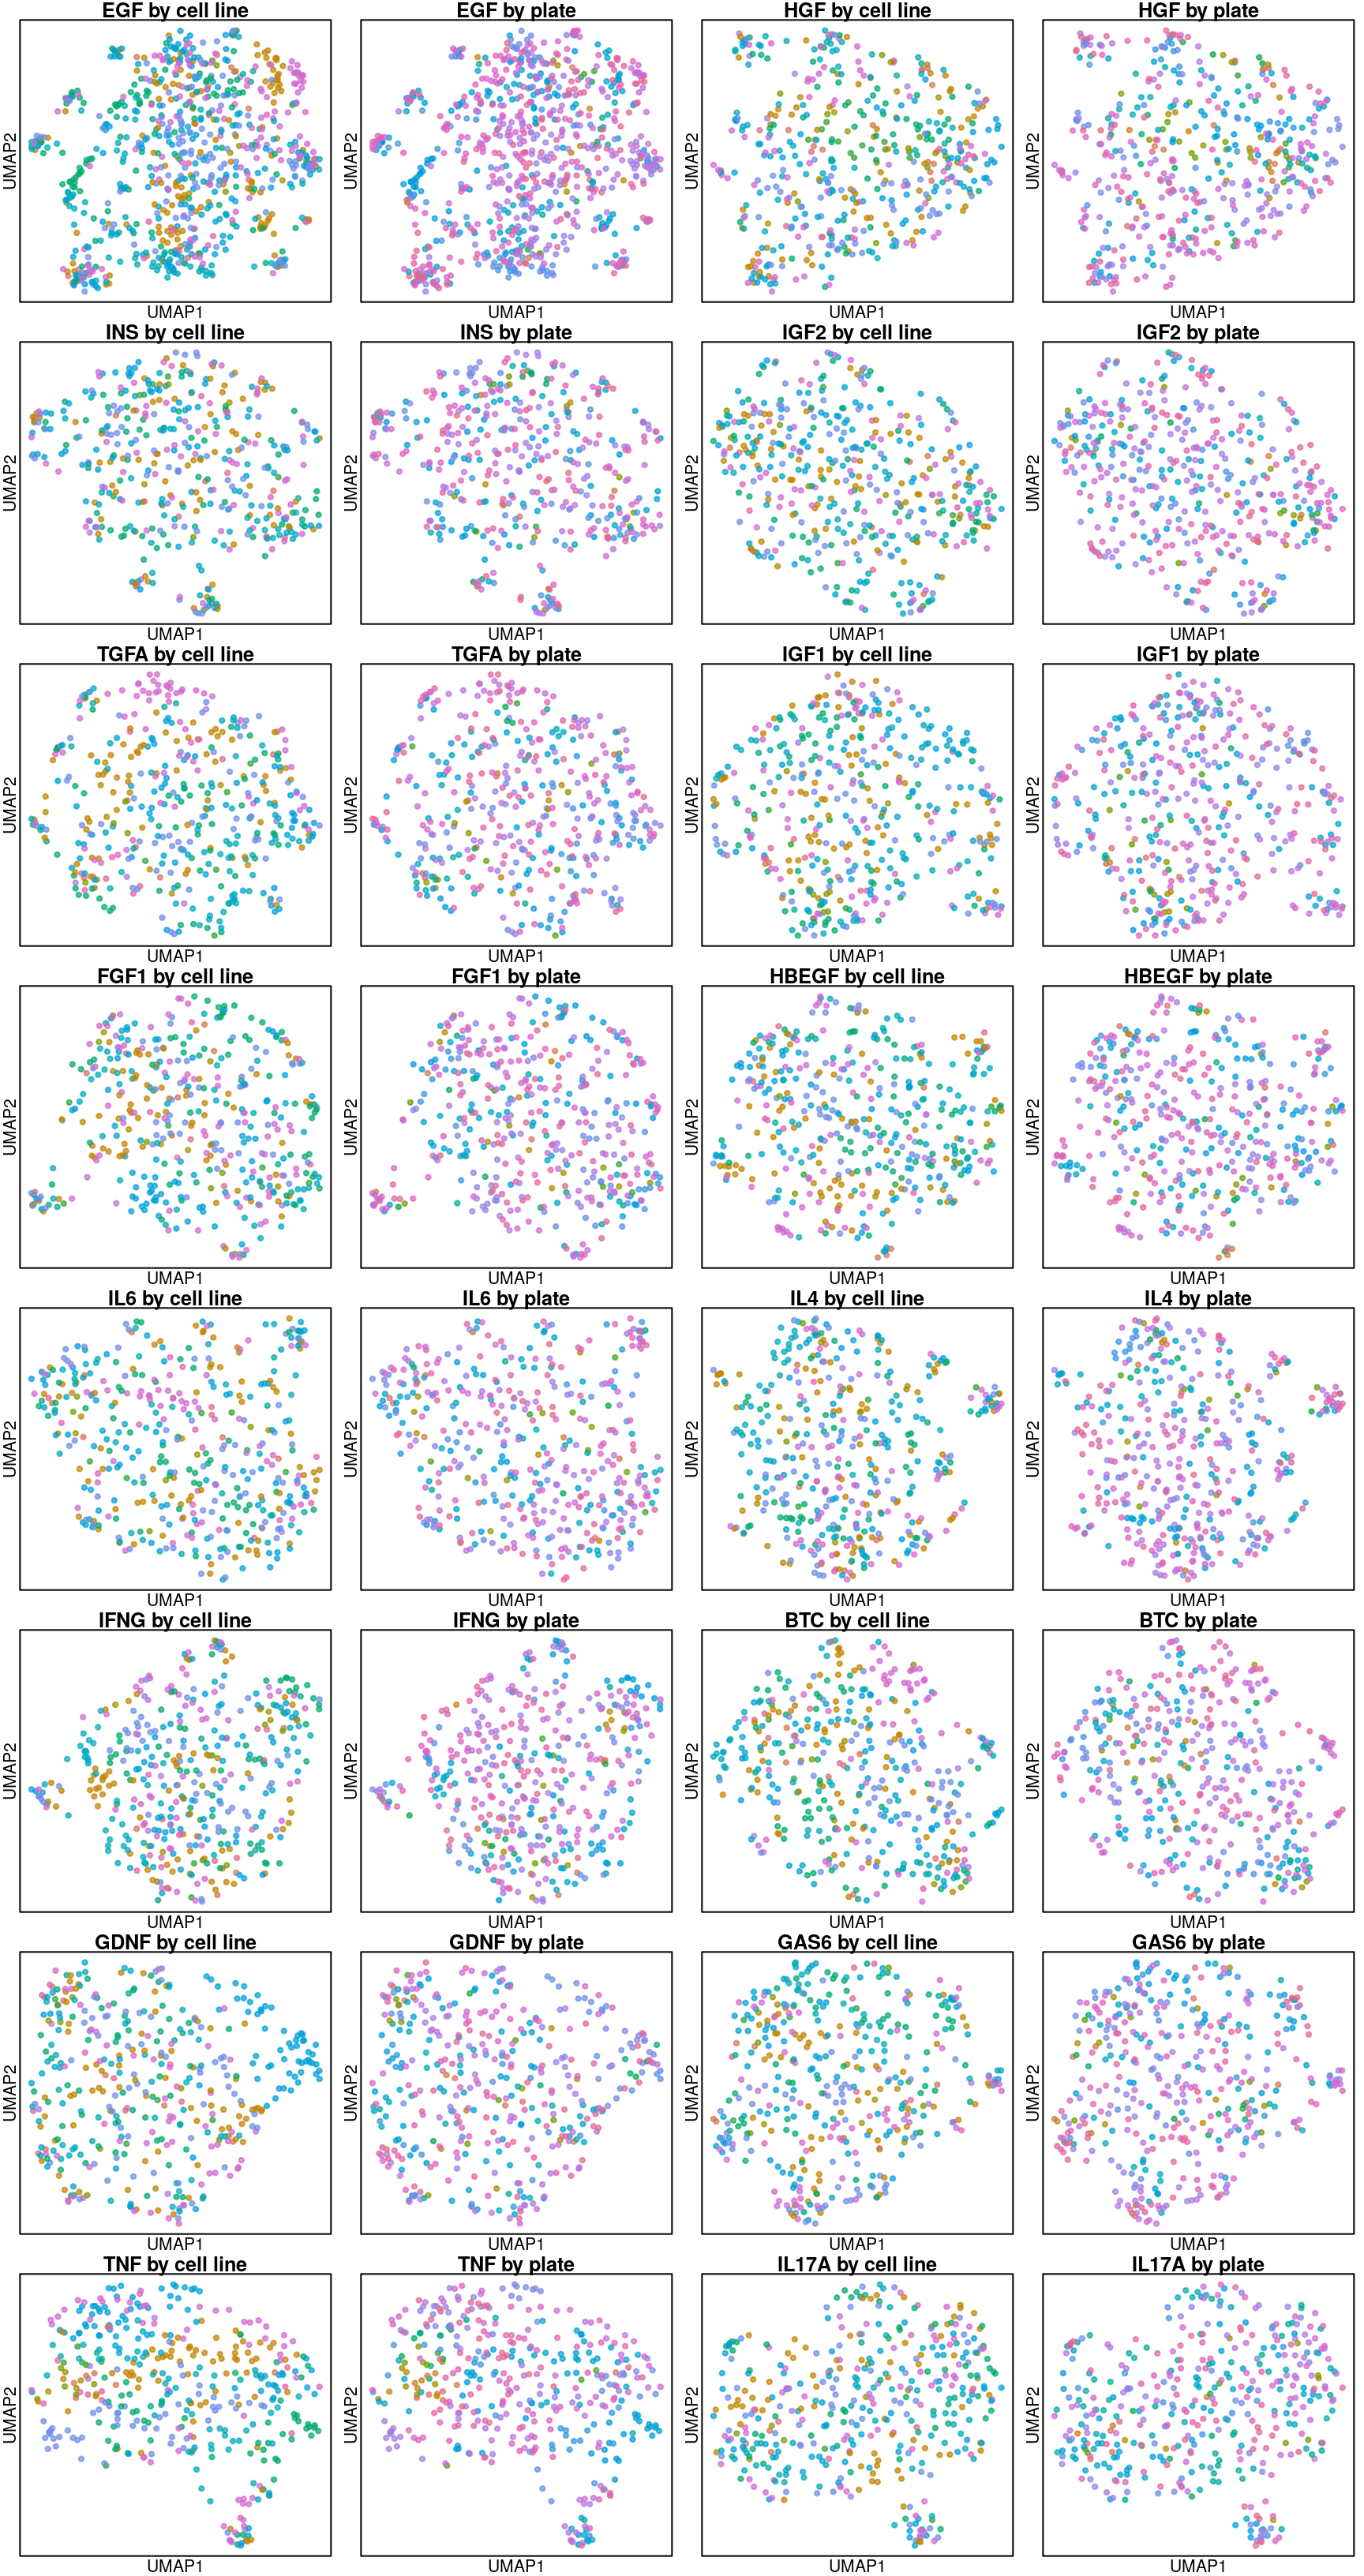
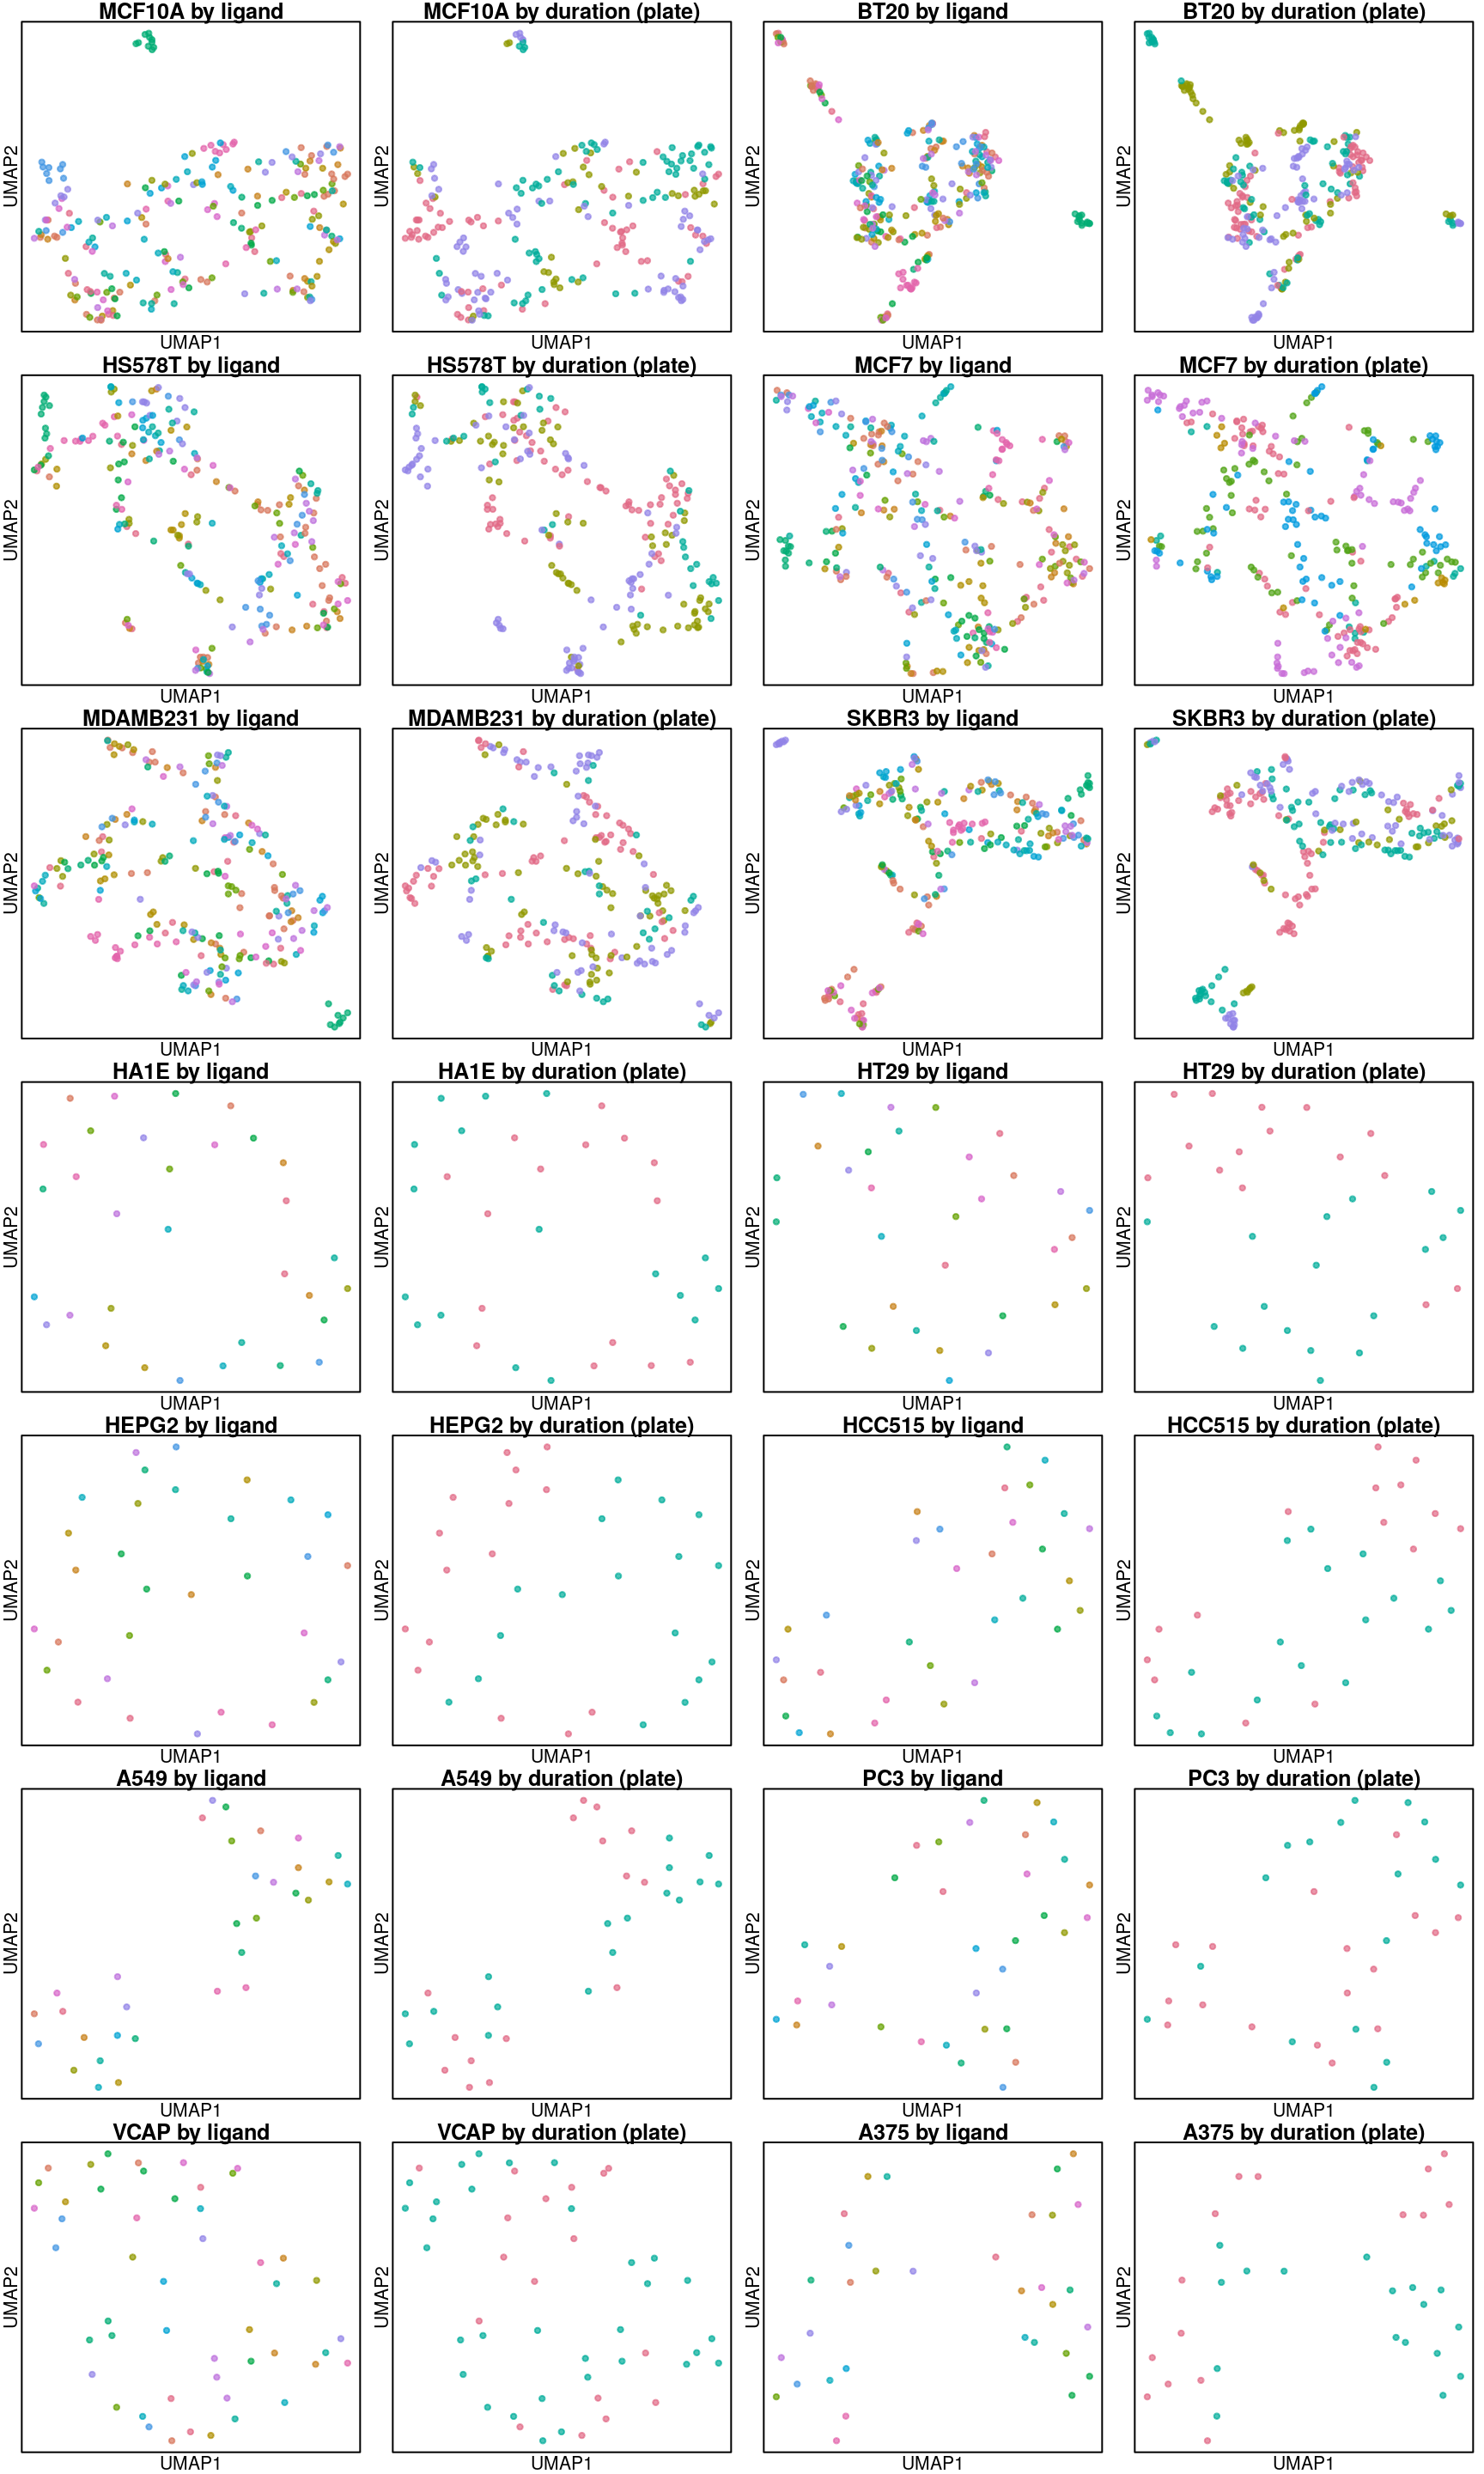
UMAP per cell line
Below are UMAP projections of ligand-treated and control samples for each cell type. Only the 16 ligands assayed in all cell types and their plate-matched controls (coloured in black) are included.
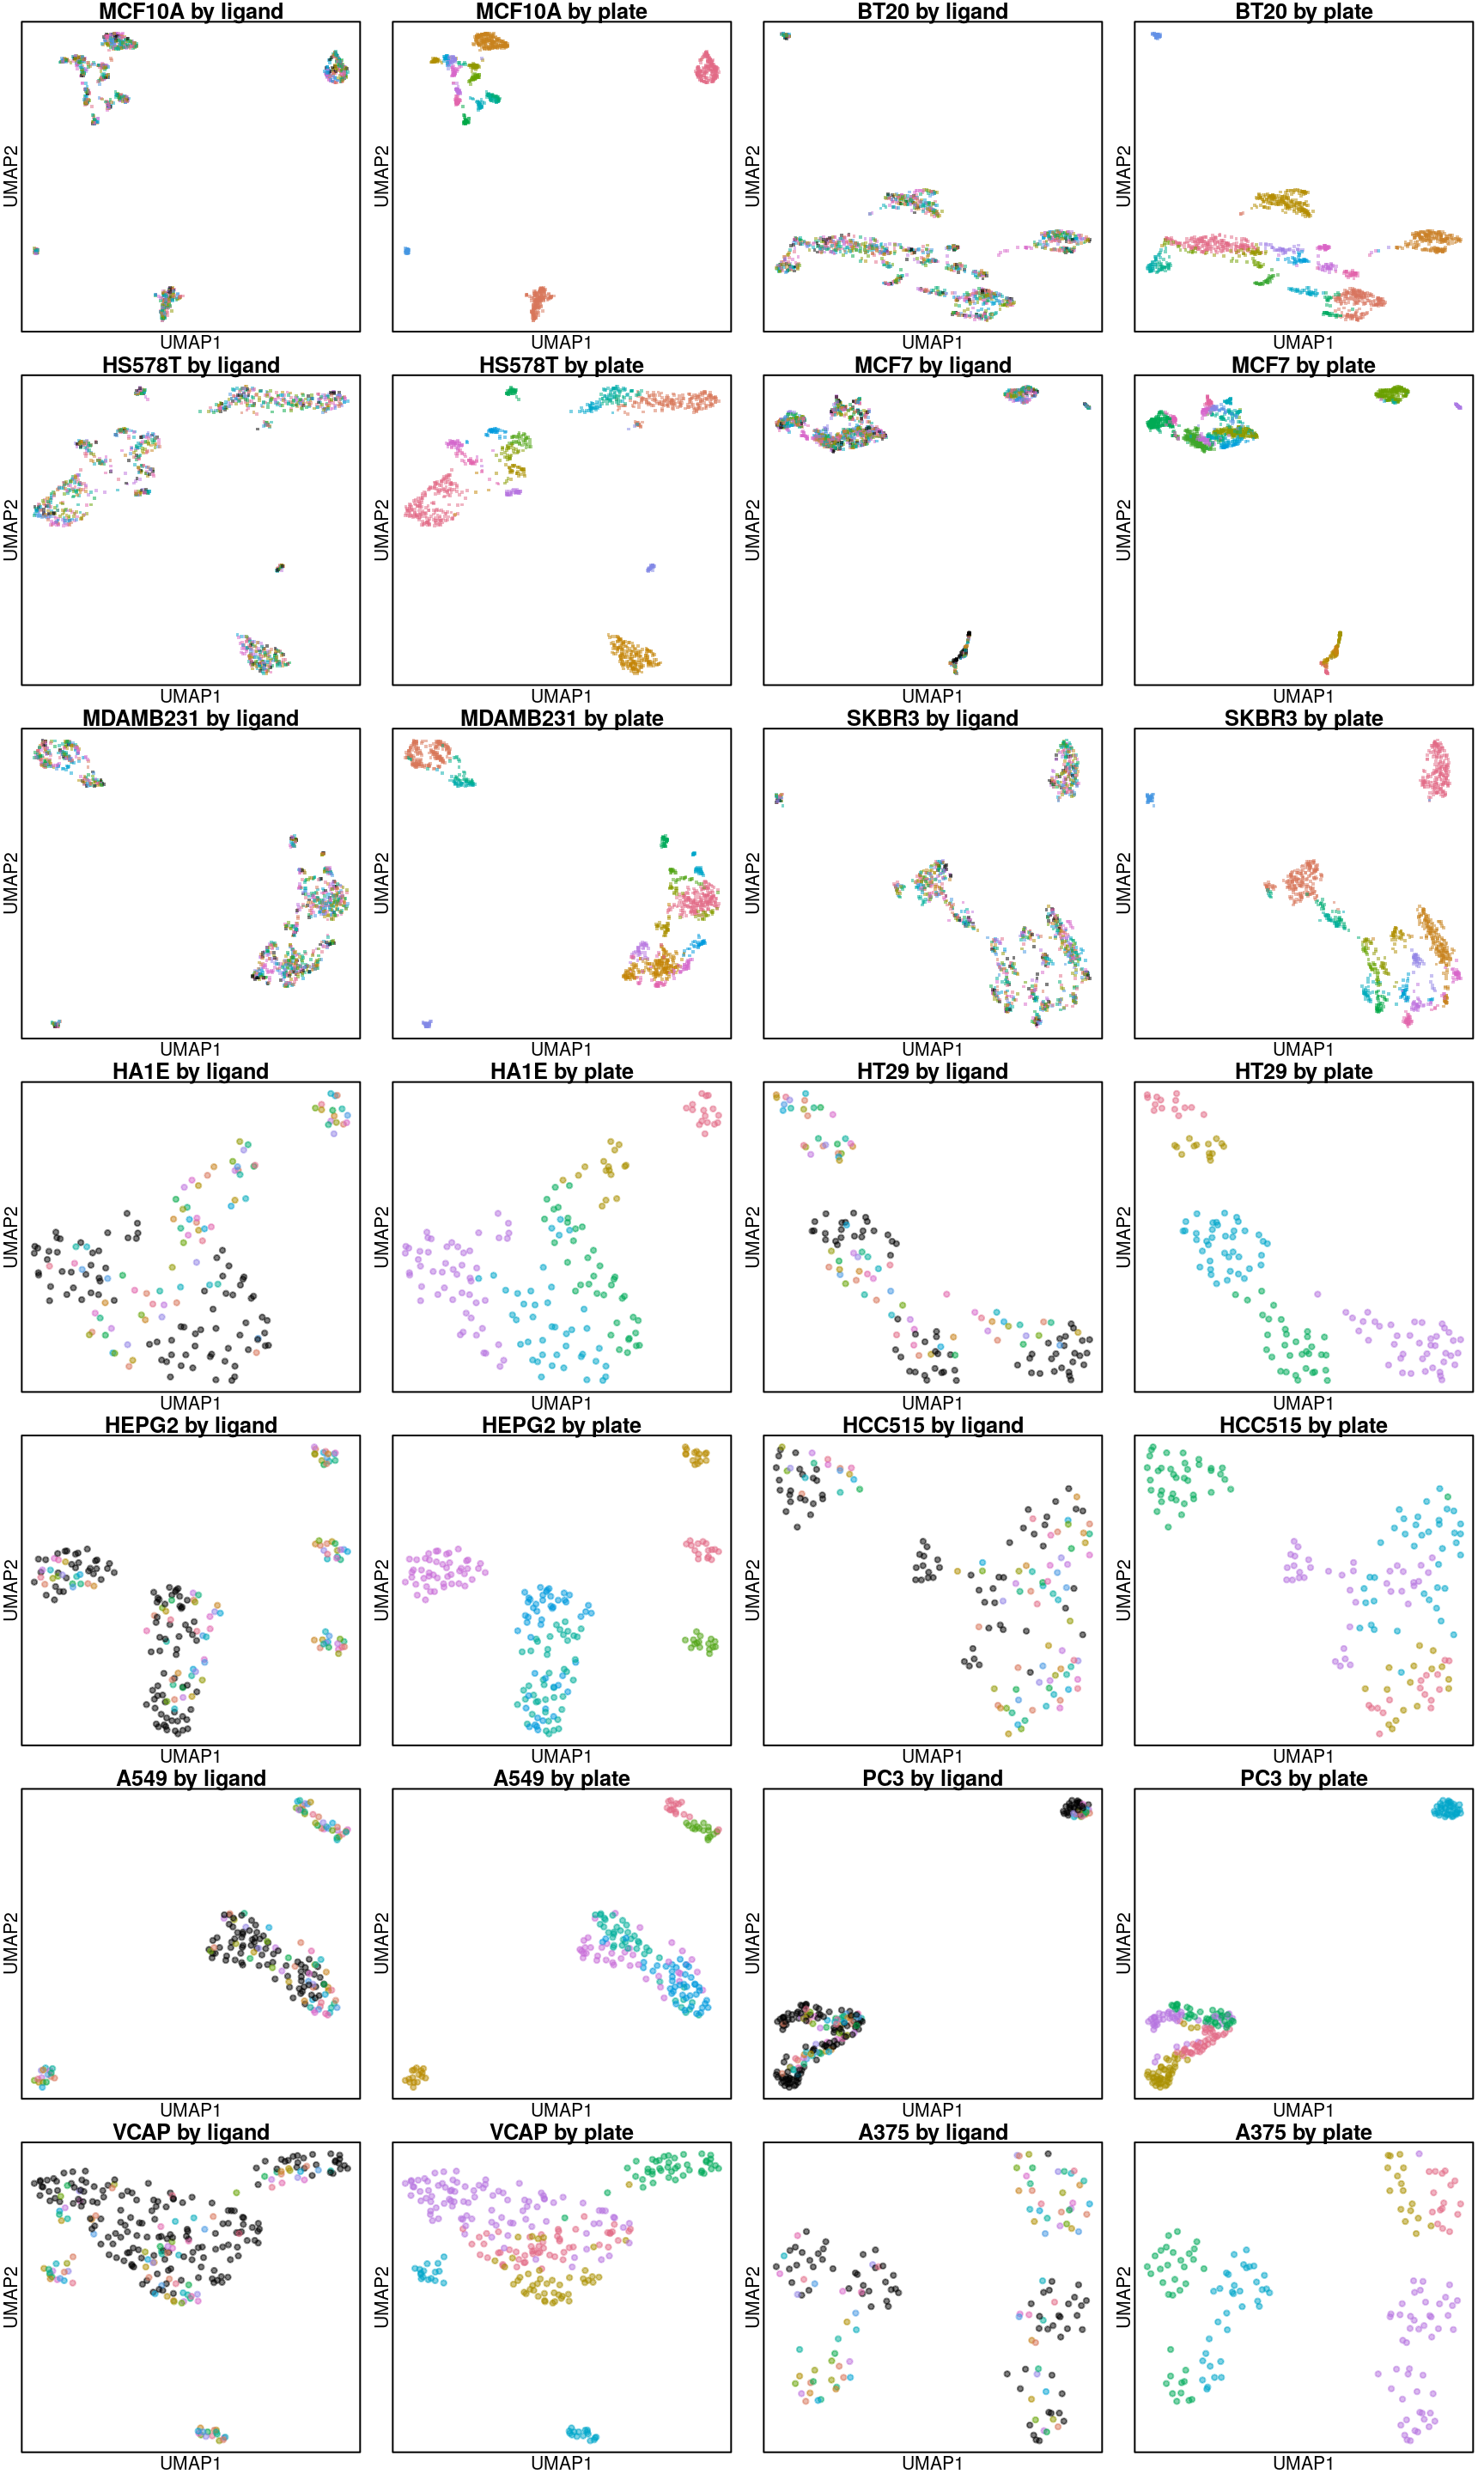
So it seems the plate effect is strong in this data. Might consider using the plate-based Z-scores from Cmap level 5 instead of the quantile normalized transcriptomes from level 3 that are shown here.
UMAP per ligand treatment
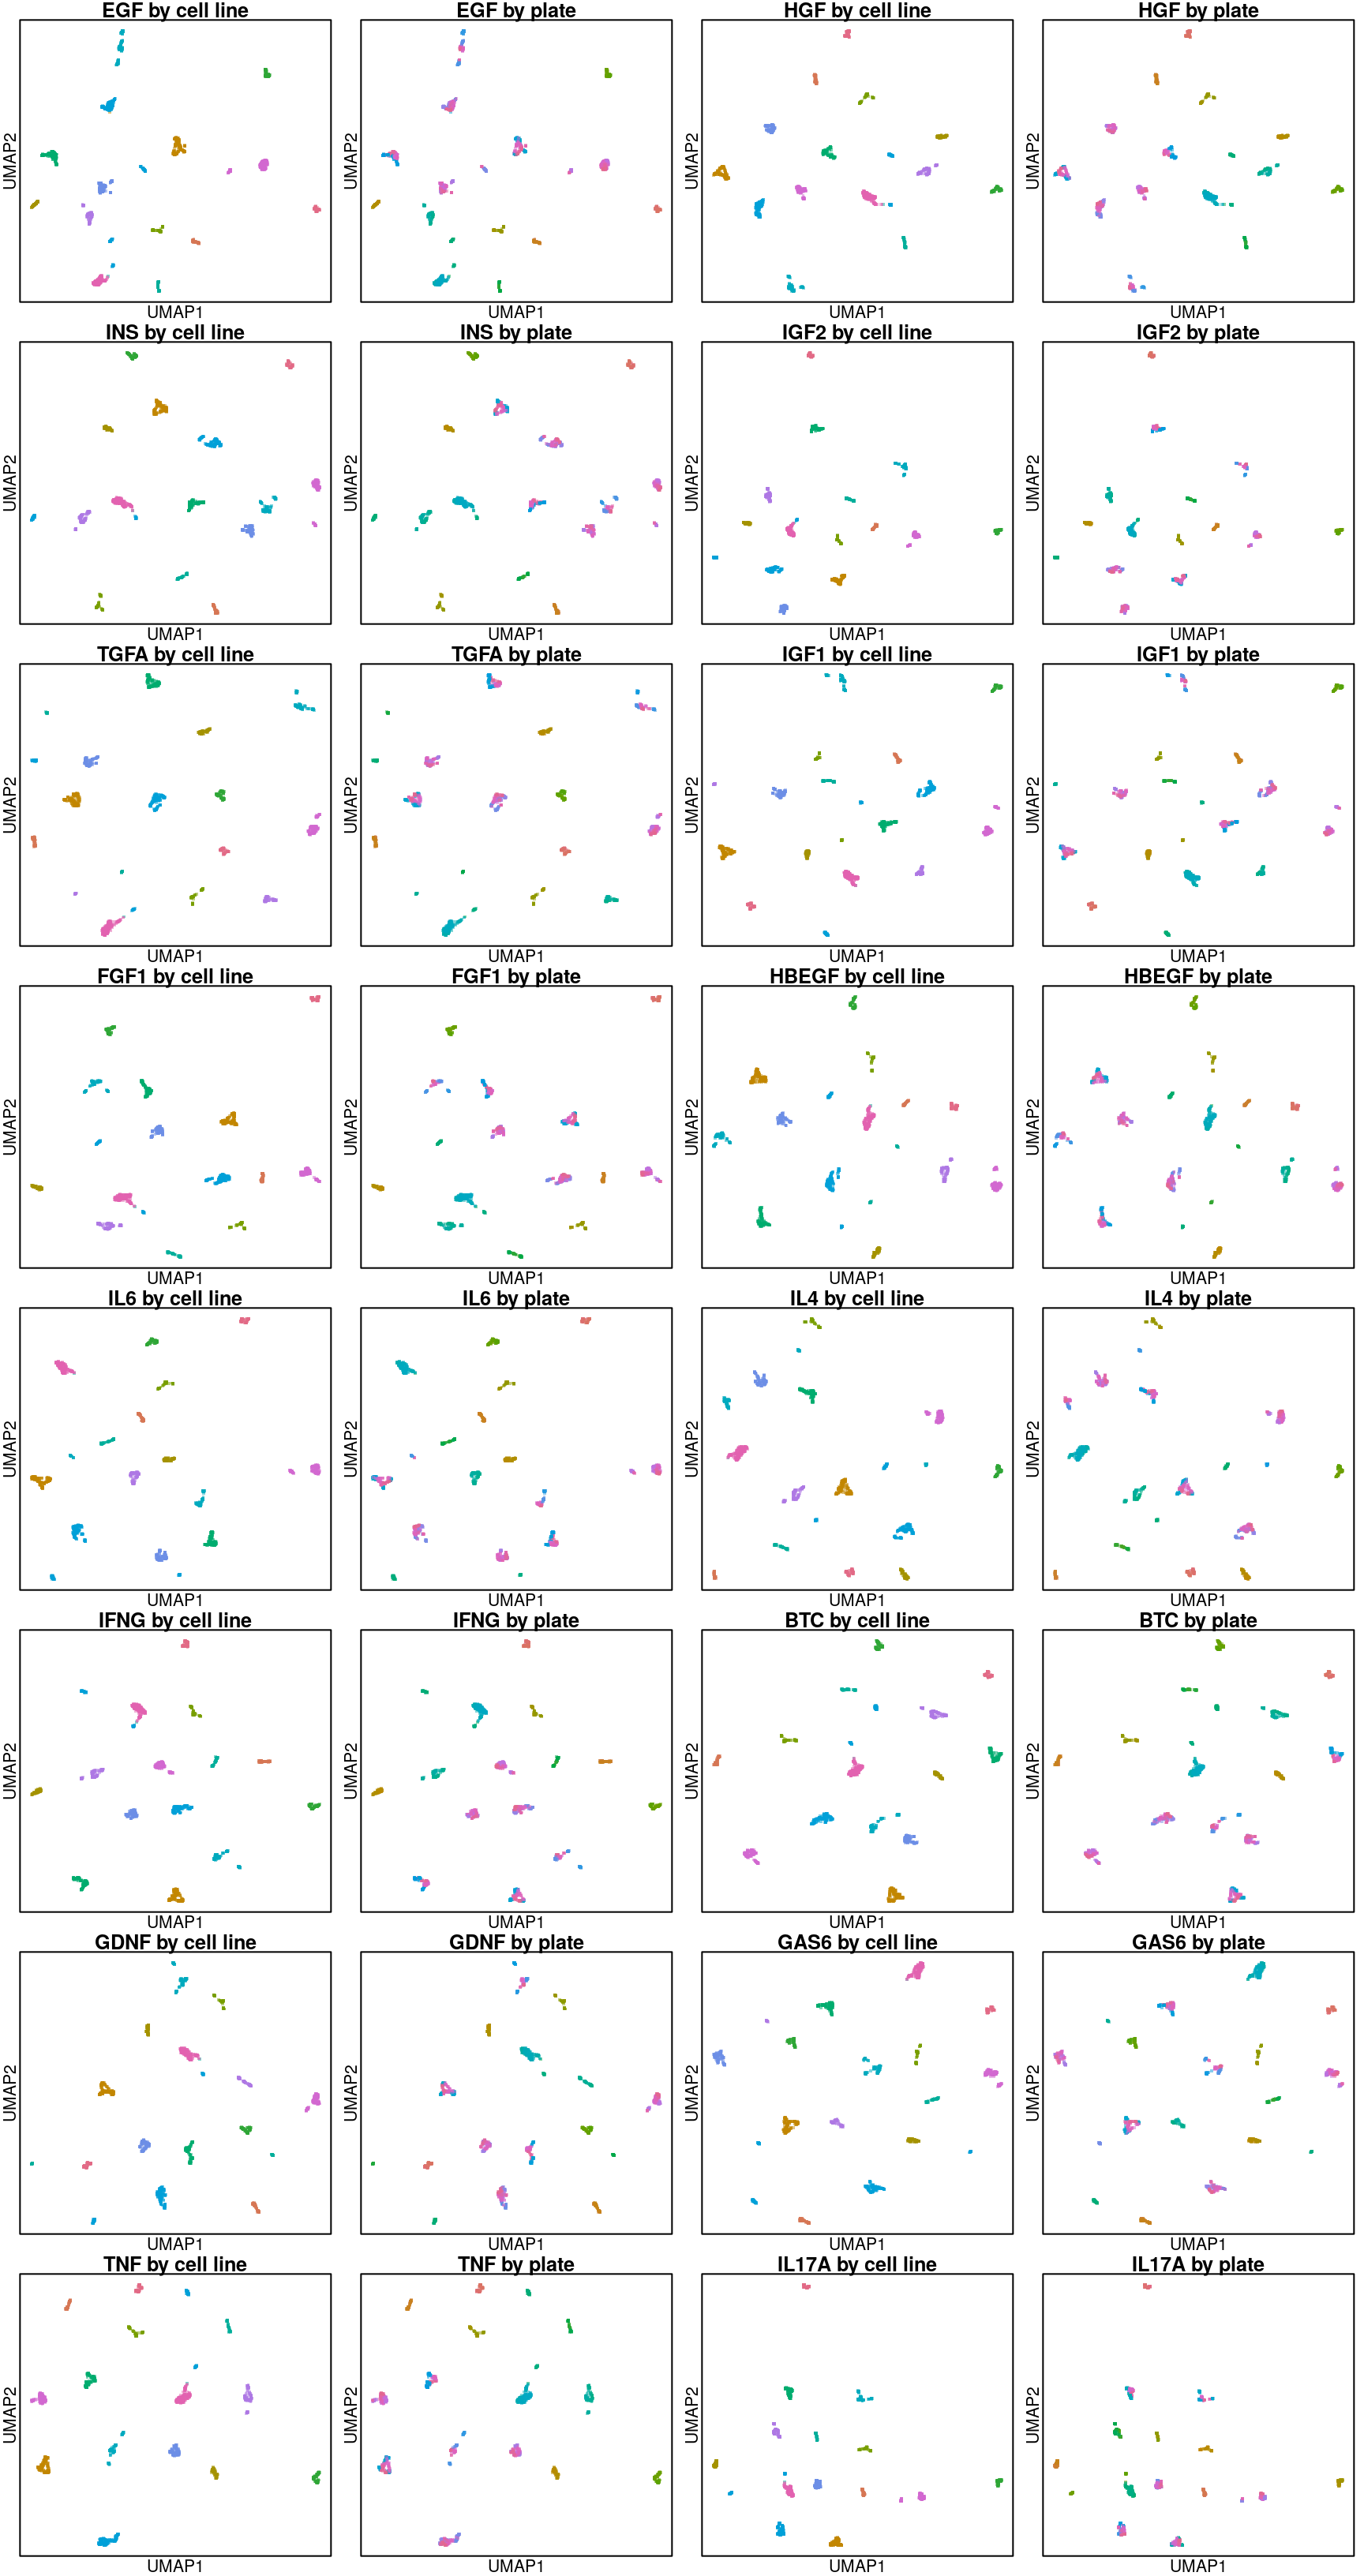
Looks like transcriptomes are entirely delineated by cell type from the ligand perspective.
Robust Z-scores of differences in cell line transcriptomes following ligand treatment (level 4 data)
| EGF | HGF | INS | IGF2 | TGFA | IGF1 | FGF1 | HBEGF | IL6 | IL4 | IFNG | BTC | GDNF | GAS6 | TNF | IL17A | Total | |
|---|---|---|---|---|---|---|---|---|---|---|---|---|---|---|---|---|---|
| breast_normal_MCF10A | 119 | 62 | 62 | 62 | 62 | 62 | 59 | 61 | 60 | 59 | 60 | 60 | 61 | 60 | 62 | 60 | 1031 |
| breast_tumor_BT20 | 146 | 74 | 74 | 73 | 74 | 74 | 74 | 74 | 73 | 74 | 73 | 74 | 74 | 69 | 74 | 74 | 1248 |
| breast_tumor_HS578T | 120 | 58 | 59 | 60 | 60 | 60 | 60 | 60 | 60 | 59 | 58 | 57 | 58 | 59 | 55 | 60 | 1003 |
| breast_tumor_MCF7 | 153 | 83 | 80 | 80 | 80 | 80 | 80 | 80 | 78 | 78 | 78 | 80 | 79 | 76 | 75 | 75 | 1335 |
| breast_tumor_MDAMB231 | 120 | 58 | 60 | 60 | 60 | 60 | 60 | 60 | 60 | 60 | 59 | 58 | 59 | 59 | 56 | 60 | 1009 |
| breast_tumor_SKBR3 | 123 | 57 | 62 | 62 | 62 | 62 | 62 | 62 | 62 | 62 | 61 | 60 | 58 | 62 | 57 | 62 | 1036 |
| kidney_normal_HA1E | 5 | 10 | 5 | 5 | 5 | 5 | 5 | 5 | 5 | 5 | 5 | 5 | 5 | 5 | 5 | 3 | 83 |
| large_intestine_tumor_HT29 | 5 | 10 | 5 | 5 | 4 | 4 | 5 | 4 | 5 | 4 | 5 | 4 | 4 | 4 | 5 | 3 | 76 |
| liver_tumor_HEPG2 | 6 | 12 | 6 | 6 | 6 | 6 | 6 | 6 | 6 | 6 | 6 | 6 | 5 | 6 | 6 | 3 | 98 |
| lung_normal_HCC515 | 5 | 10 | 5 | 5 | 5 | 5 | 5 | 5 | 5 | 5 | 5 | 5 | 5 | 5 | 5 | 3 | 83 |
| lung_tumor_A549 | 6 | 12 | 6 | 6 | 6 | 6 | 6 | 5 | 6 | 5 | 6 | 6 | 6 | 6 | 6 | 3 | 97 |
| prostate_tumor_PC3 | 5 | 7 | 5 | 5 | 4 | 4 | 5 | 5 | 4 | 5 | 5 | 5 | 3 | 4 | 5 | 5 | 76 |
| prostate_tumor_VCAP | 6 | 12 | 6 | 6 | 6 | 6 | 6 | 6 | 6 | 6 | 6 | 6 | 6 | 6 | 6 | 4 | 100 |
| skin_tumor_A375 | 5 | 10 | 5 | 5 | 5 | 5 | 5 | 5 | 5 | 5 | 5 | 5 | 5 | 5 | 5 | 3 | 83 |
| Total | 824 | 475 | 440 | 440 | 439 | 439 | 438 | 438 | 435 | 433 | 432 | 431 | 428 | 426 | 422 | 418 | 7358 |
Overall UMAP
Last line are UMAP projections using all (including inferred) gene Z-scores. This was included to see whether adding inferred genes improved the structure, but that doesn’t seem to be the case.
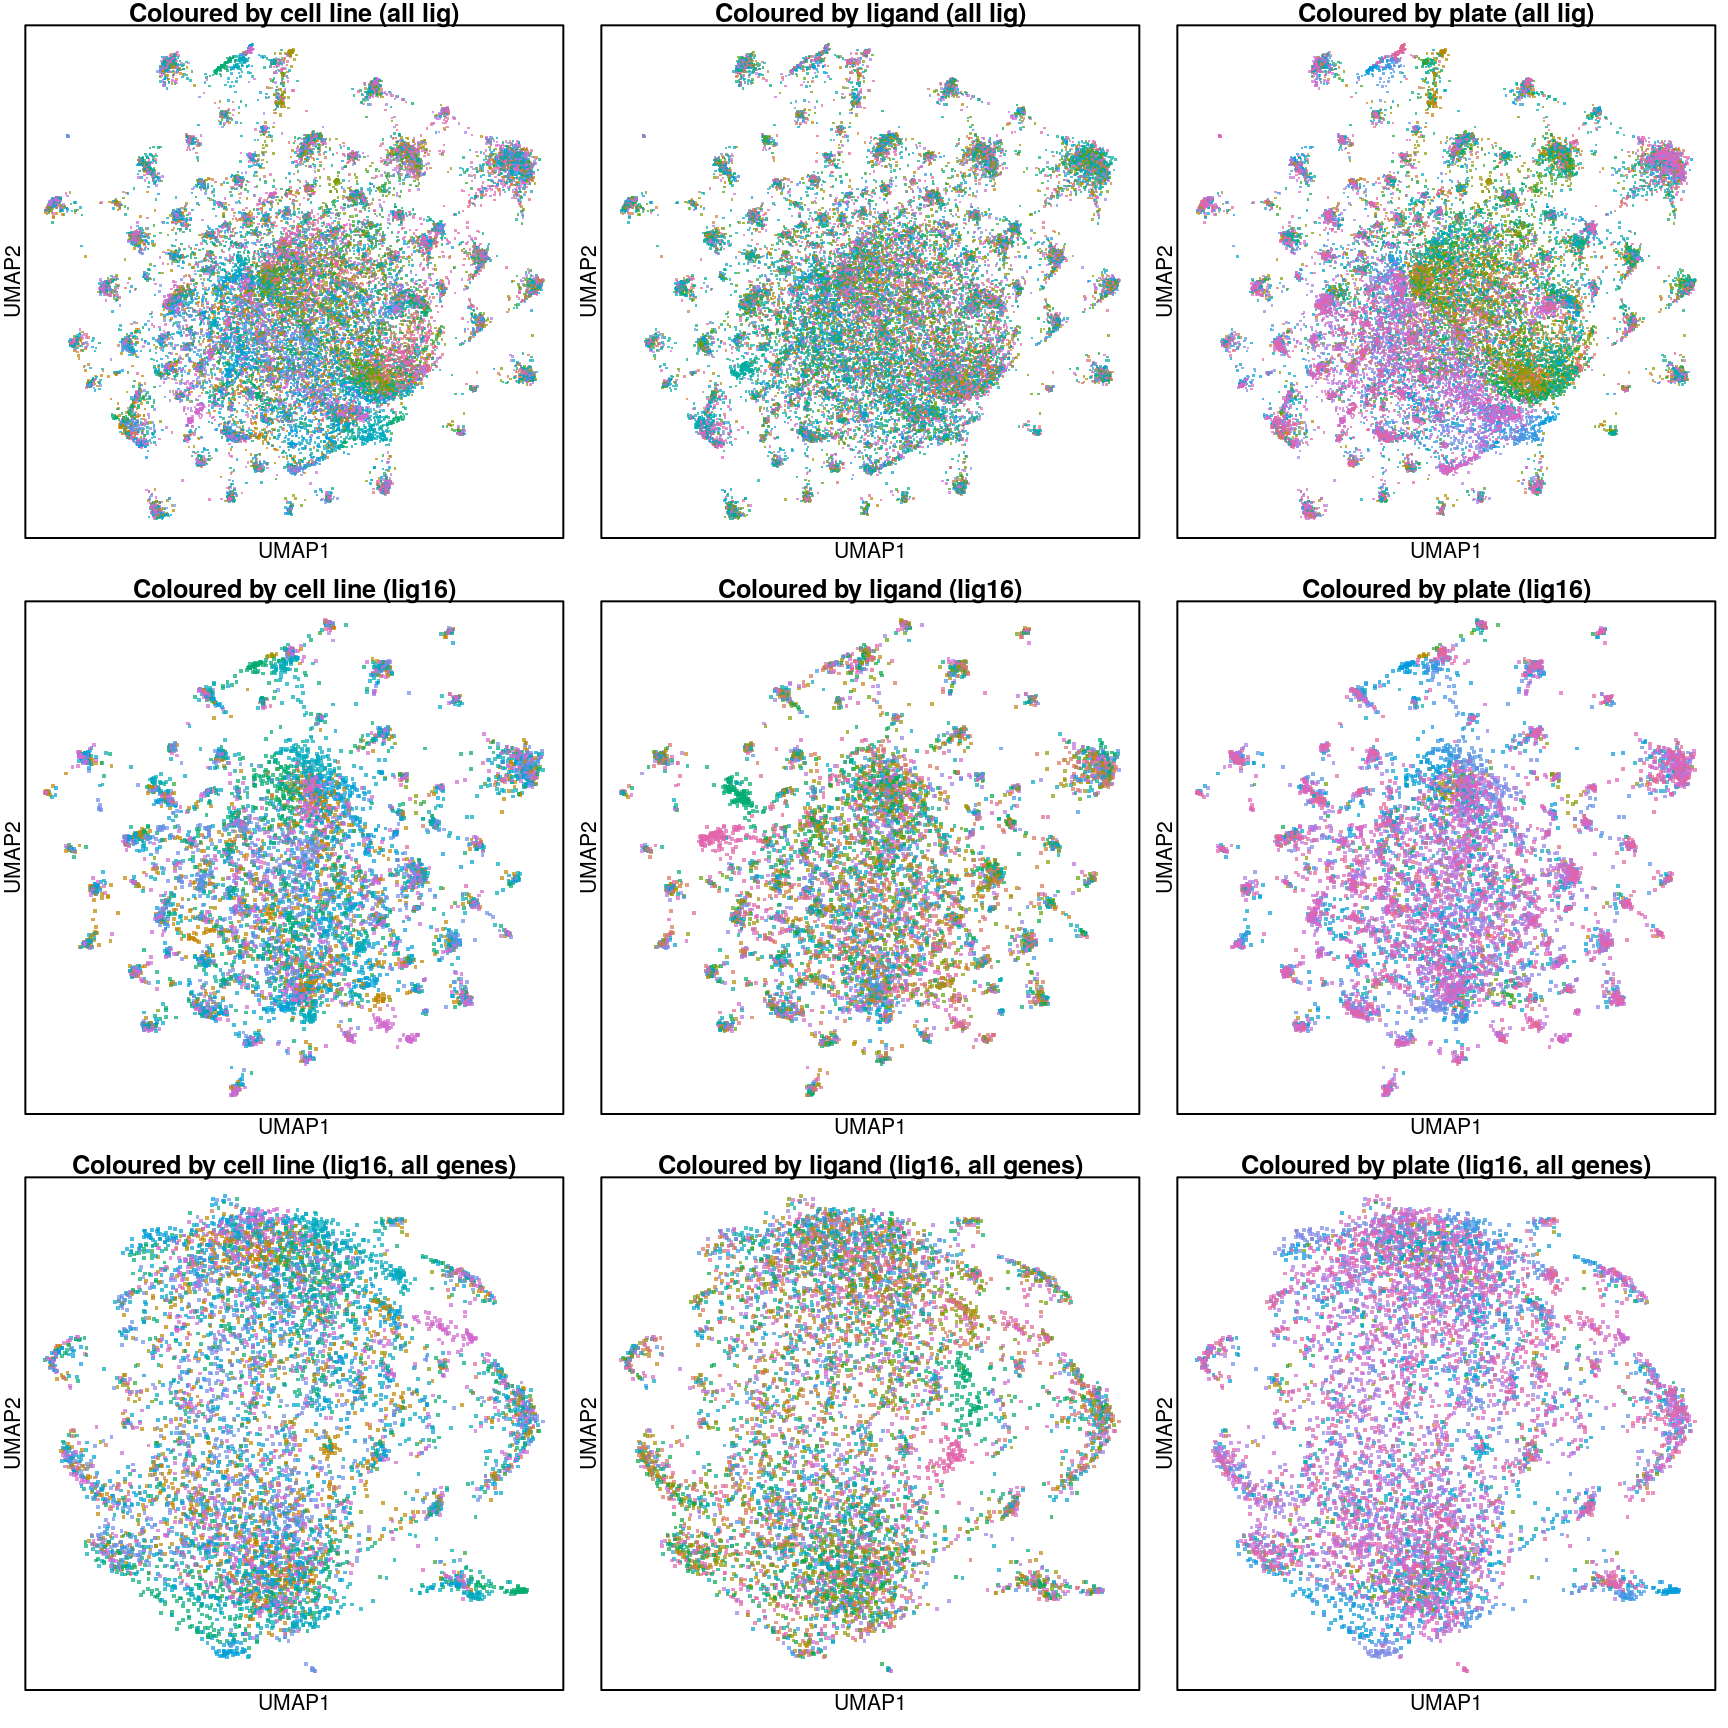
Above are UMAP projections (from assayed genes) of all Connectivity Map ligand-treated and control data coloured by cell type.
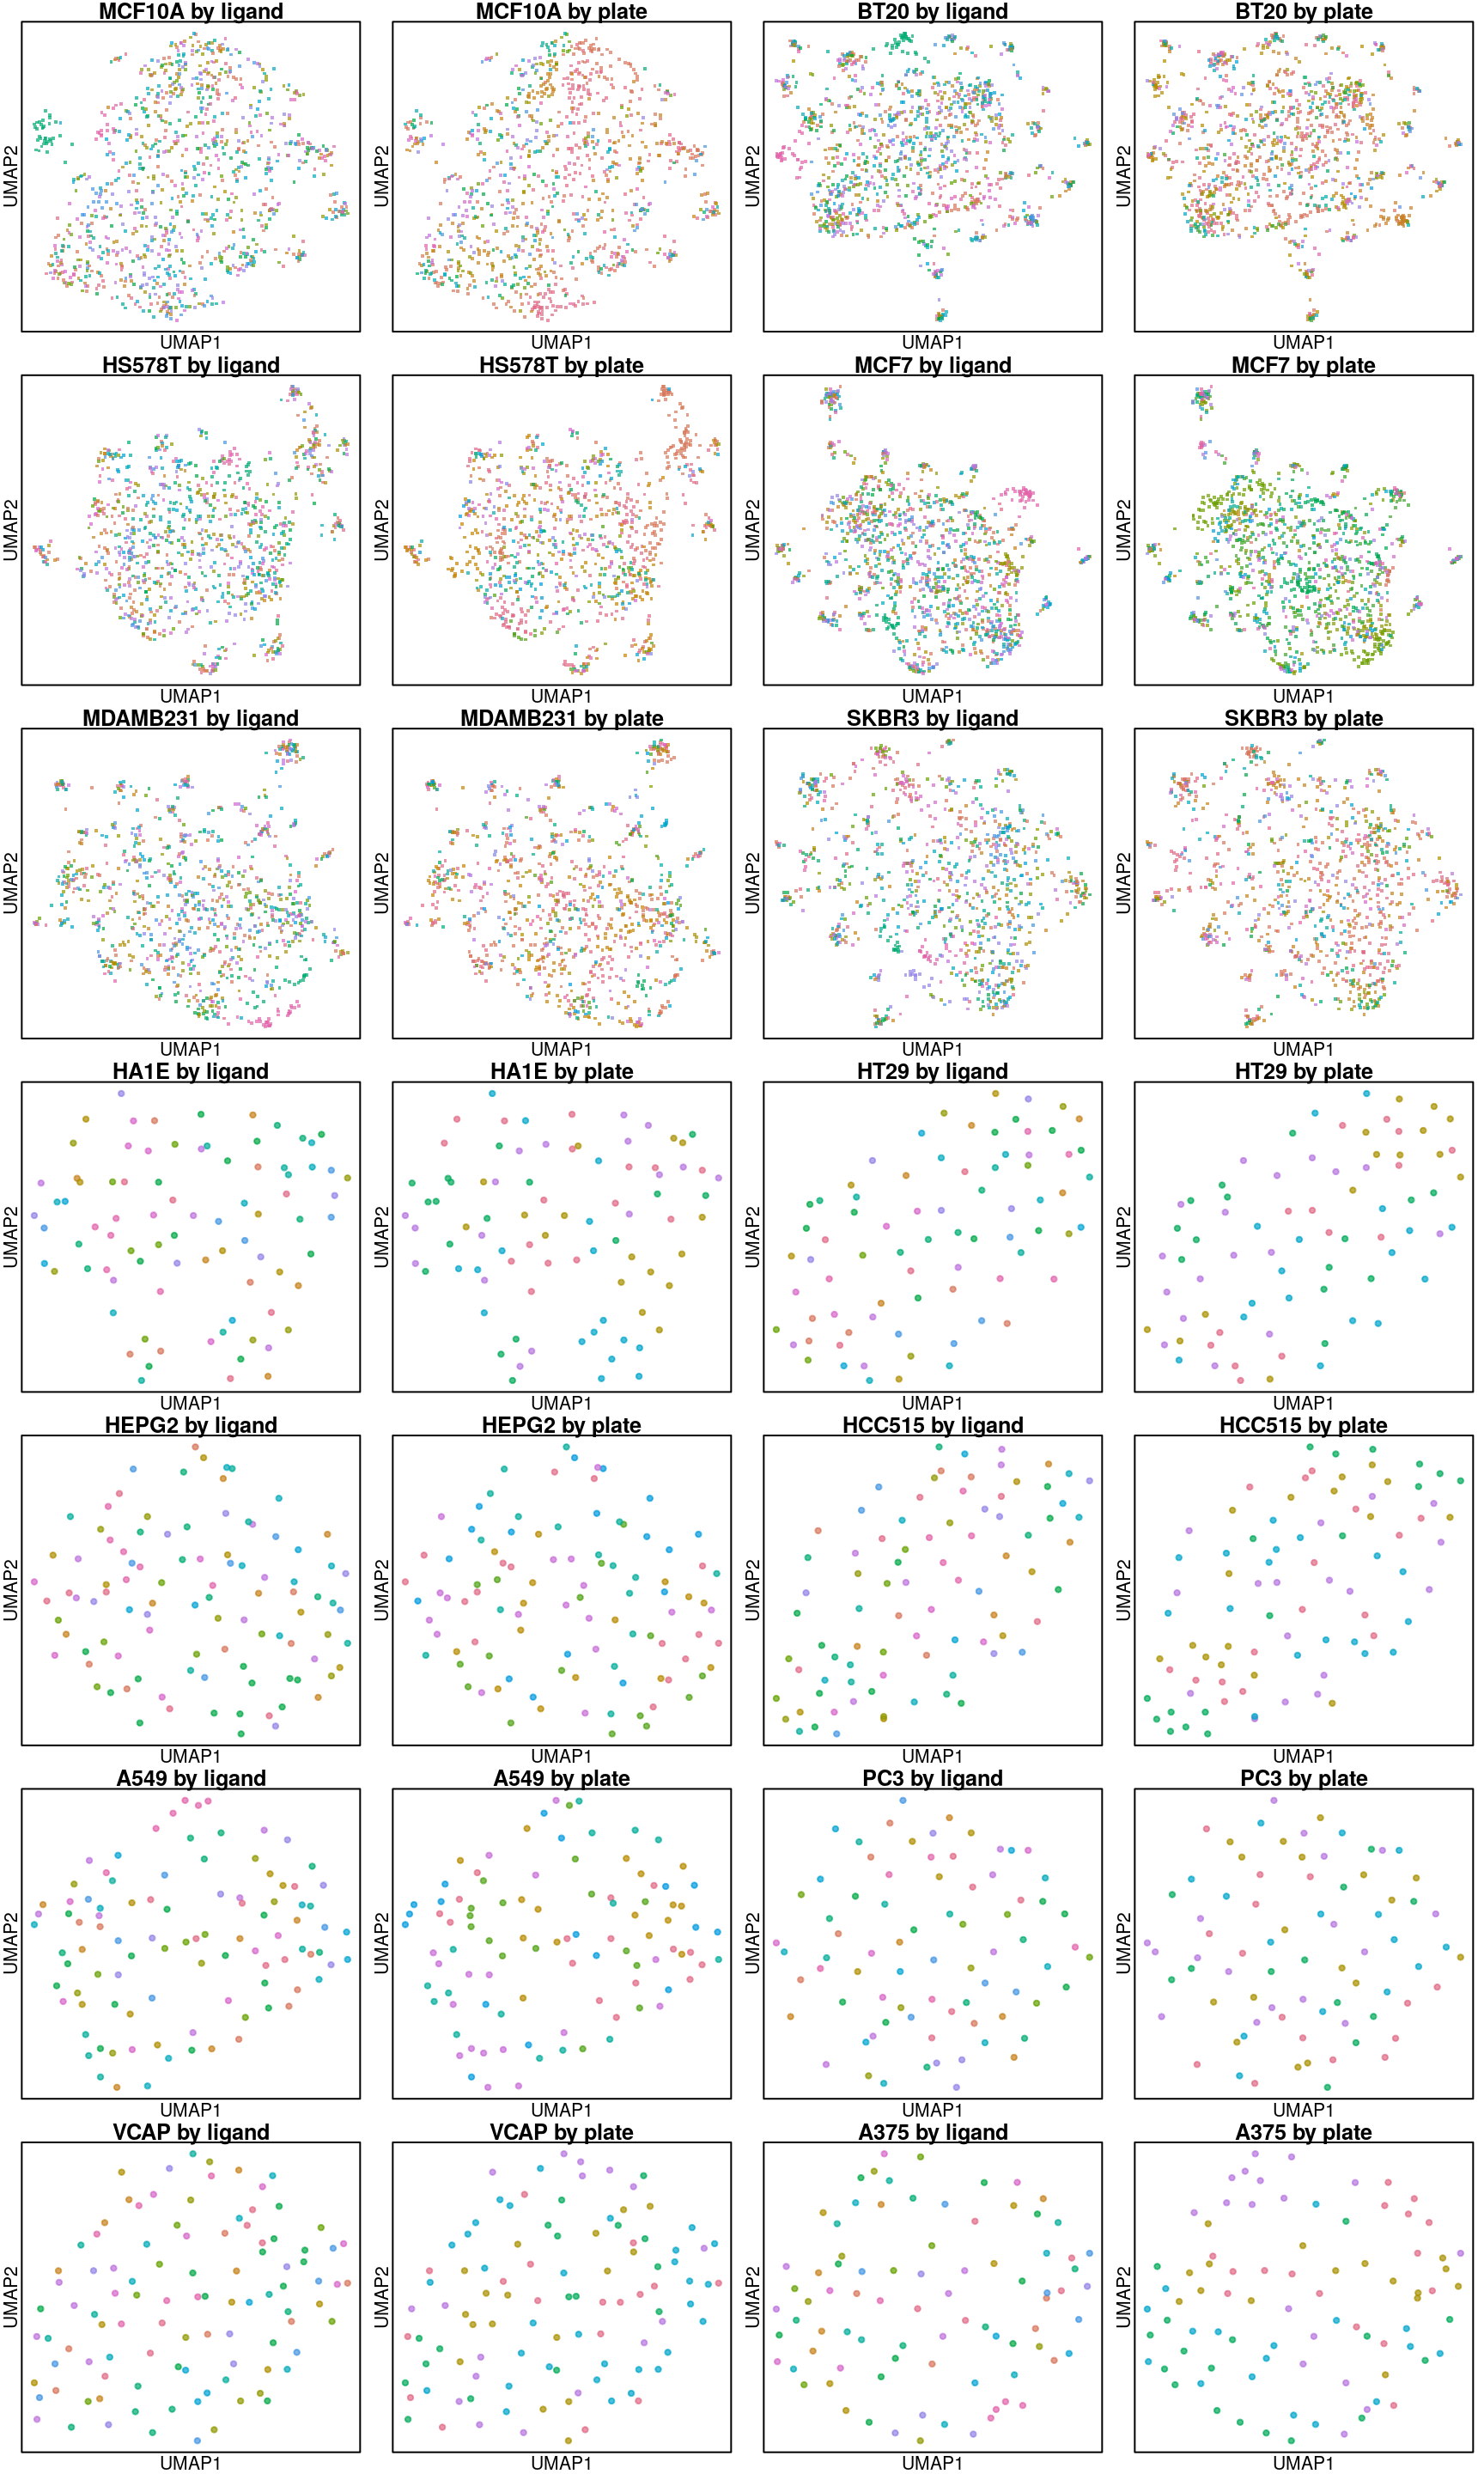
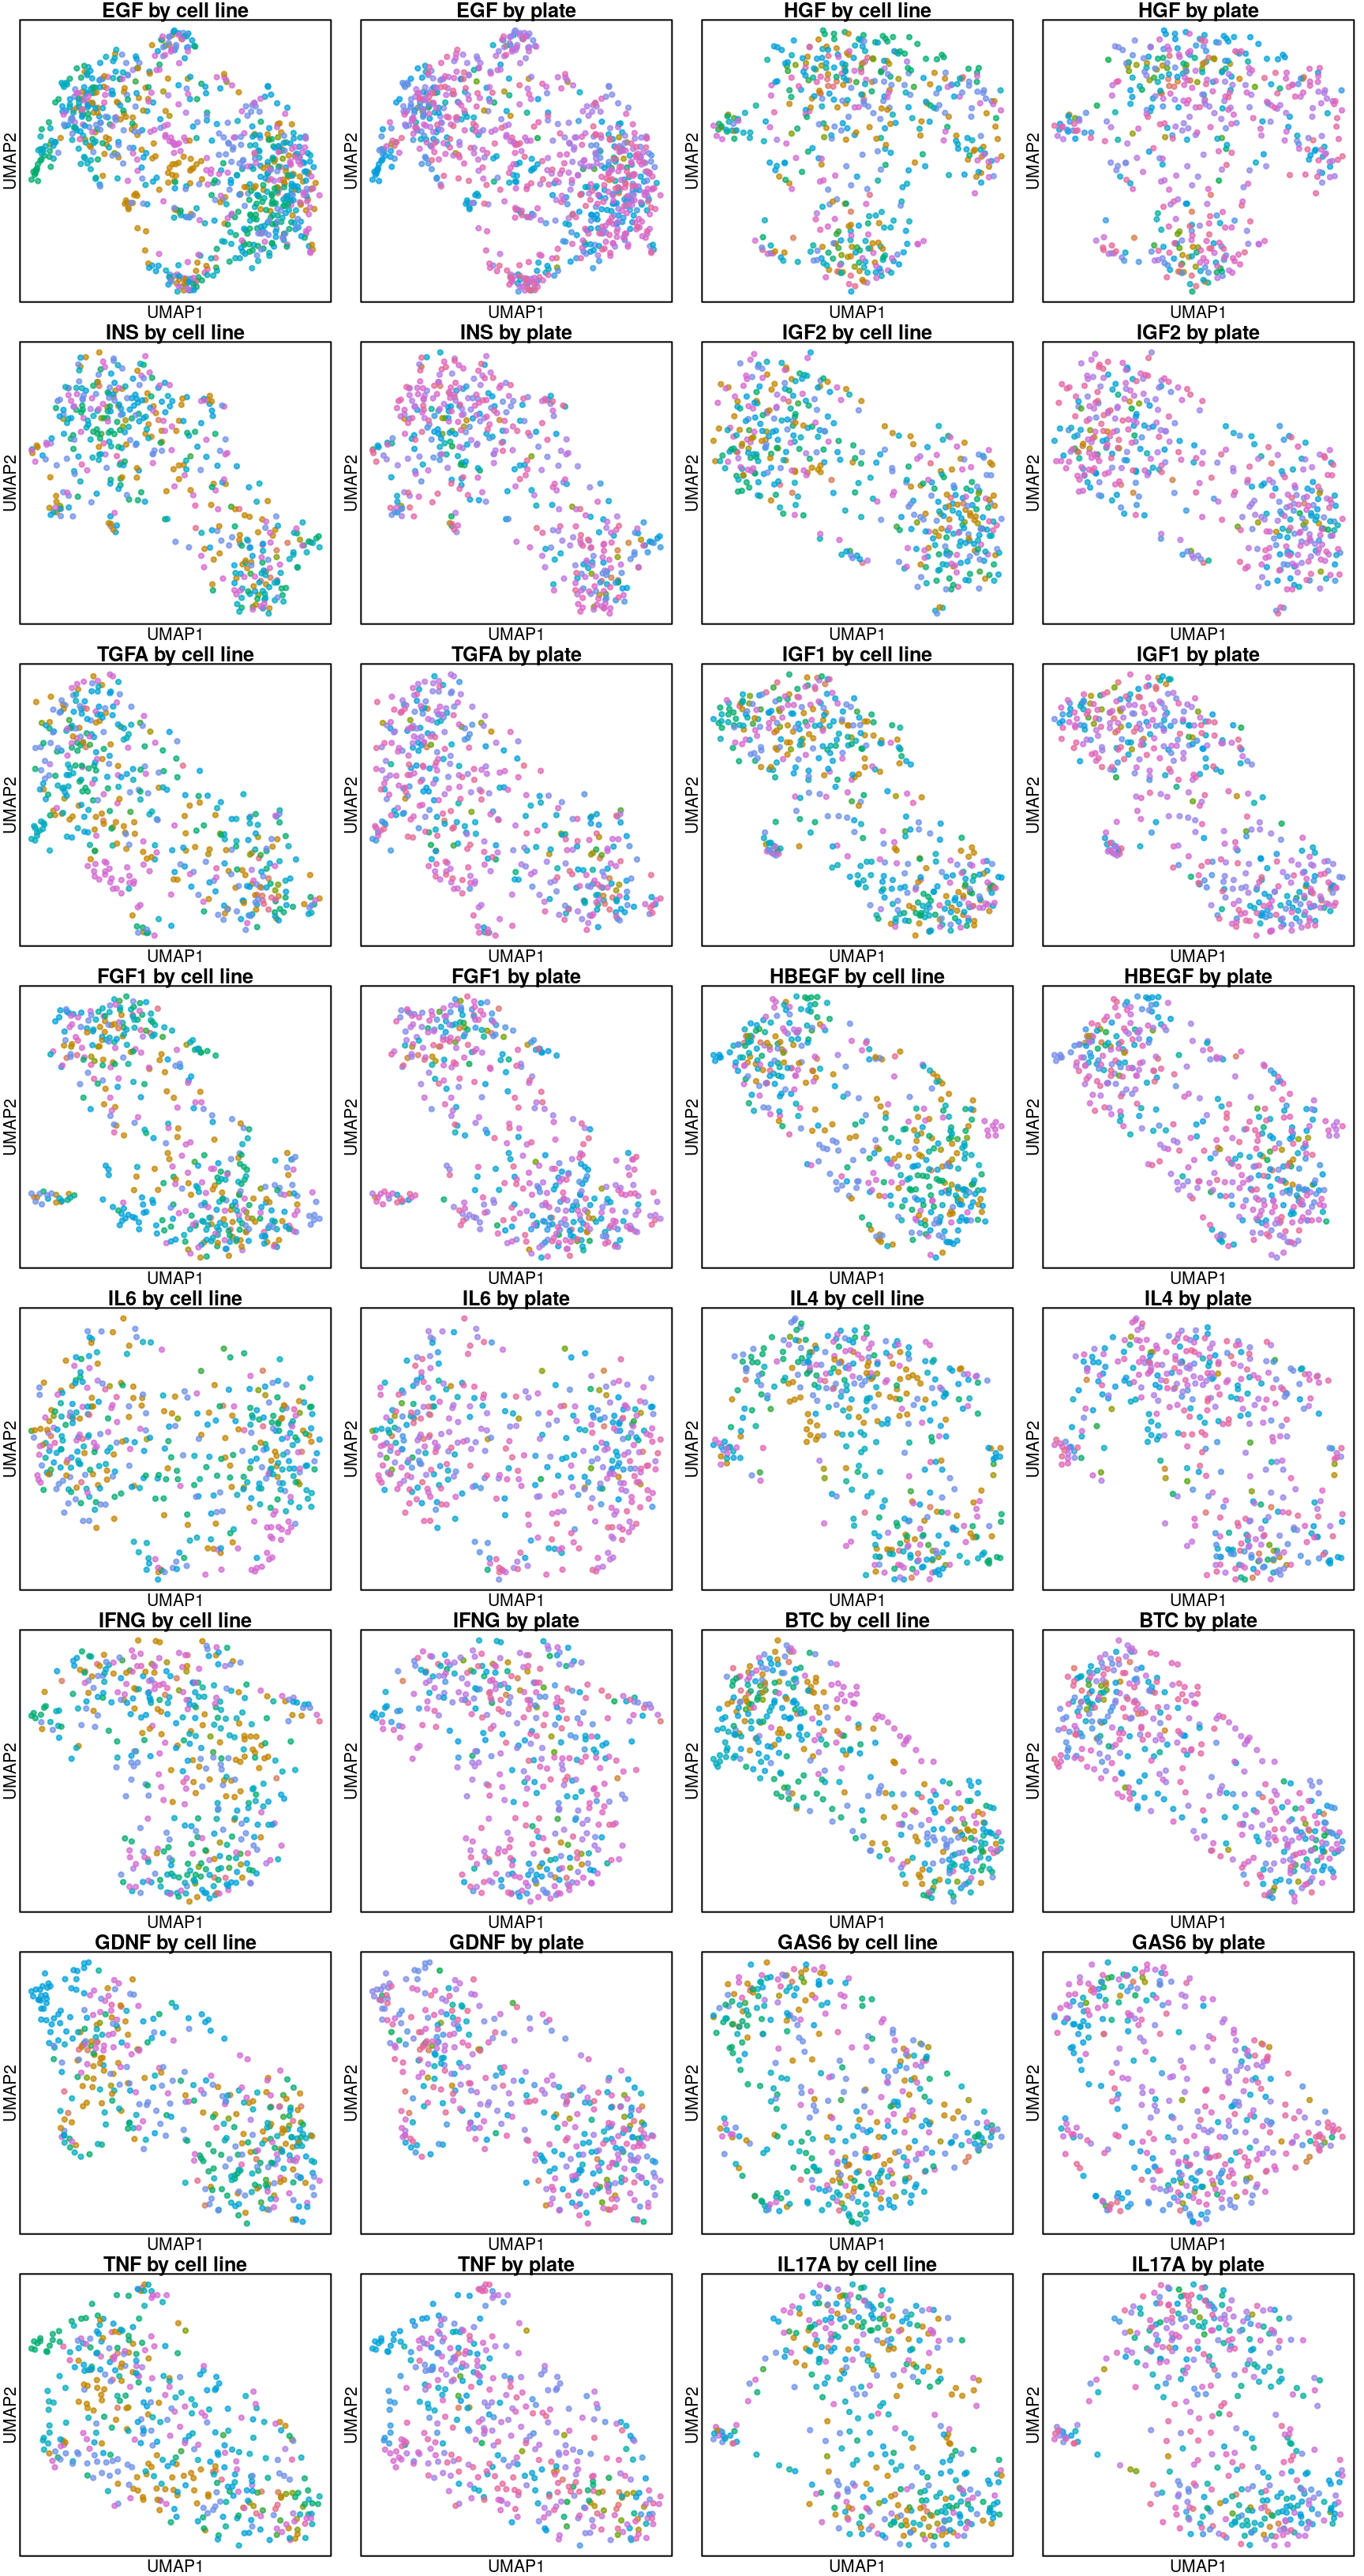
UMAP per cell line
Below are UMAP projections of ligand-treated and control samples for each cell type. Only the 16 ligands assayed in all cell types and their plate-matched controls (coloured in black) are included.
UMAP per ligand treatment
UMAP per cell line
Rerunning these using all genes (including inferred).
UMAP per ligand treatment
Replicate-collapsed robust Z-scores of differences in cell line transcriptomes following ligand treatment (level 5 data)
Ligands / cell lines assayed
In the Connectivity Map data, there are 16 ligands assayed in all 14 cell lines, and 300 ligands assayed in 8 cell lines.
| EGF | HGF | INS | IGF2 | TGFA | IGF1 | FGF1 | HBEGF | IL6 | IL4 | IFNG | BTC | GDNF | GAS6 | TNF | IL17A | |
|---|---|---|---|---|---|---|---|---|---|---|---|---|---|---|---|---|
| breast_normal_MCF10A | 28 | 14 | 14 | 14 | 14 | 14 | 14 | 14 | 14 | 14 | 14 | 14 | 14 | 14 | 14 | 14 |
| breast_tumor_BT20 | 32 | 16 | 16 | 16 | 16 | 16 | 16 | 16 | 16 | 16 | 16 | 16 | 16 | 16 | 16 | 16 |
| breast_tumor_HS578T | 28 | 14 | 14 | 14 | 14 | 14 | 14 | 14 | 14 | 14 | 14 | 14 | 14 | 14 | 14 | 14 |
| breast_tumor_MCF7 | 34 | 19 | 18 | 18 | 18 | 18 | 18 | 18 | 18 | 18 | 18 | 18 | 18 | 18 | 18 | 17 |
| breast_tumor_MDAMB231 | 28 | 14 | 14 | 14 | 14 | 14 | 14 | 14 | 14 | 14 | 14 | 14 | 14 | 14 | 14 | 14 |
| breast_tumor_SKBR3 | 28 | 14 | 14 | 14 | 14 | 14 | 14 | 14 | 14 | 14 | 14 | 14 | 14 | 14 | 14 | 14 |
| kidney_normal_HA1E | 2 | 3 | 2 | 2 | 2 | 2 | 2 | 2 | 2 | 2 | 2 | 2 | 2 | 2 | 2 | 1 |
| large_intestine_tumor_HT29 | 2 | 3 | 2 | 2 | 2 | 2 | 2 | 2 | 2 | 2 | 2 | 2 | 2 | 2 | 2 | 1 |
| liver_tumor_HEPG2 | 2 | 3 | 2 | 2 | 2 | 2 | 2 | 2 | 2 | 2 | 2 | 2 | 2 | 2 | 2 | 1 |
| lung_normal_HCC515 | 2 | 3 | 2 | 2 | 2 | 2 | 2 | 2 | 2 | 2 | 2 | 2 | 2 | 2 | 2 | 1 |
| lung_tumor_A549 | 2 | 3 | 2 | 2 | 2 | 2 | 2 | 2 | 2 | 2 | 2 | 2 | 2 | 2 | 2 | 1 |
| prostate_tumor_PC3 | 2 | 4 | 2 | 2 | 2 | 2 | 2 | 2 | 2 | 2 | 2 | 2 | 2 | 2 | 2 | 2 |
| prostate_tumor_VCAP | 3 | 5 | 3 | 3 | 3 | 3 | 3 | 3 | 3 | 3 | 3 | 3 | 3 | 3 | 3 | 2 |
| skin_tumor_A375 | 2 | 3 | 2 | 2 | 2 | 2 | 2 | 2 | 2 | 2 | 2 | 2 | 2 | 2 | 2 | 1 |
| Totals | 195 | 118 | 107 | 107 | 107 | 107 | 107 | 107 | 107 | 107 | 107 | 107 | 107 | 107 | 107 | 99 |
In a subset of cell lines, ligands were tested over a variety of doses and times (and EGF was especially rigorously assayed), while in most cell lines ligands were tested at a single concentration over two time points. Note that these data (level 5) are replicate-aggregated Z-scores, so each reported assay represents multiple replicates.
Overall UMAP
Above are UMAP projections (from assayed genes) of all Connectivity Map ligand-treated and control data coloured by cell type.
UMAP per cell line
Below are UMAP projections of ligand-treated and control samples for each cell type. Only the 16 ligands assayed in all cell types and their plate-matched controls (coloured in black) are included.
UMAP per ligand treatment