Fig4
##
## Wilcoxon signed rank test with continuity correction
##
## data: as.vector(ALL_aupr_new) and as.vector(ALL_aupr_all)
## V = 4056, p-value < 2.2e-16
## alternative hypothesis: true location shift is not equal to 0
## 95 percent confidence interval:
## -0.02064542 -0.00932169
## sample estimates:
## (pseudo)median
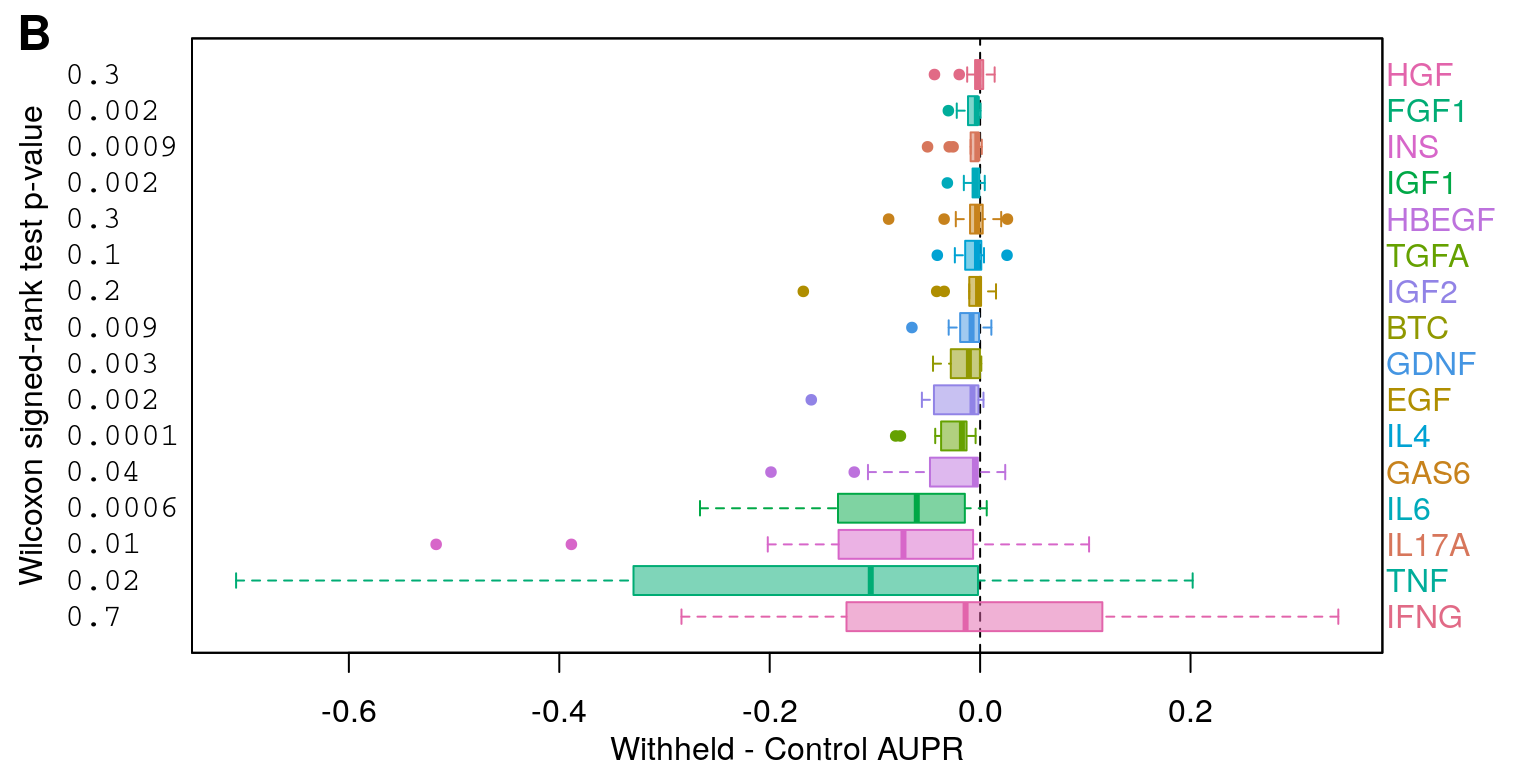
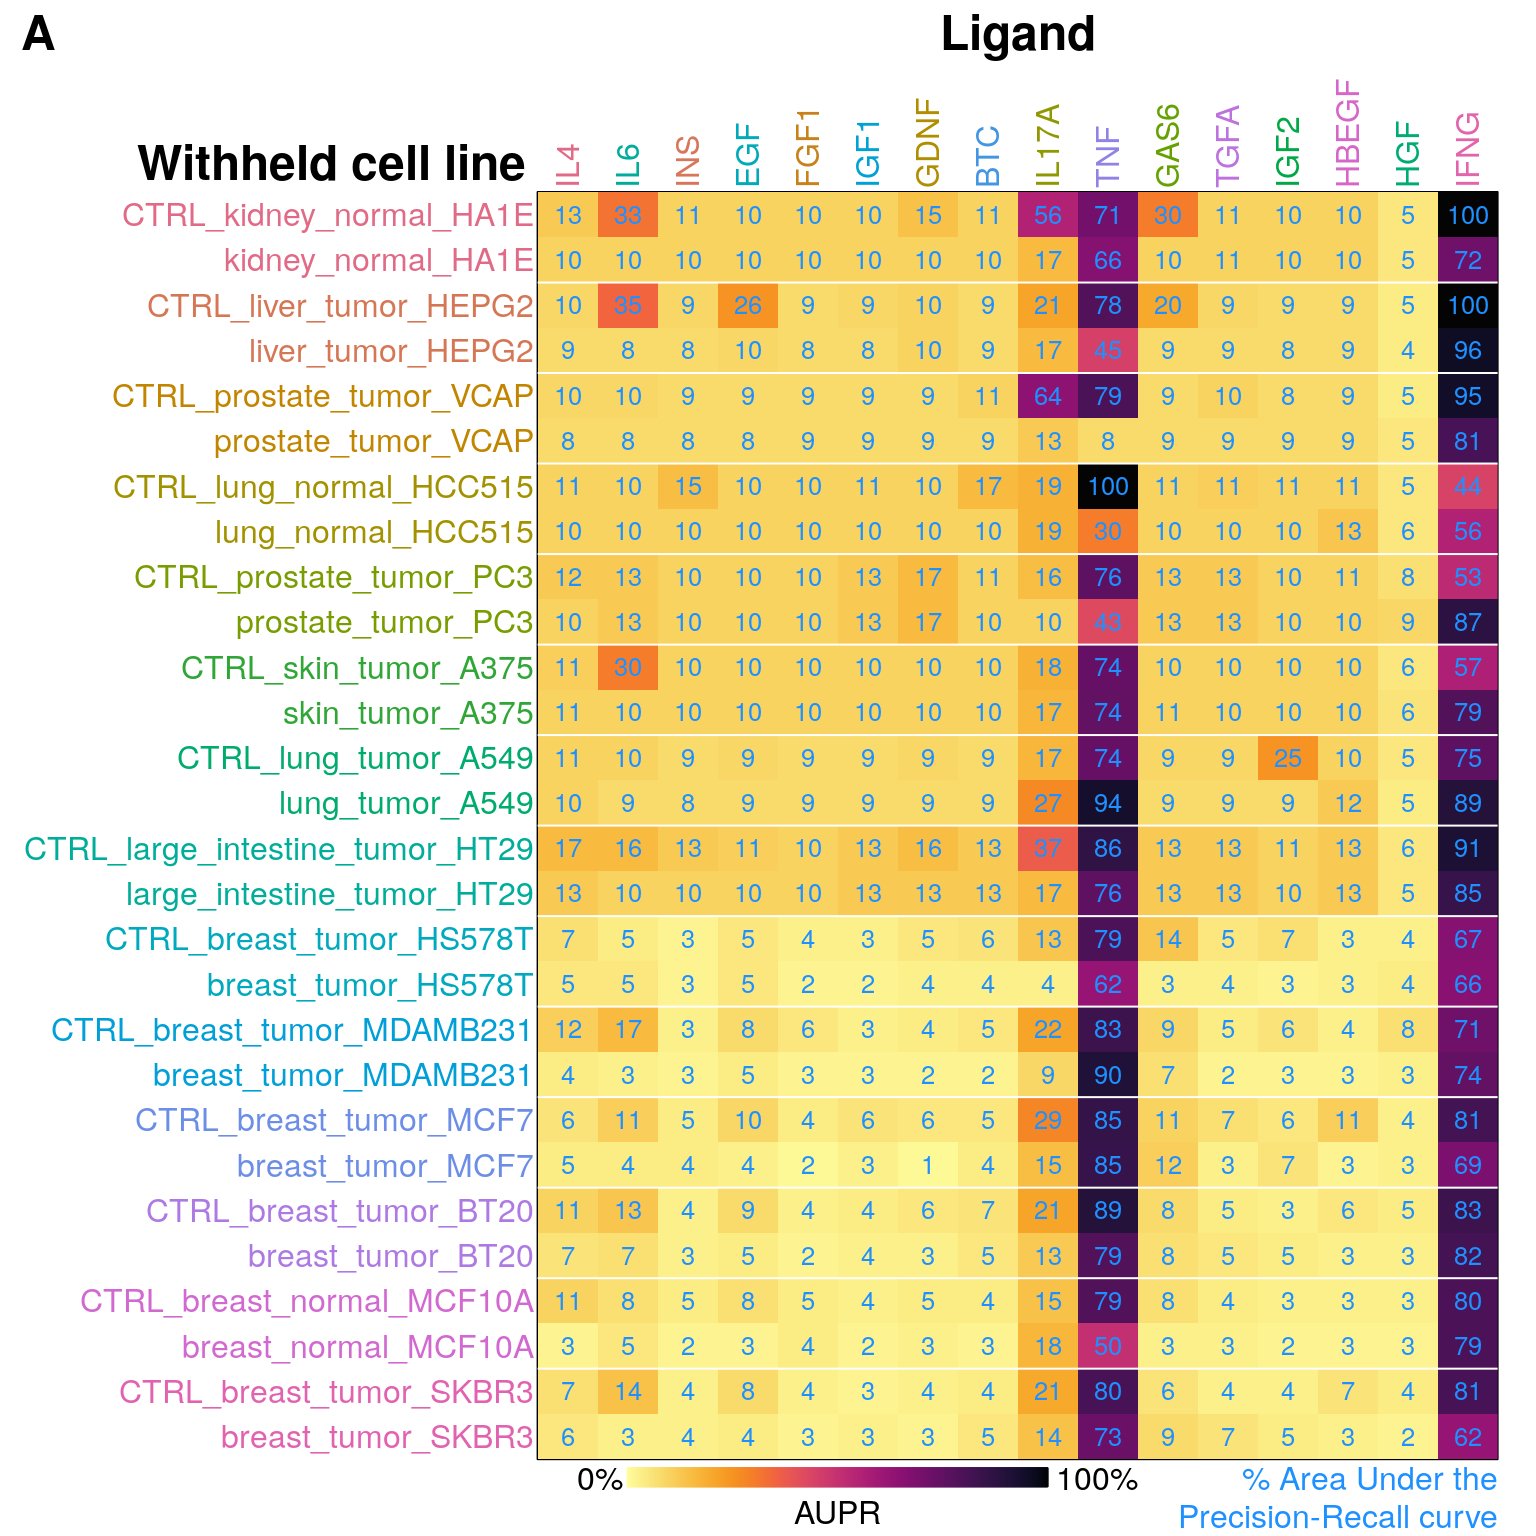
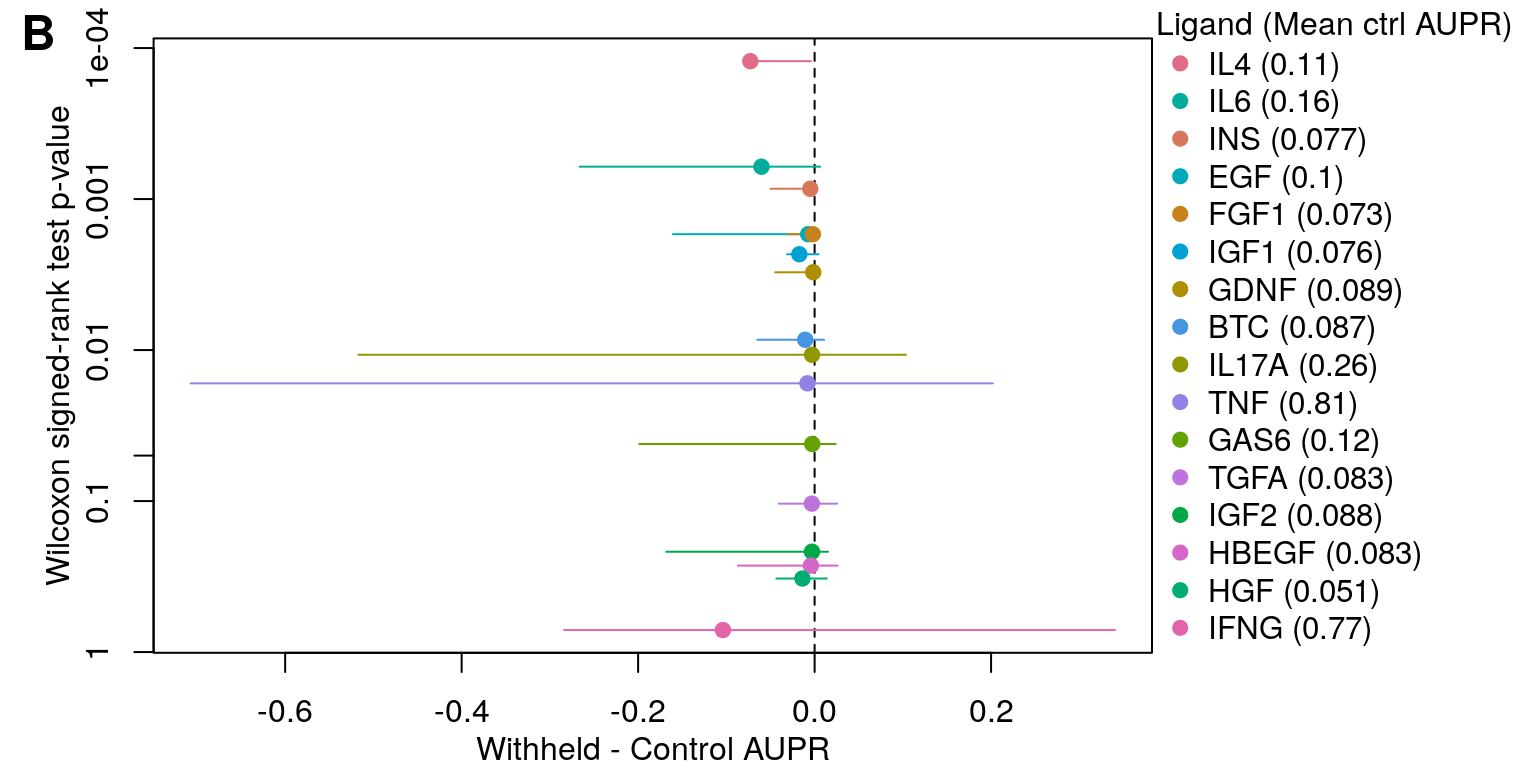
## -0.01419736## [1] "Mean AUPR of control: 0.19"## [1] "Mean AUPR of withheld: 0.16"## [1] "Median pairwise change in AUPR in withheld cell lines relative to control was -0.014 (p = 1.4e-18 by Wilcoxon signed-rank test)."Version 2
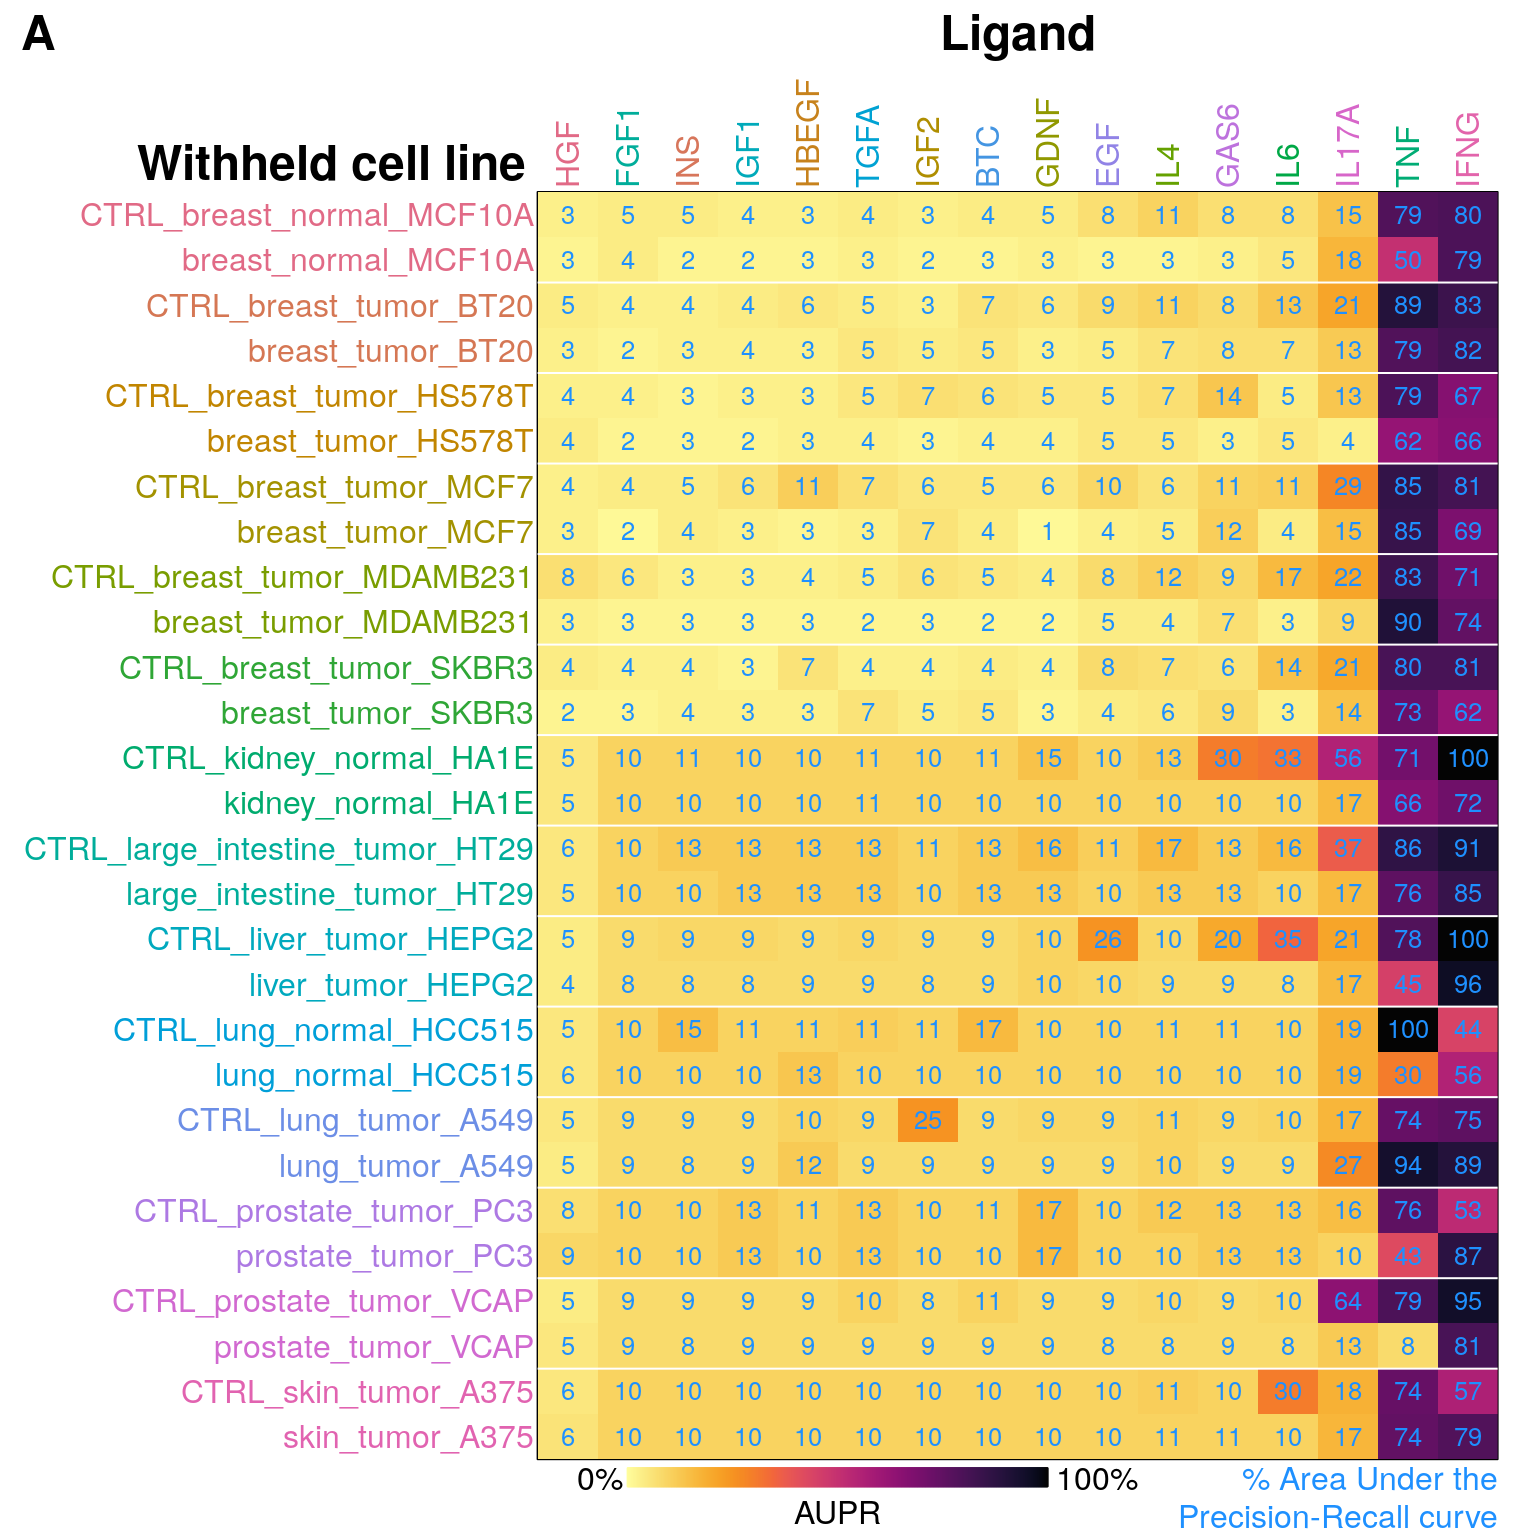
Fig4b could be simply boxplots showing withheld - control AUPR sorted by mean AUPR (and columns of A sorted the same to improve pattern recognition), with *** indicating p-values?