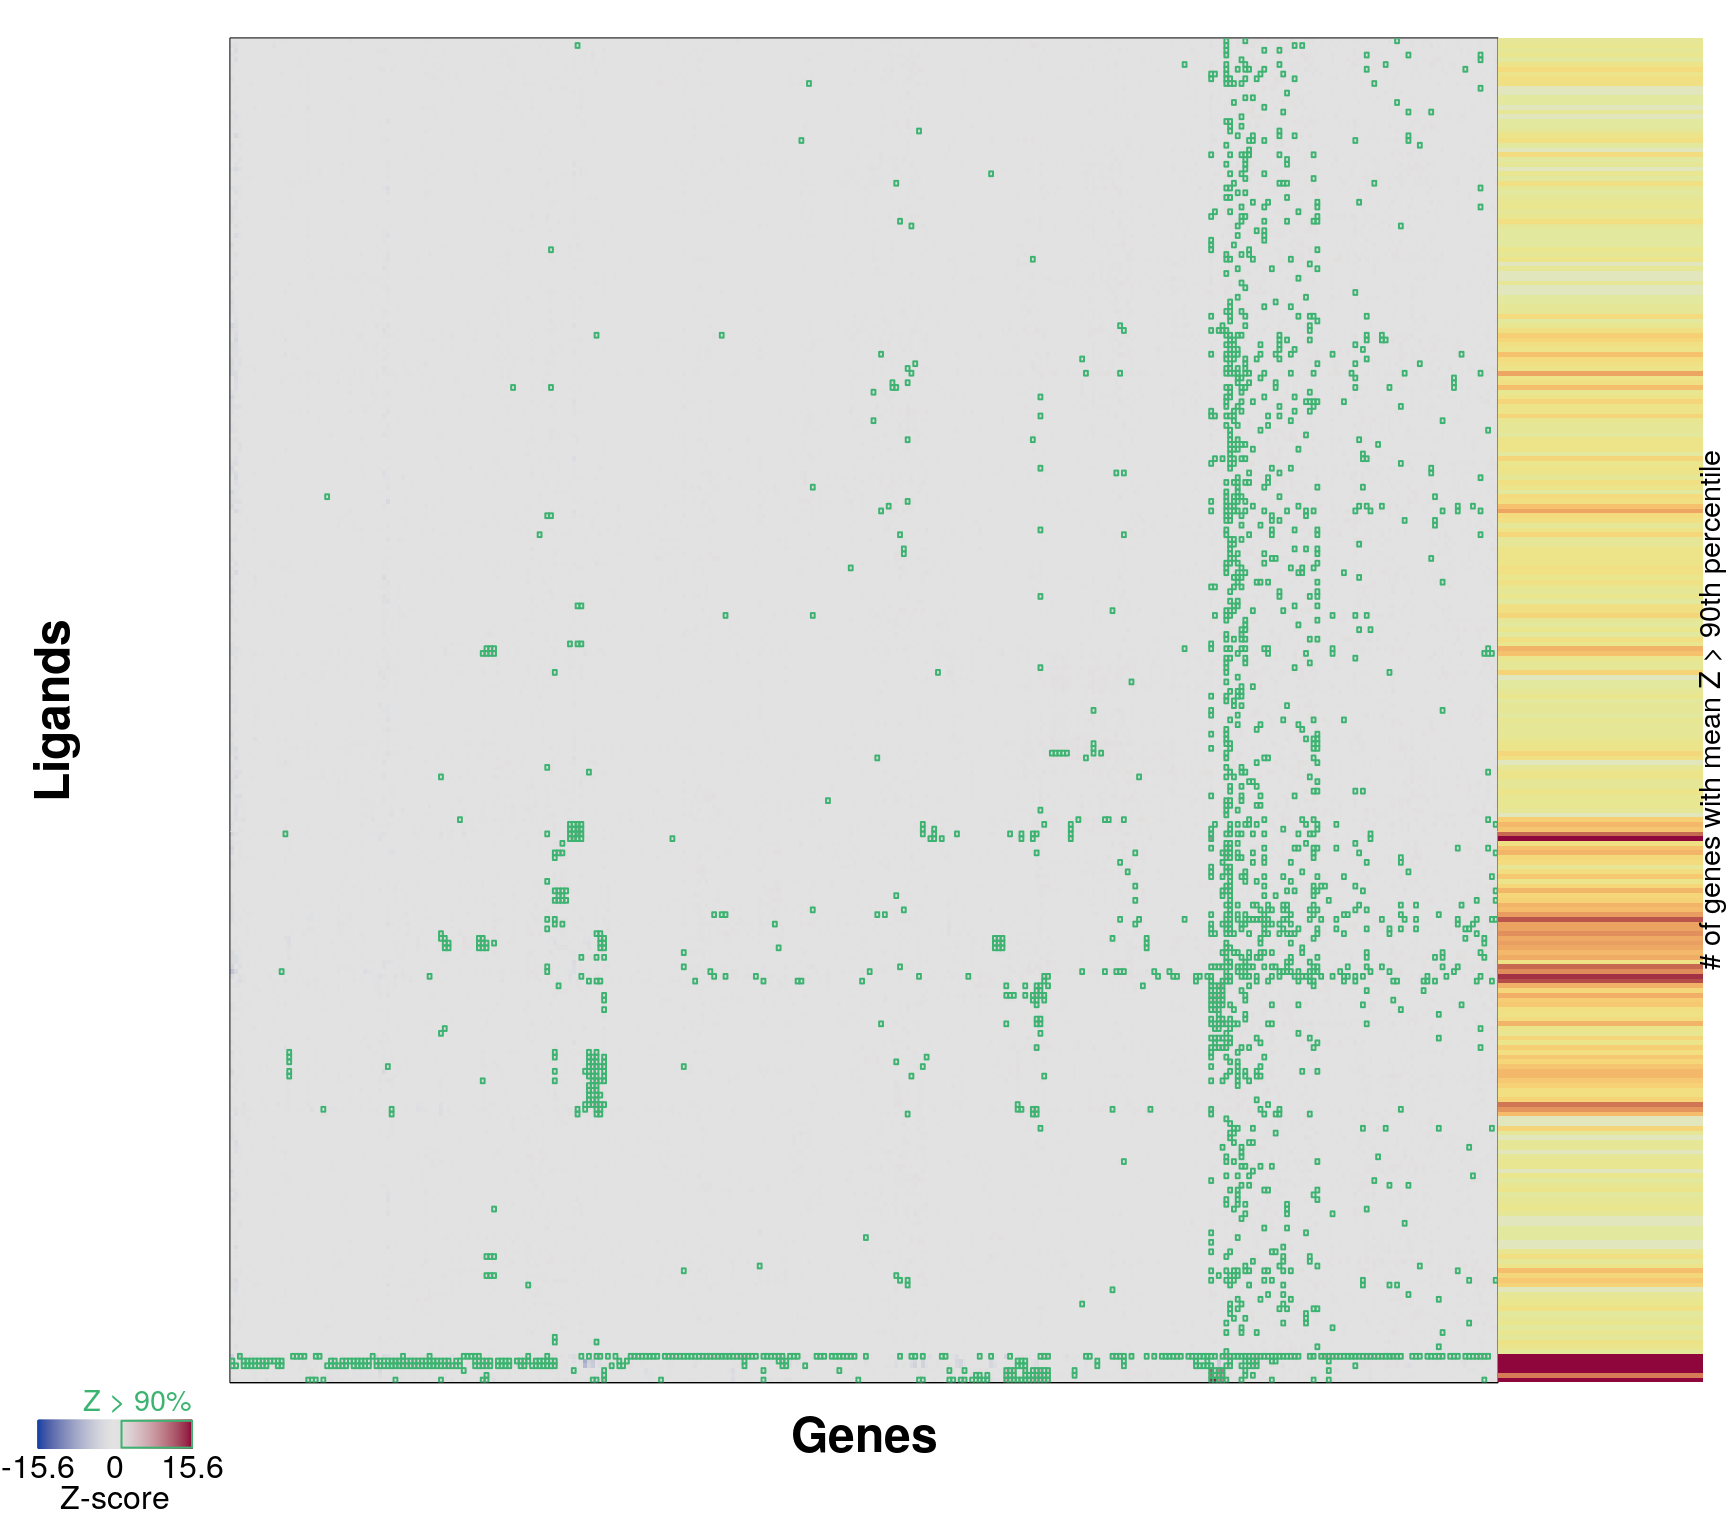
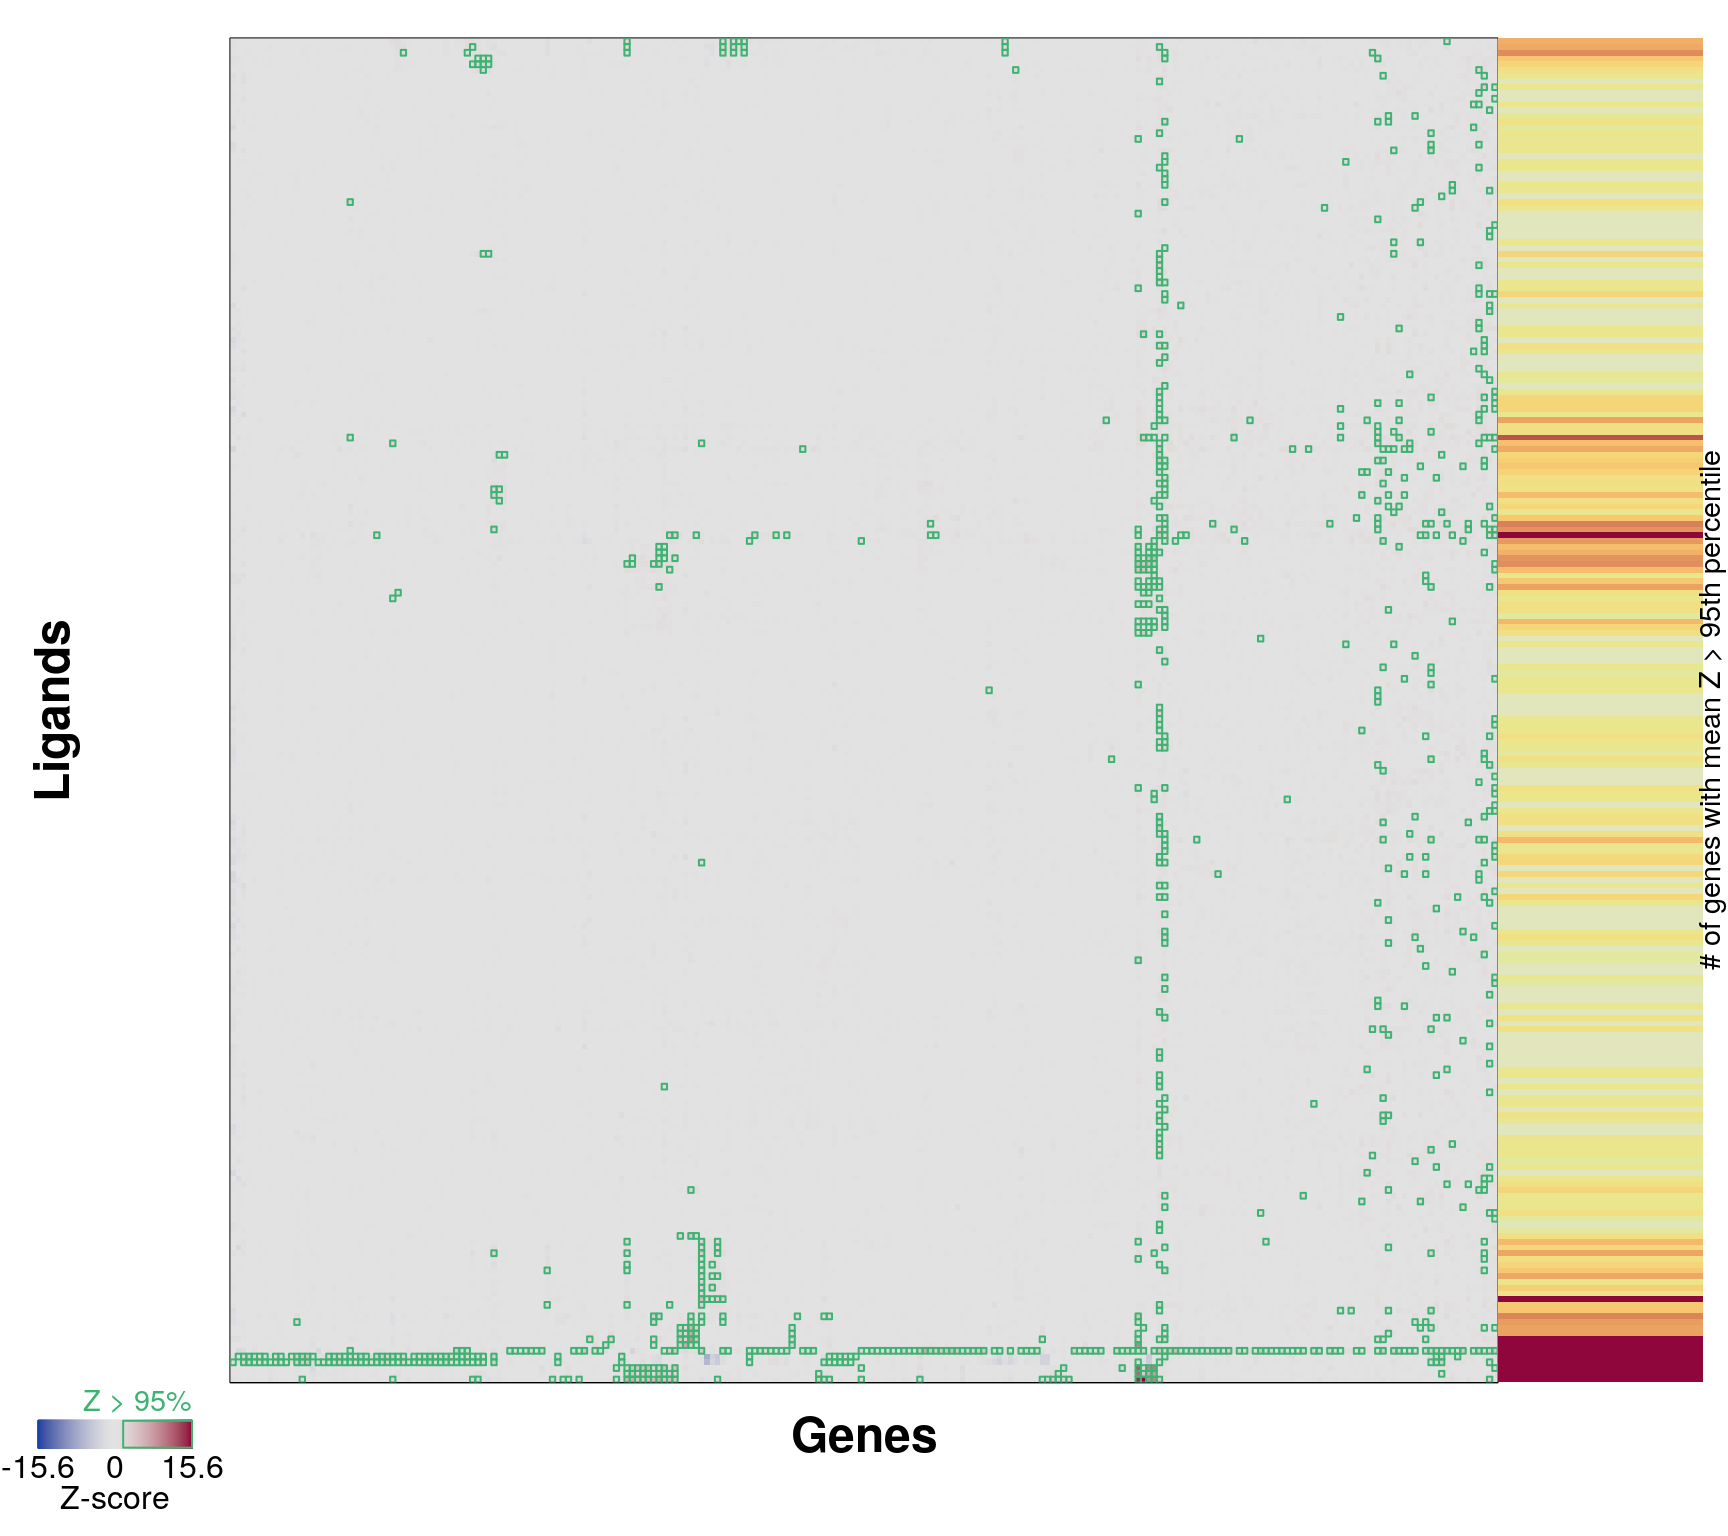
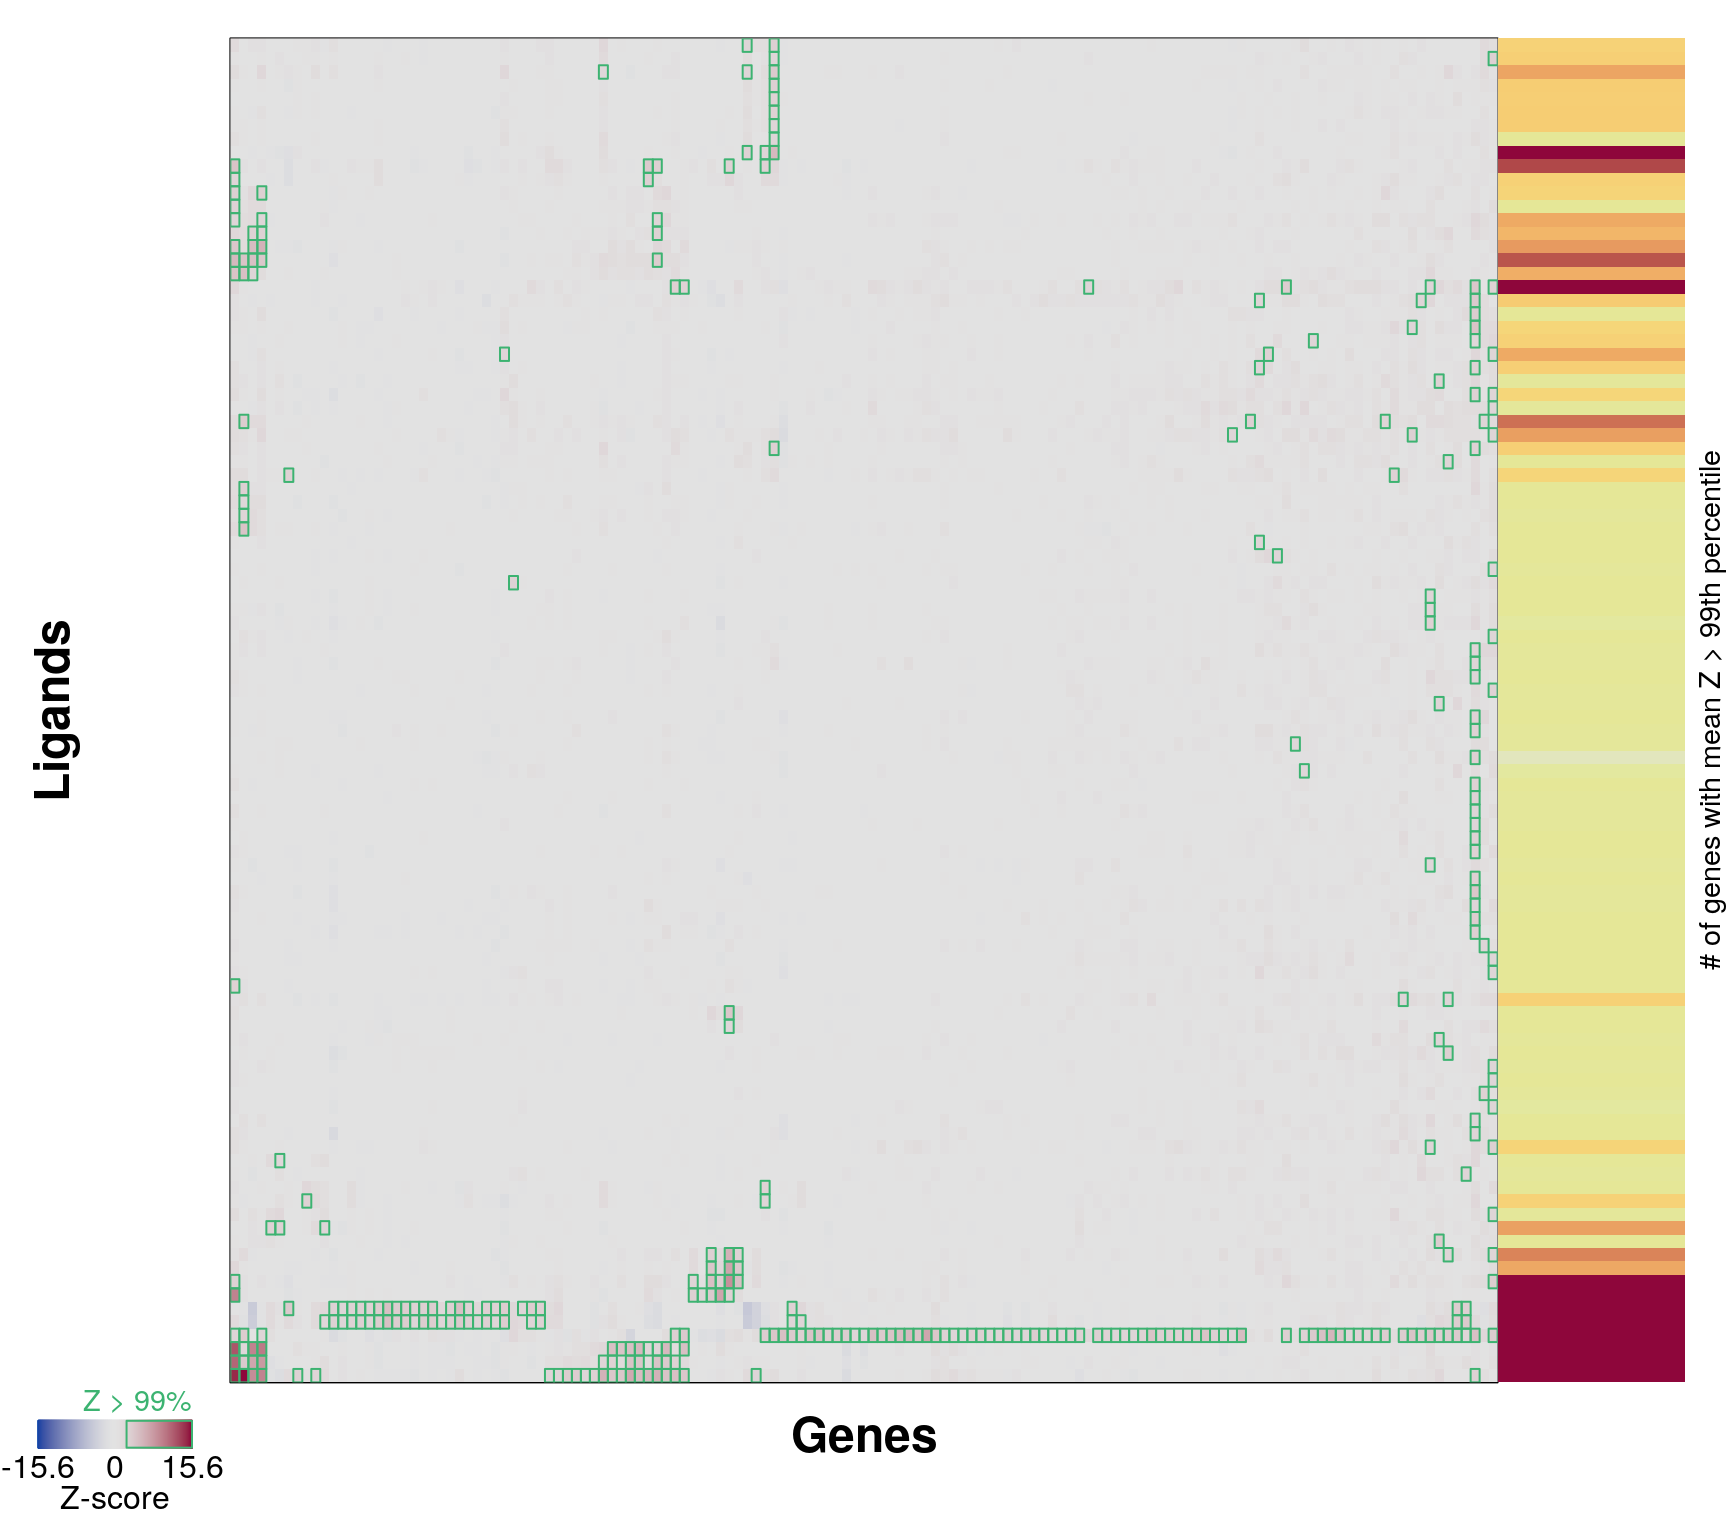
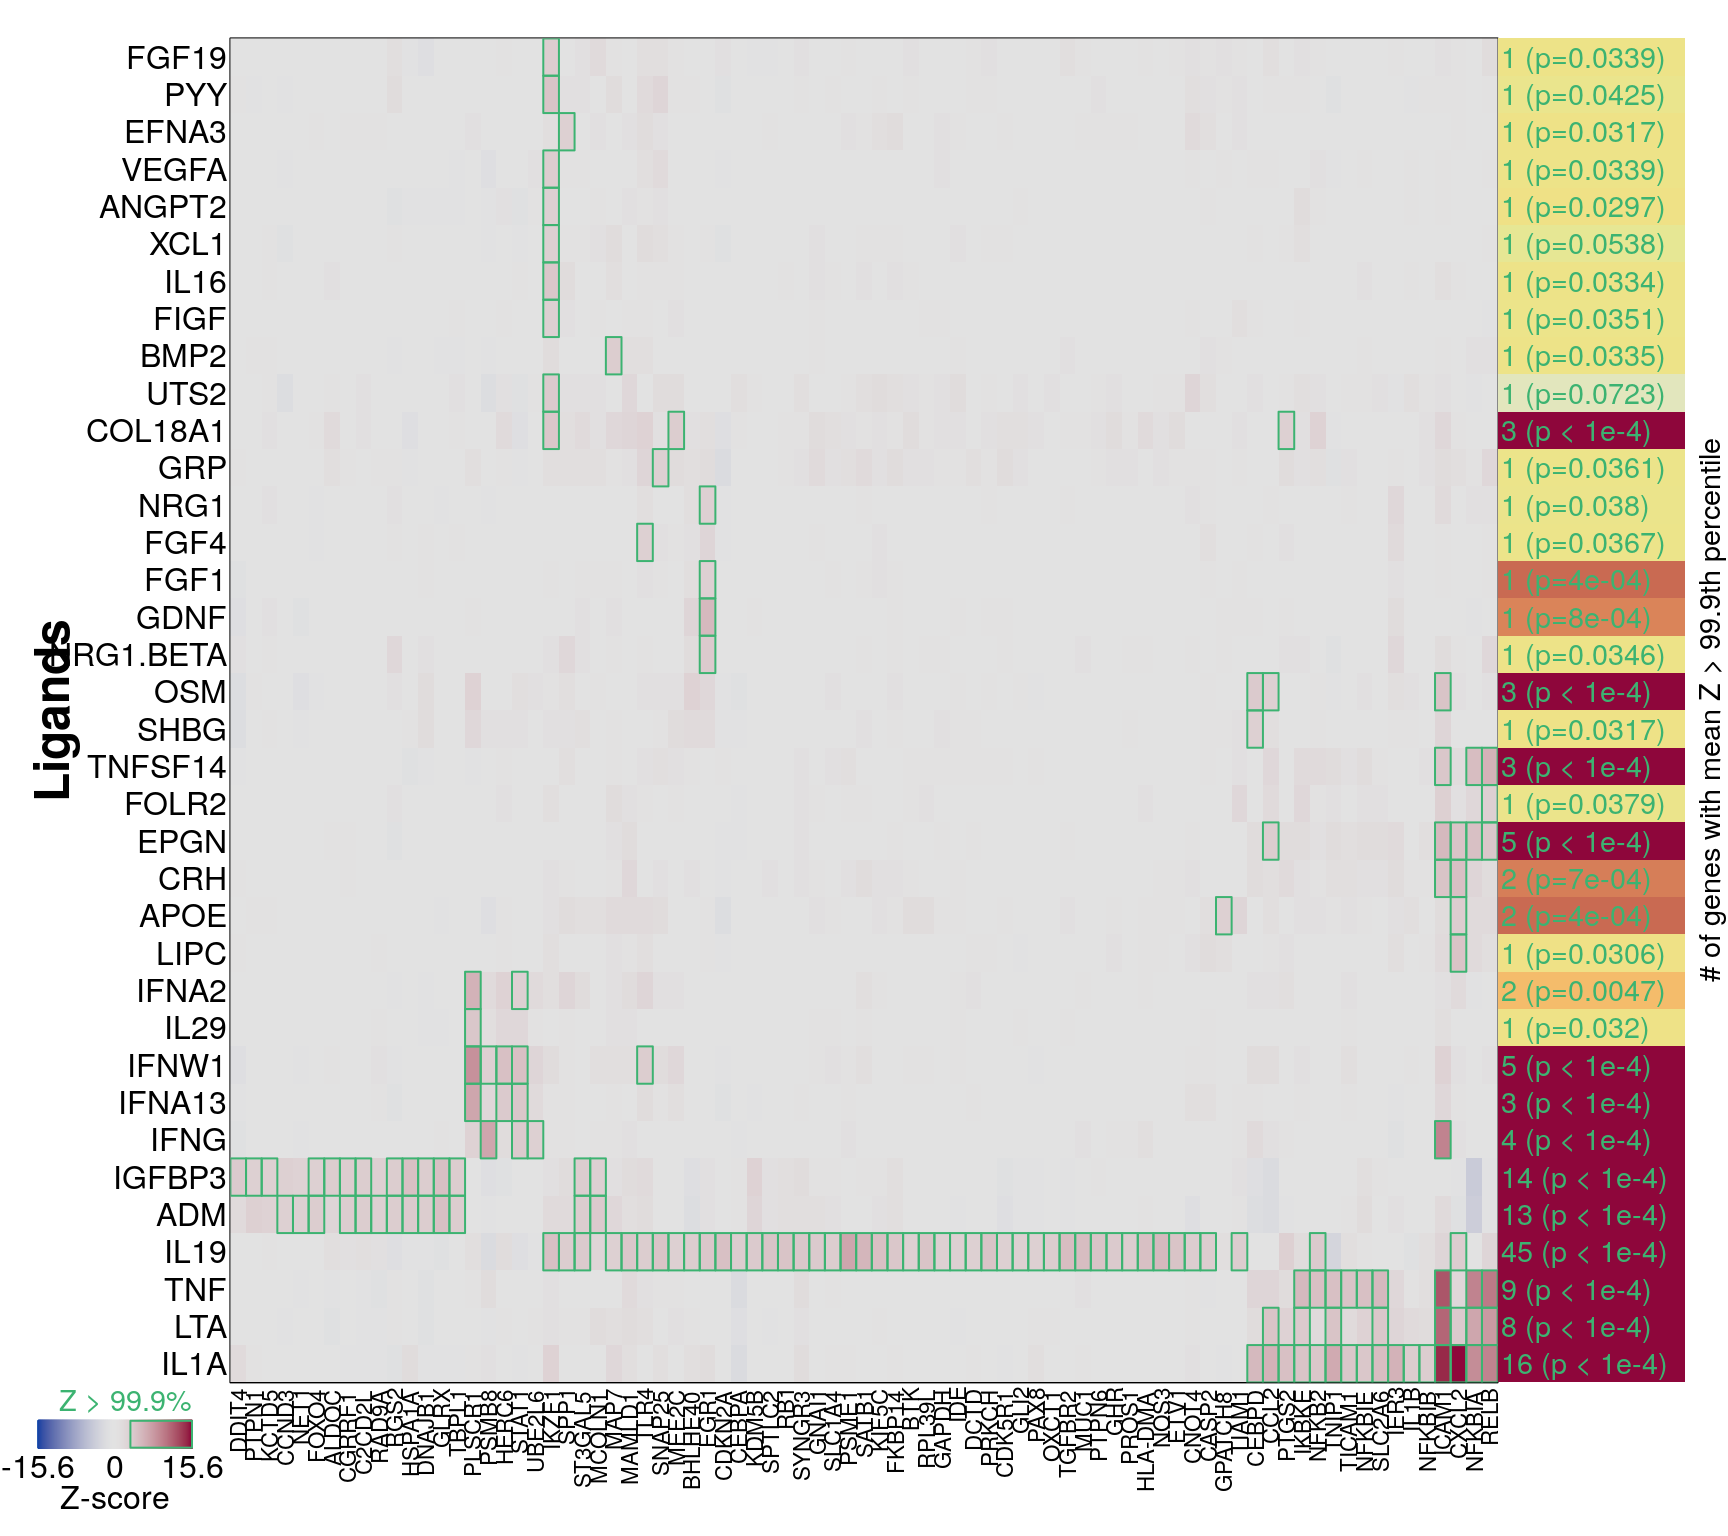
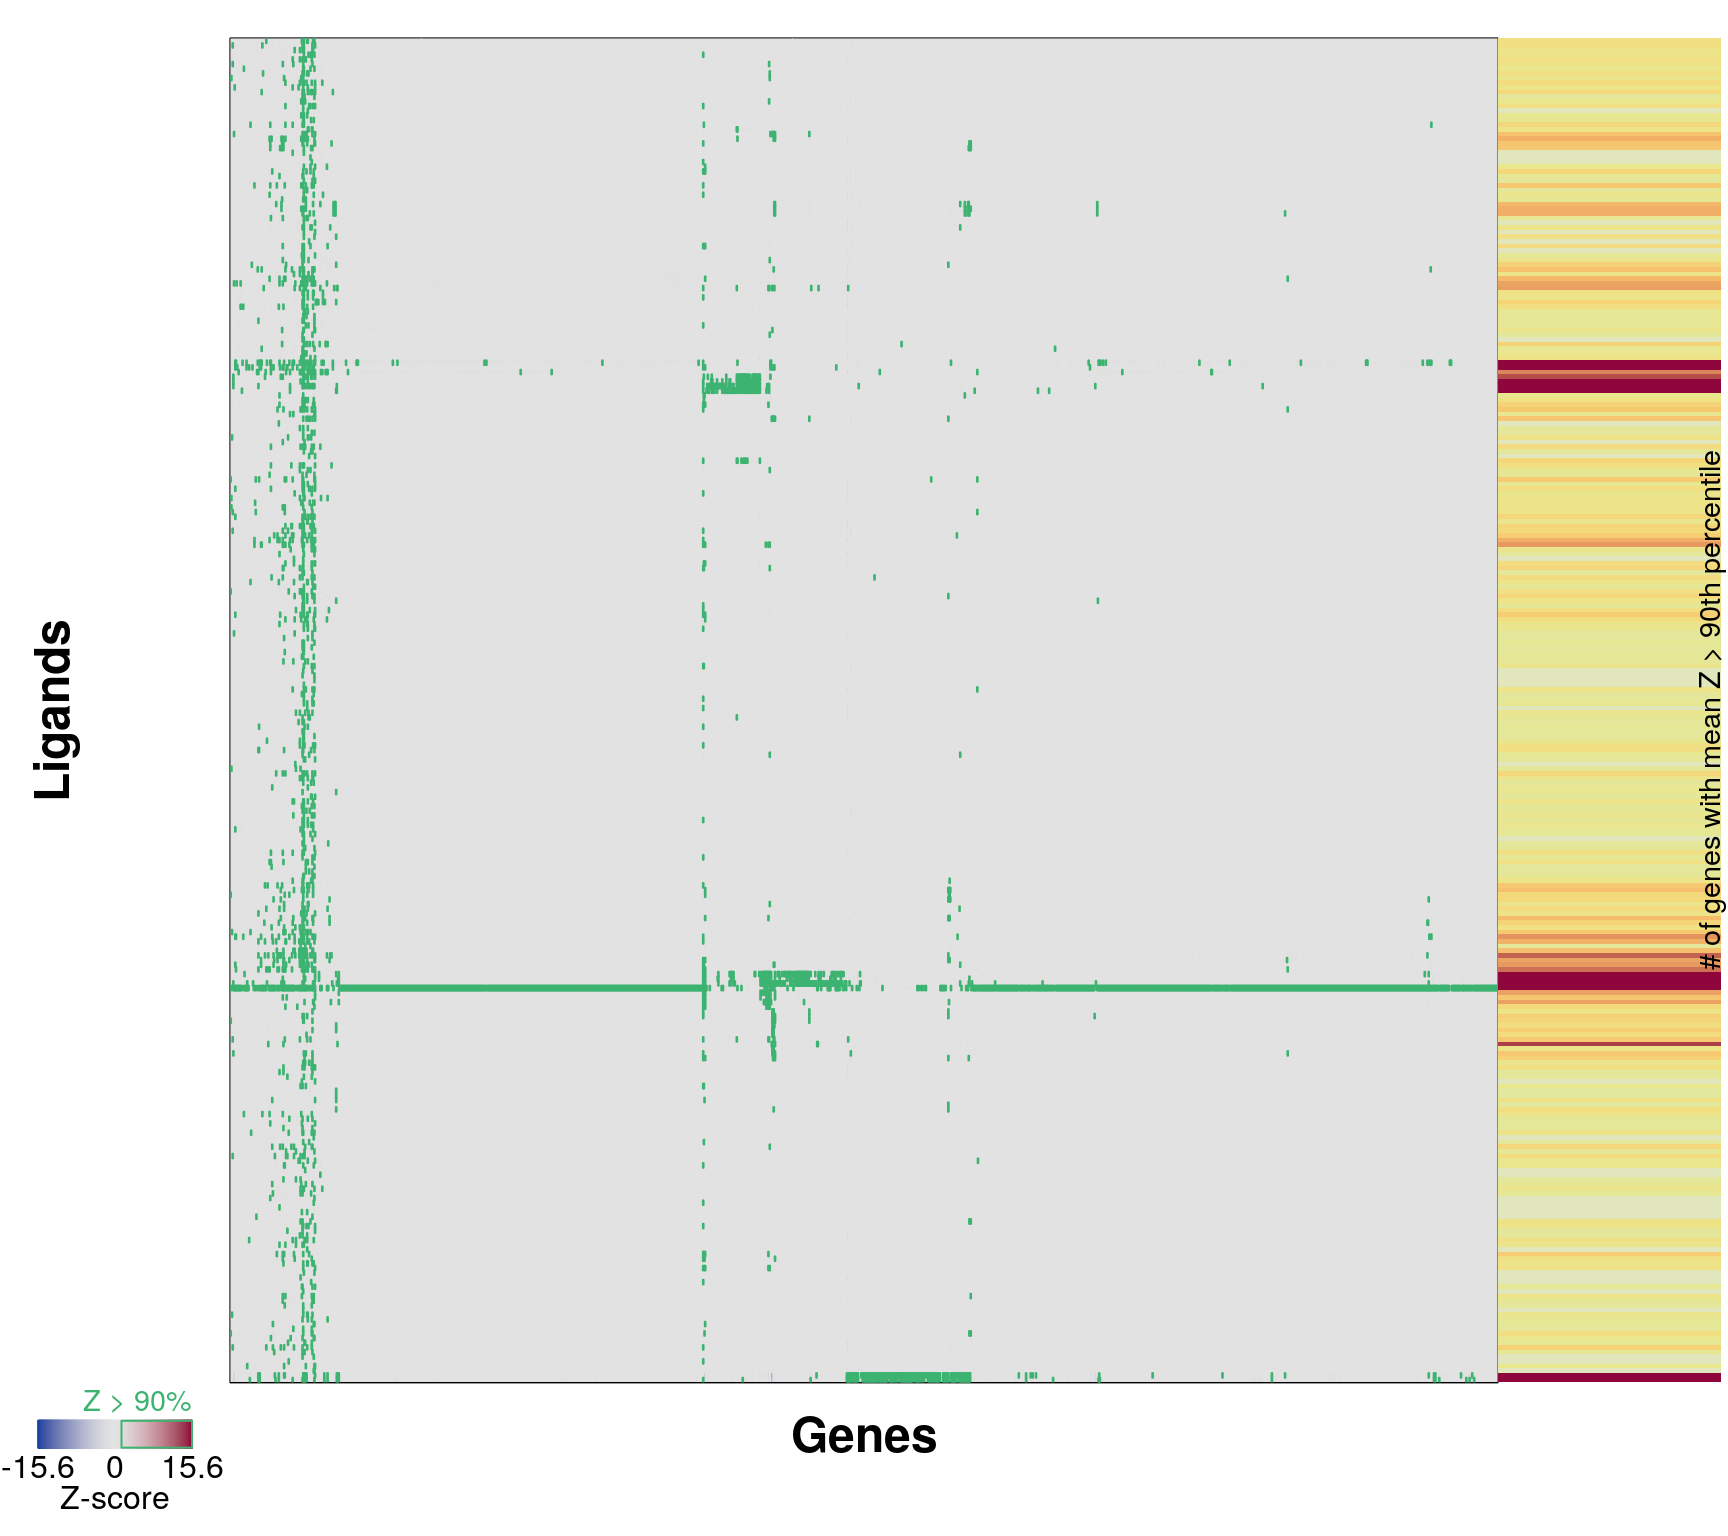
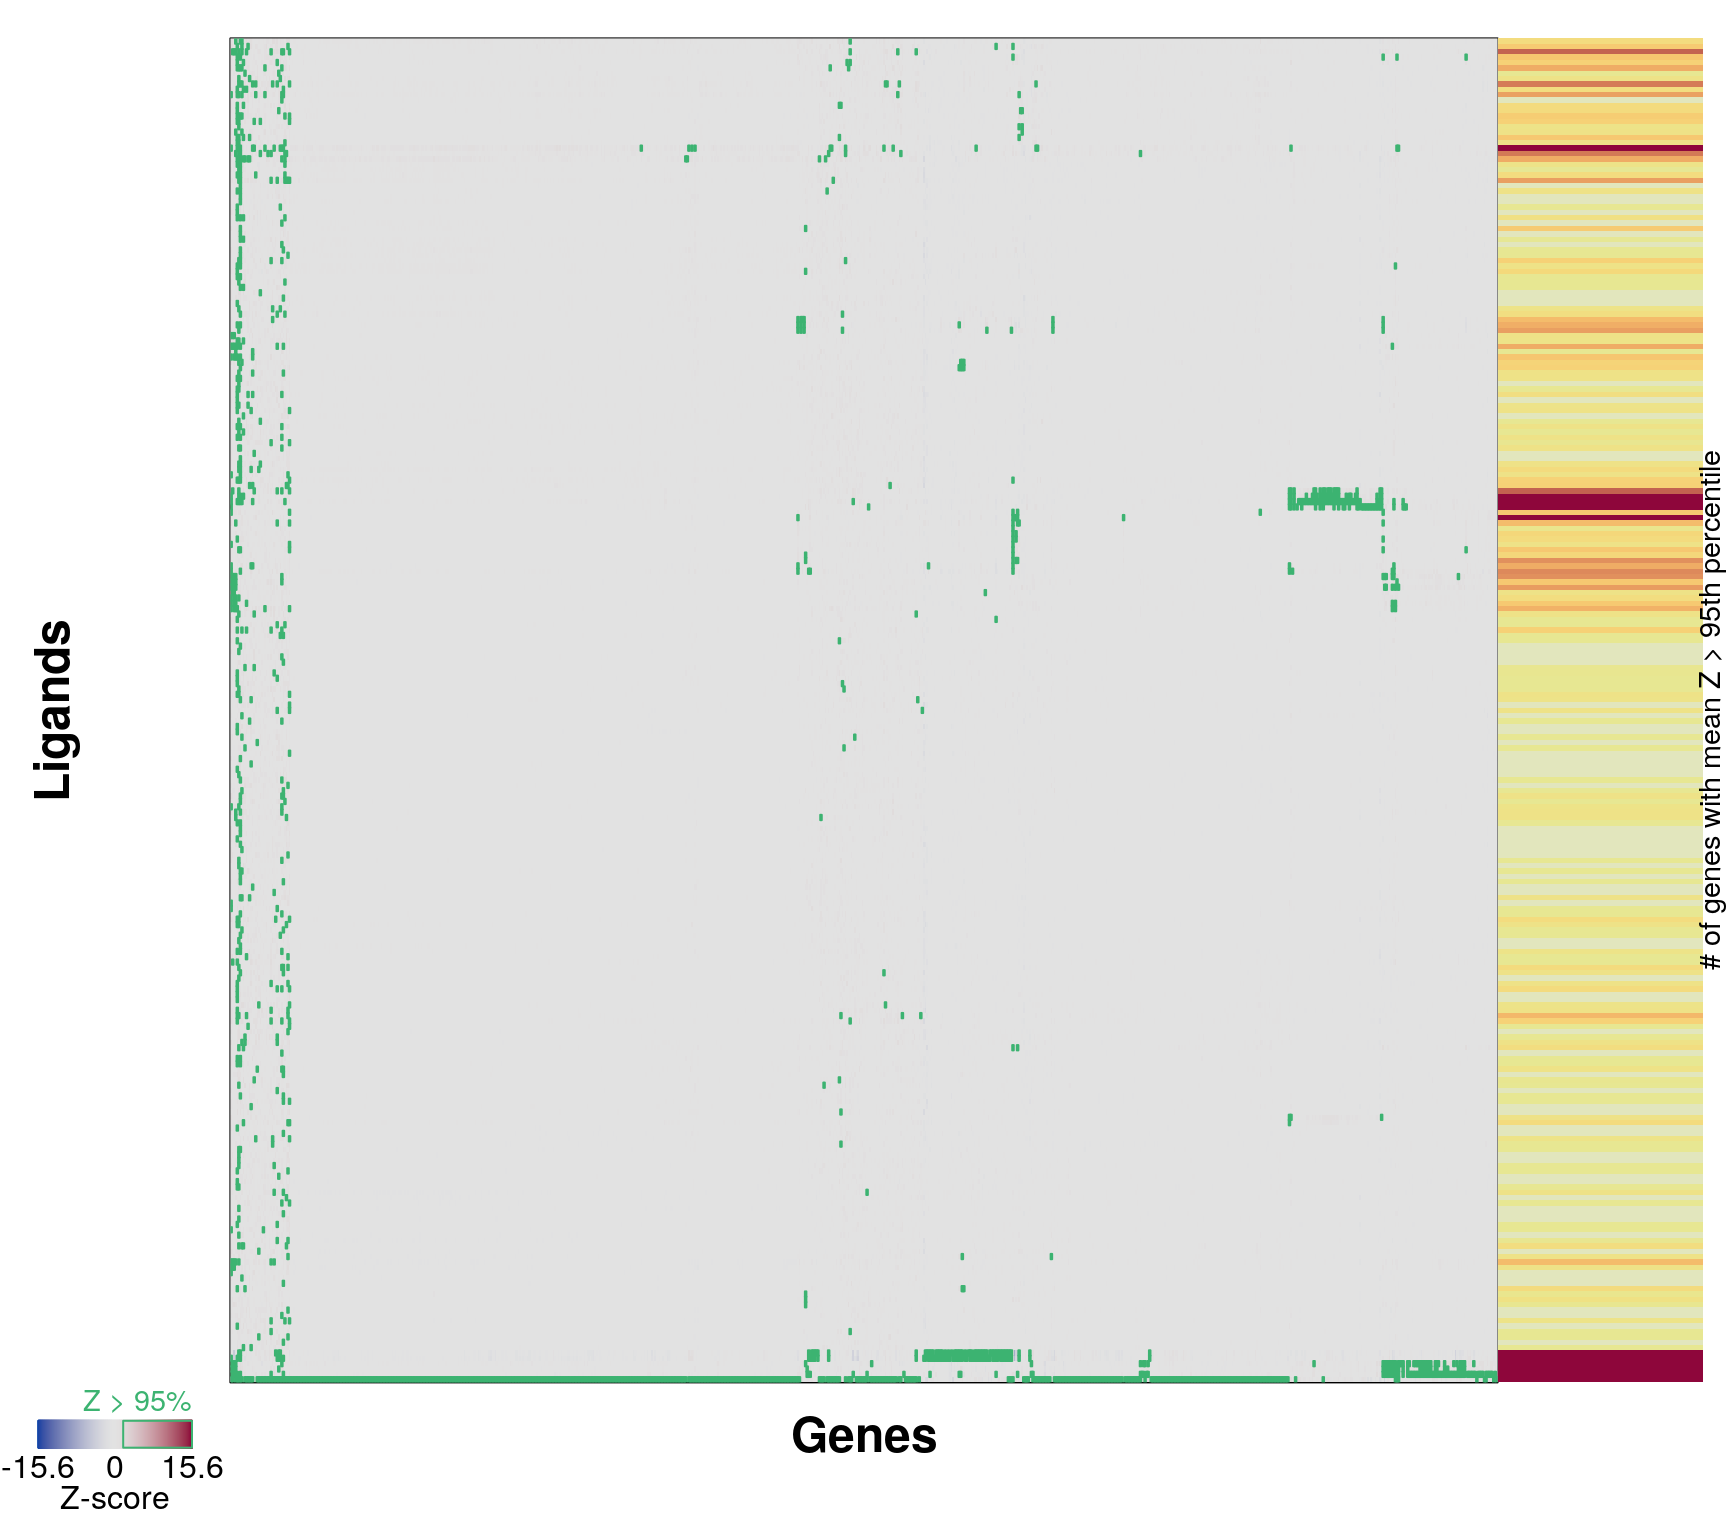
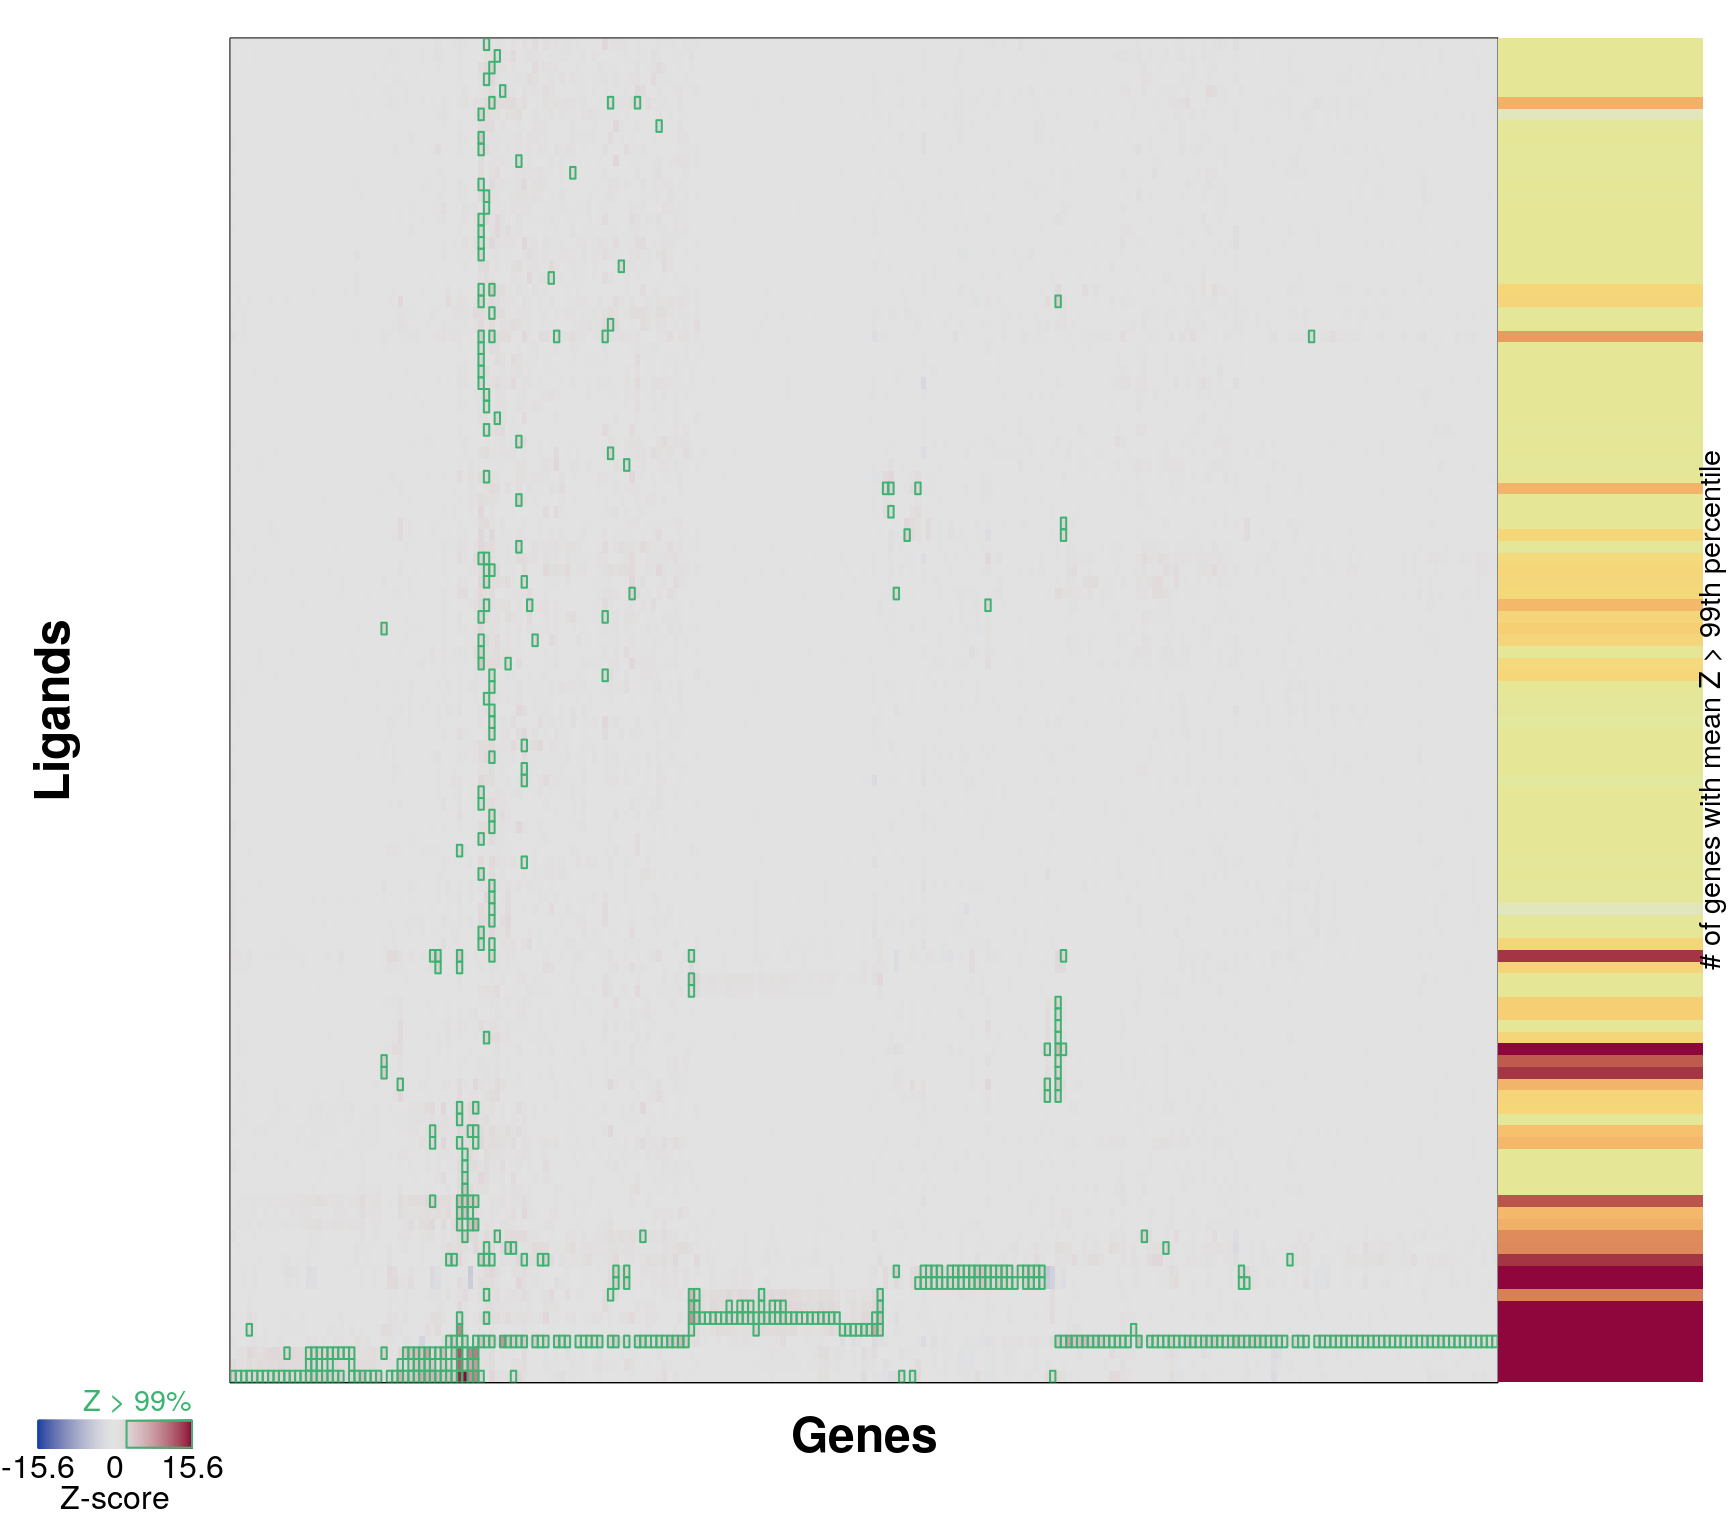
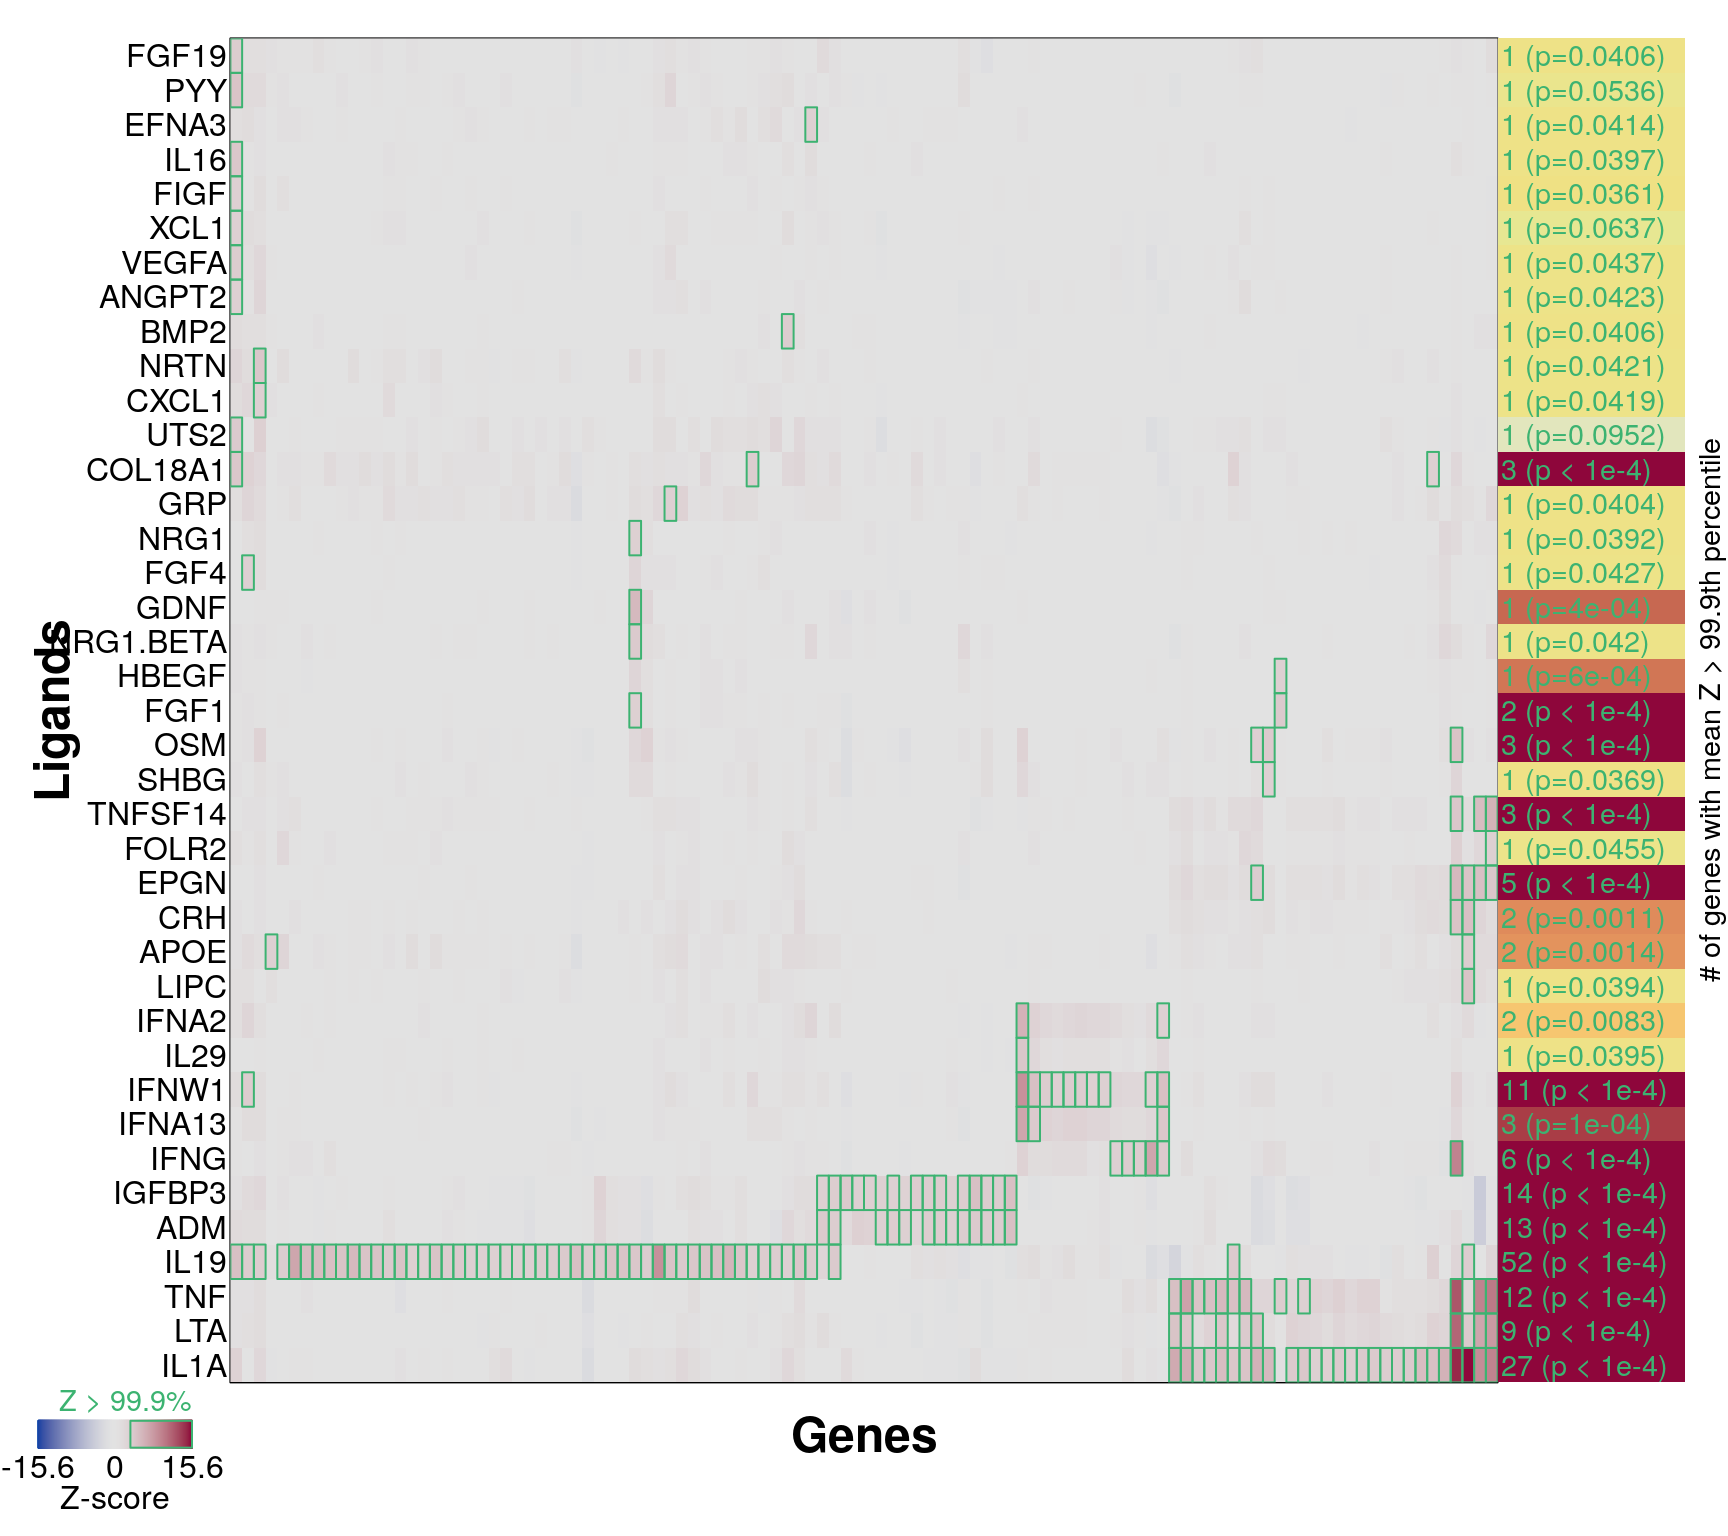
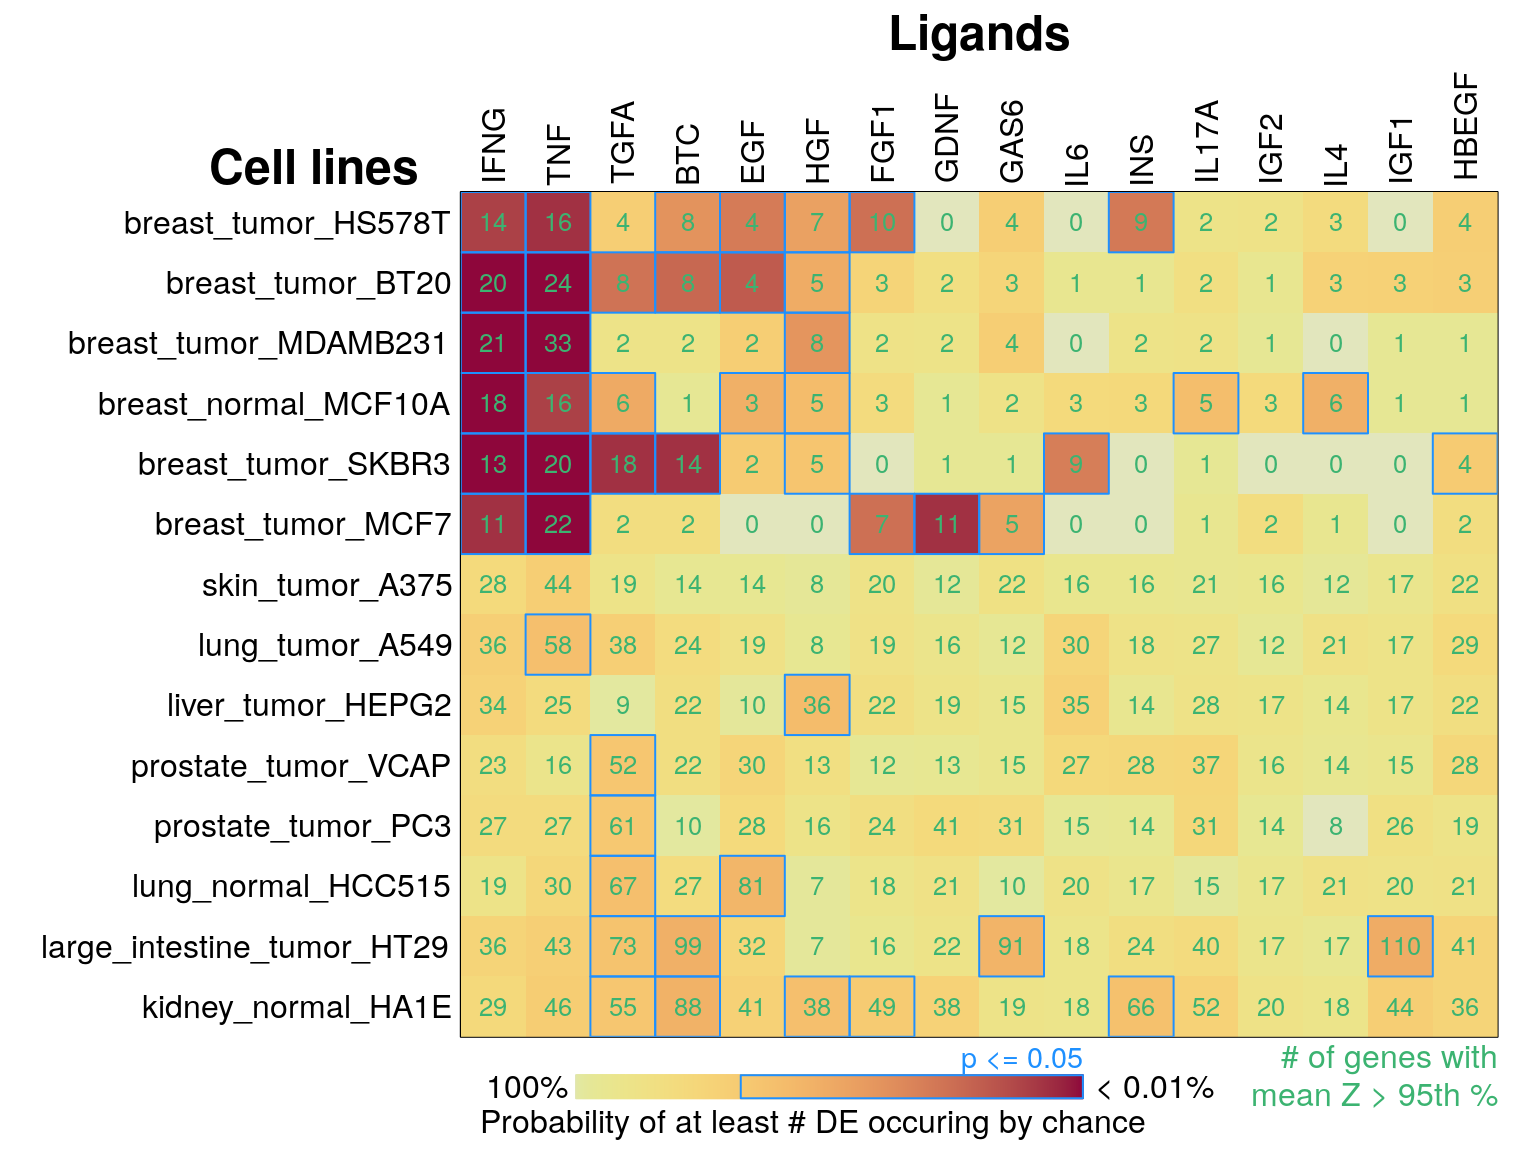
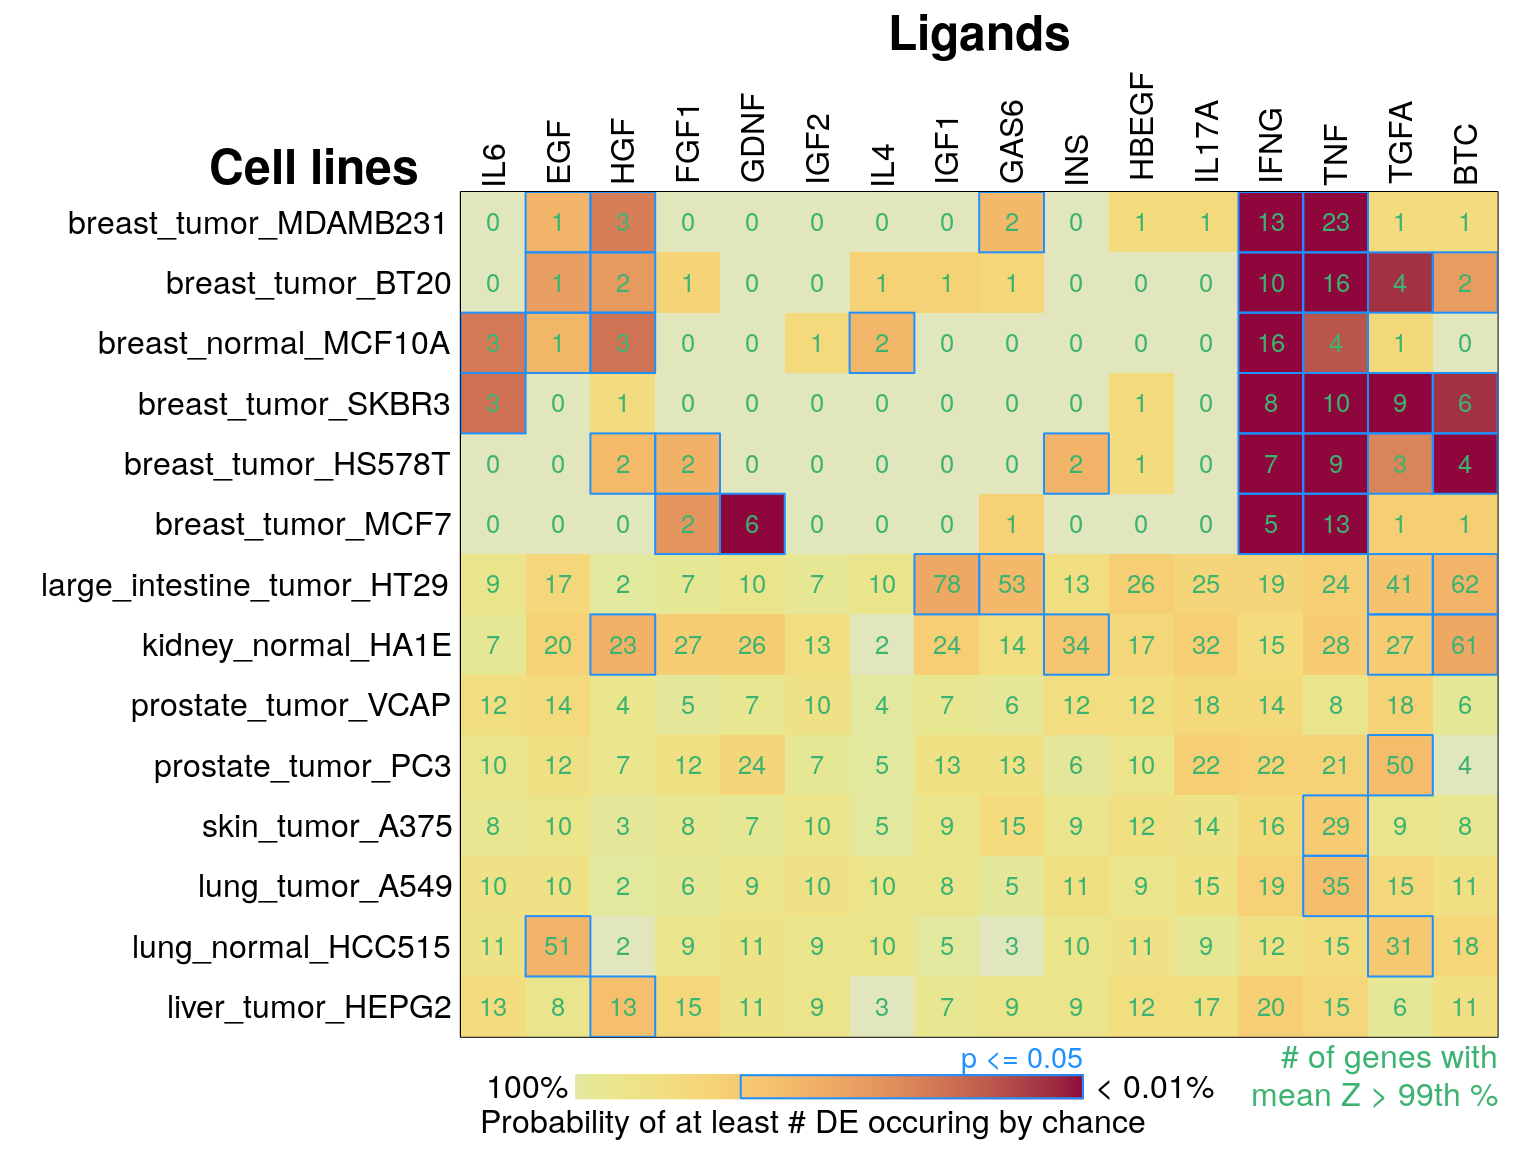
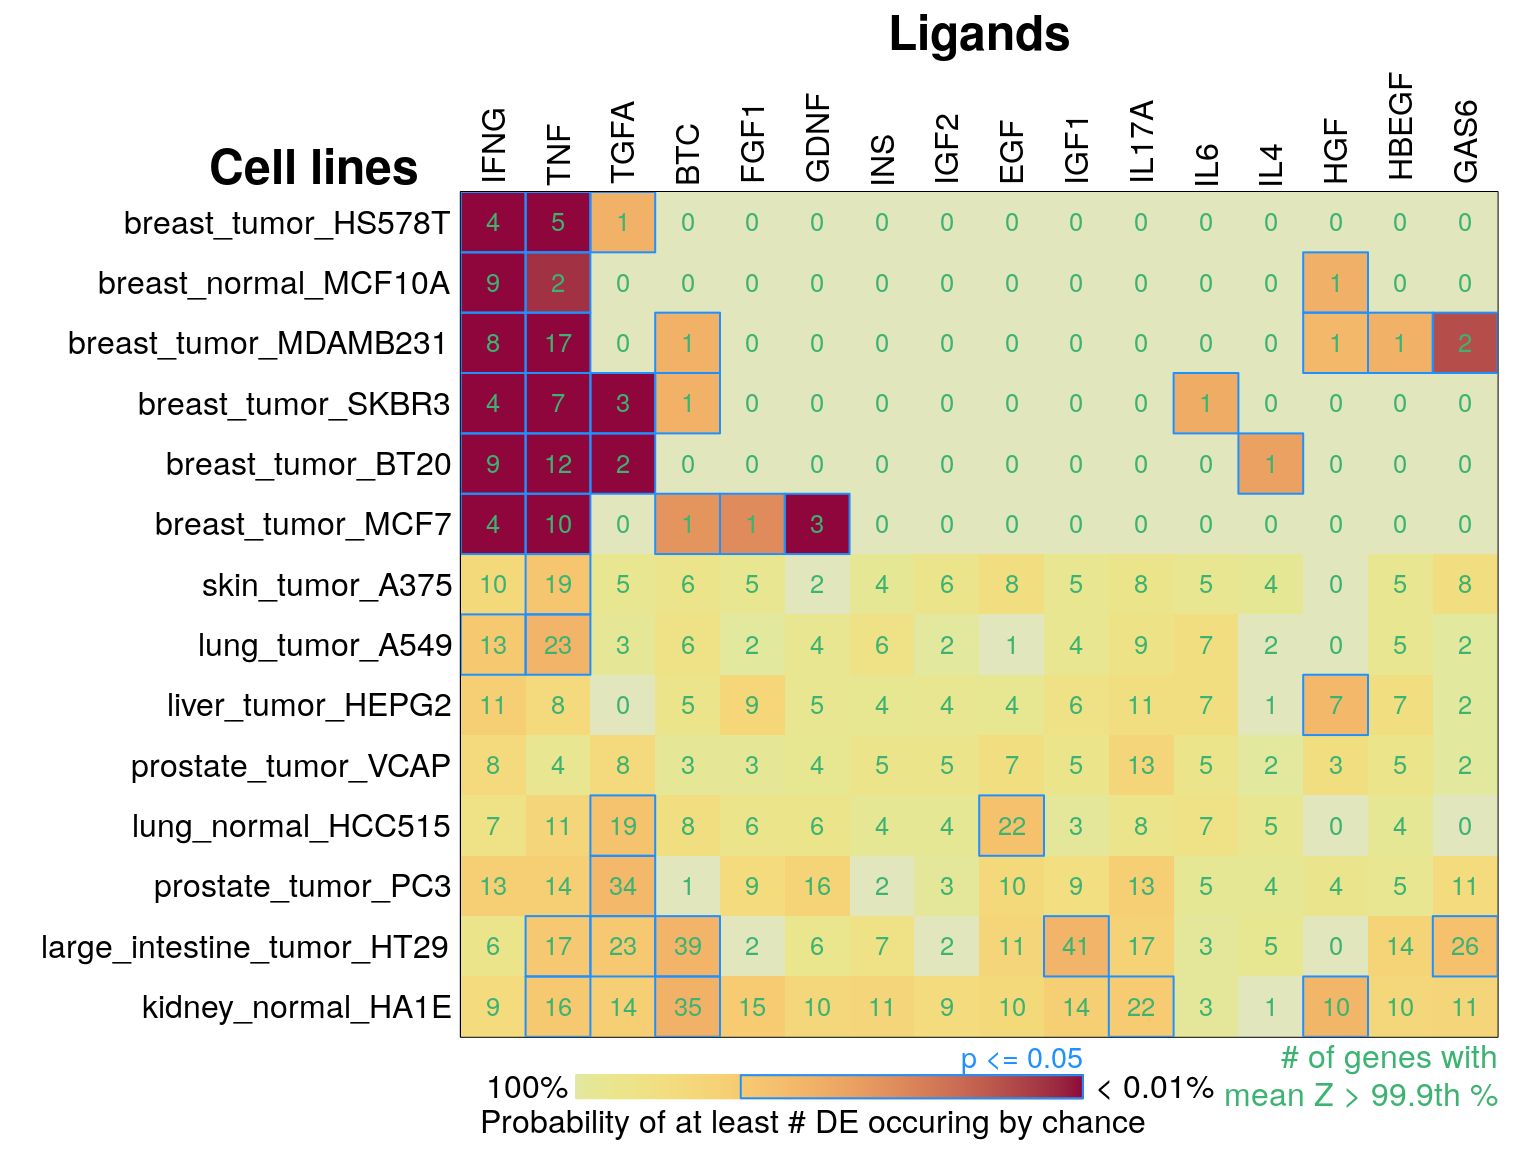
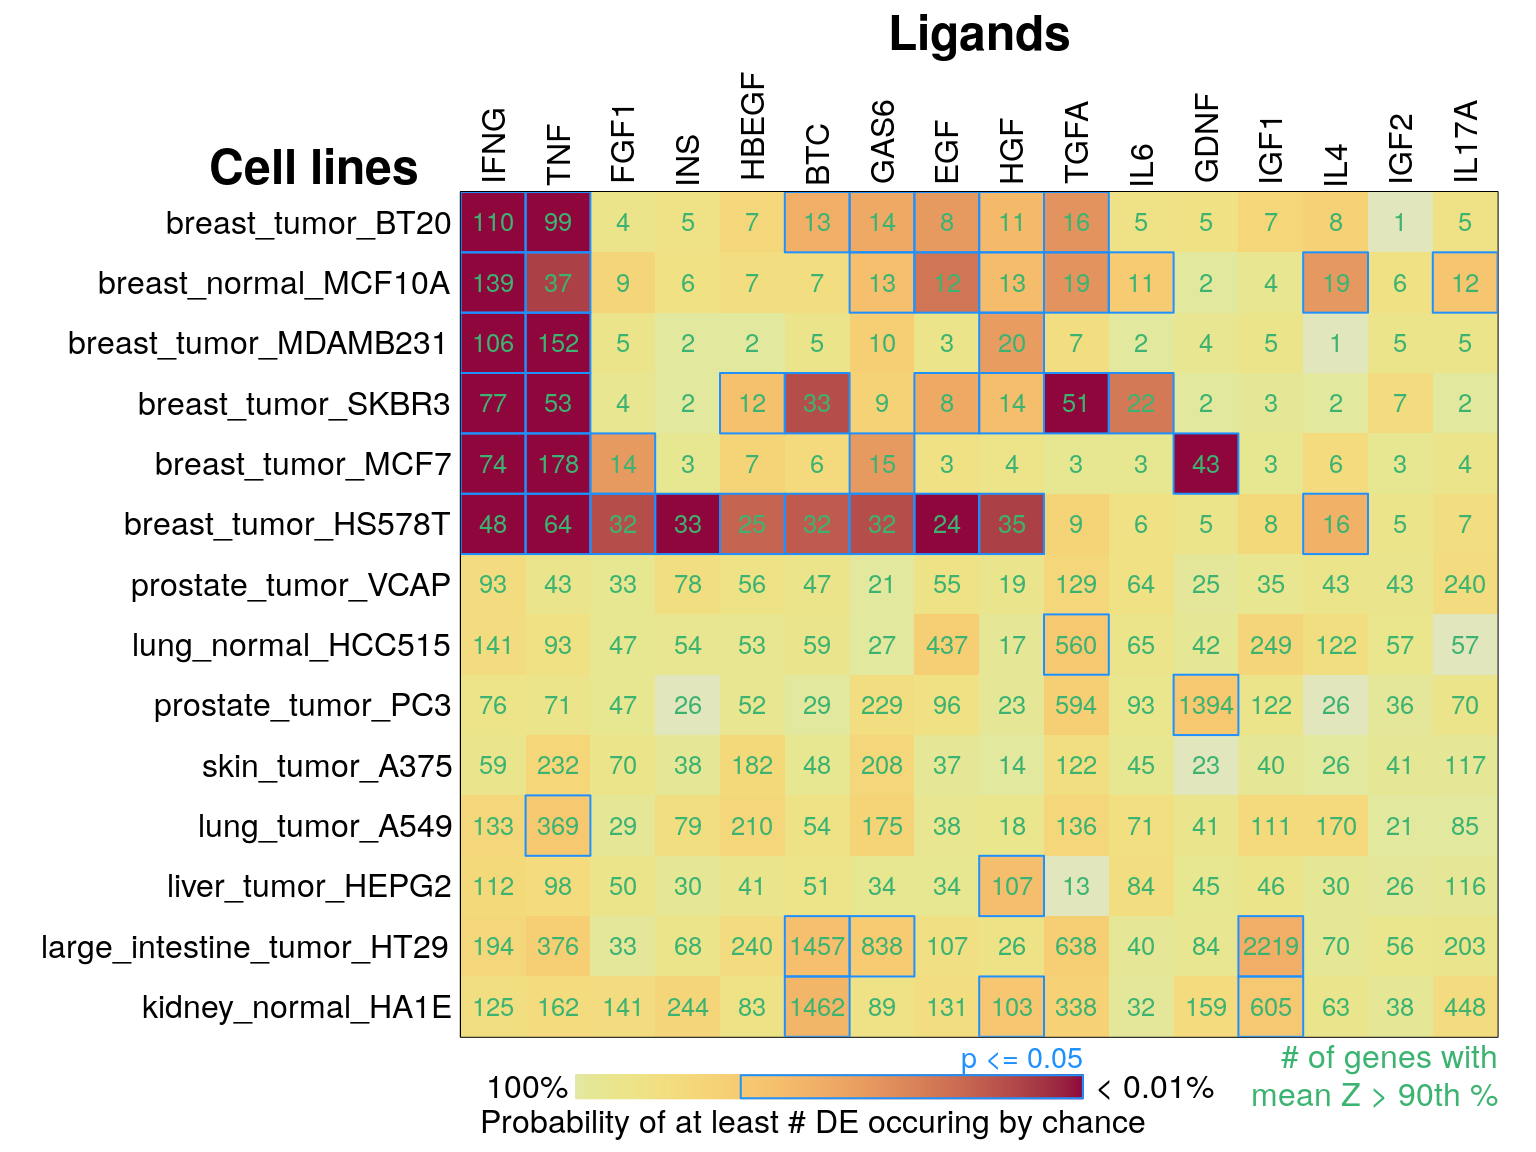
Differential Gene Expression overlap
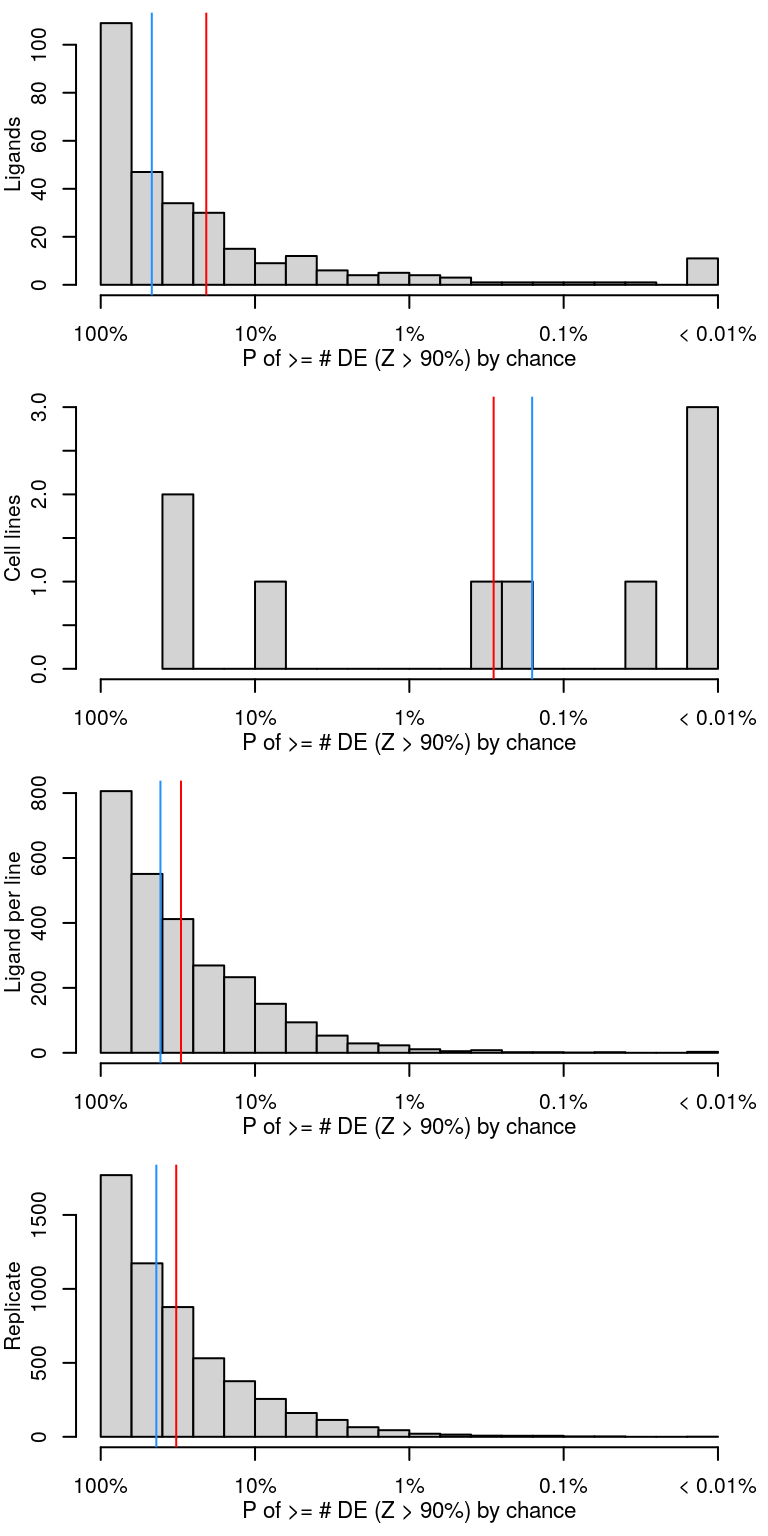
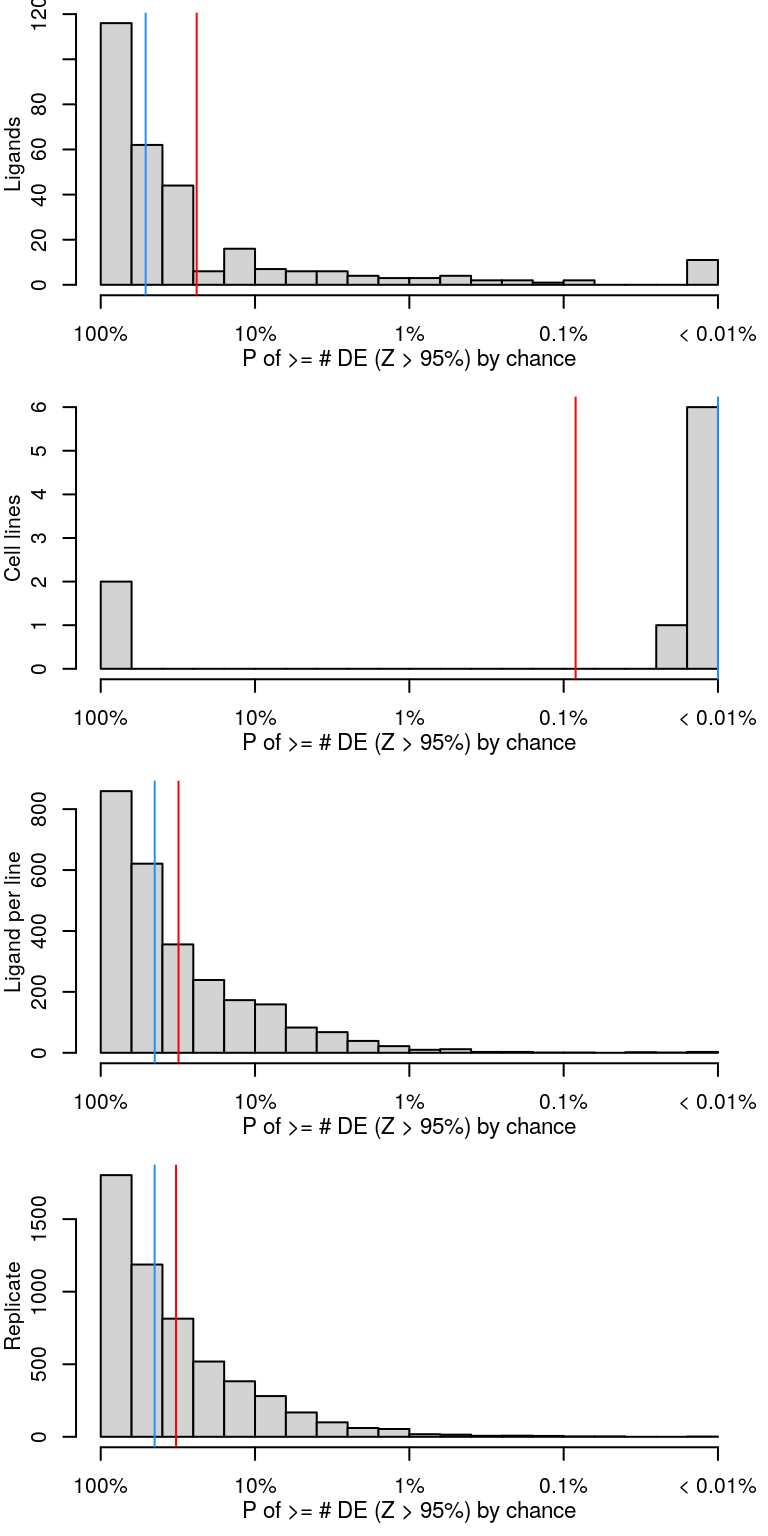
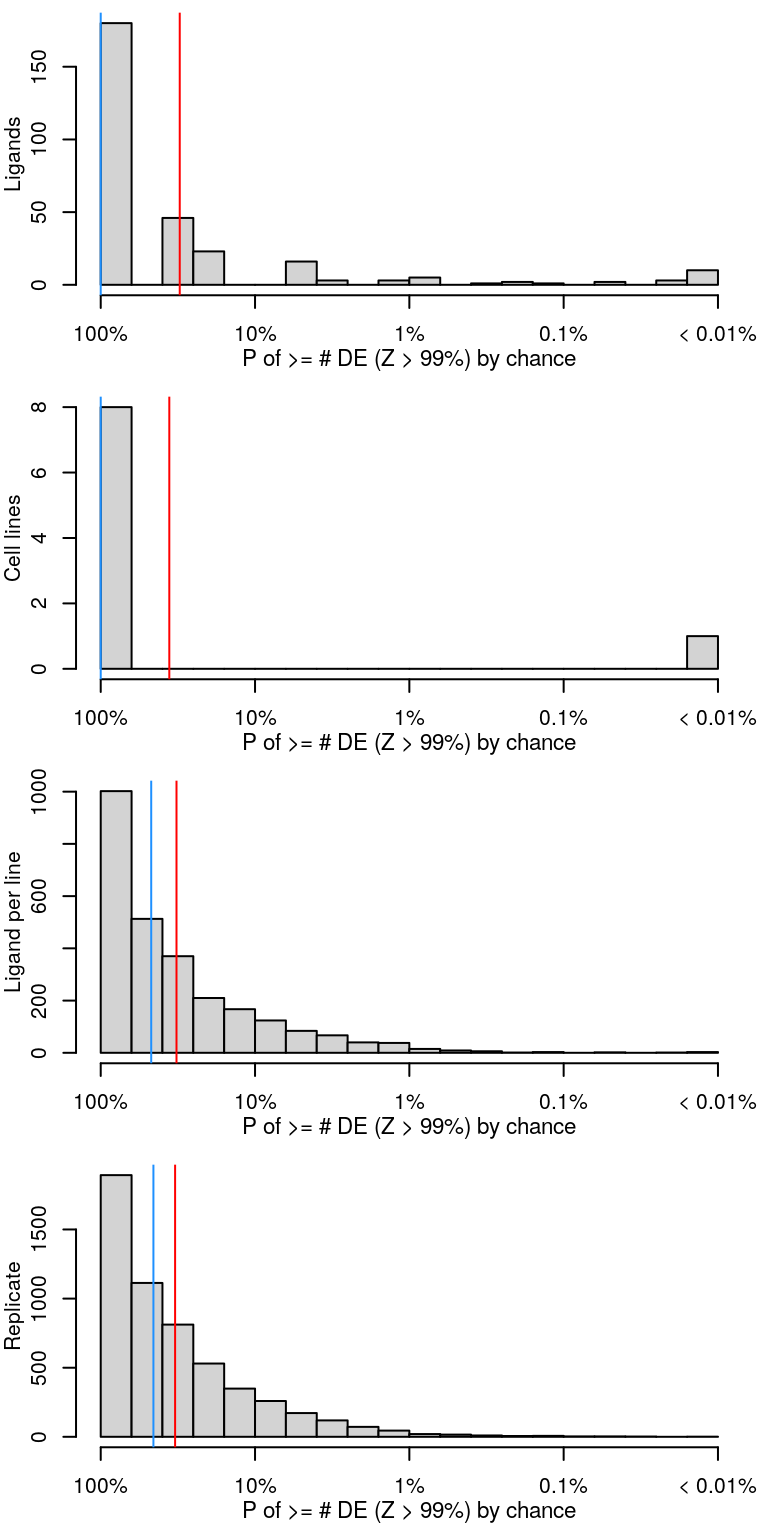
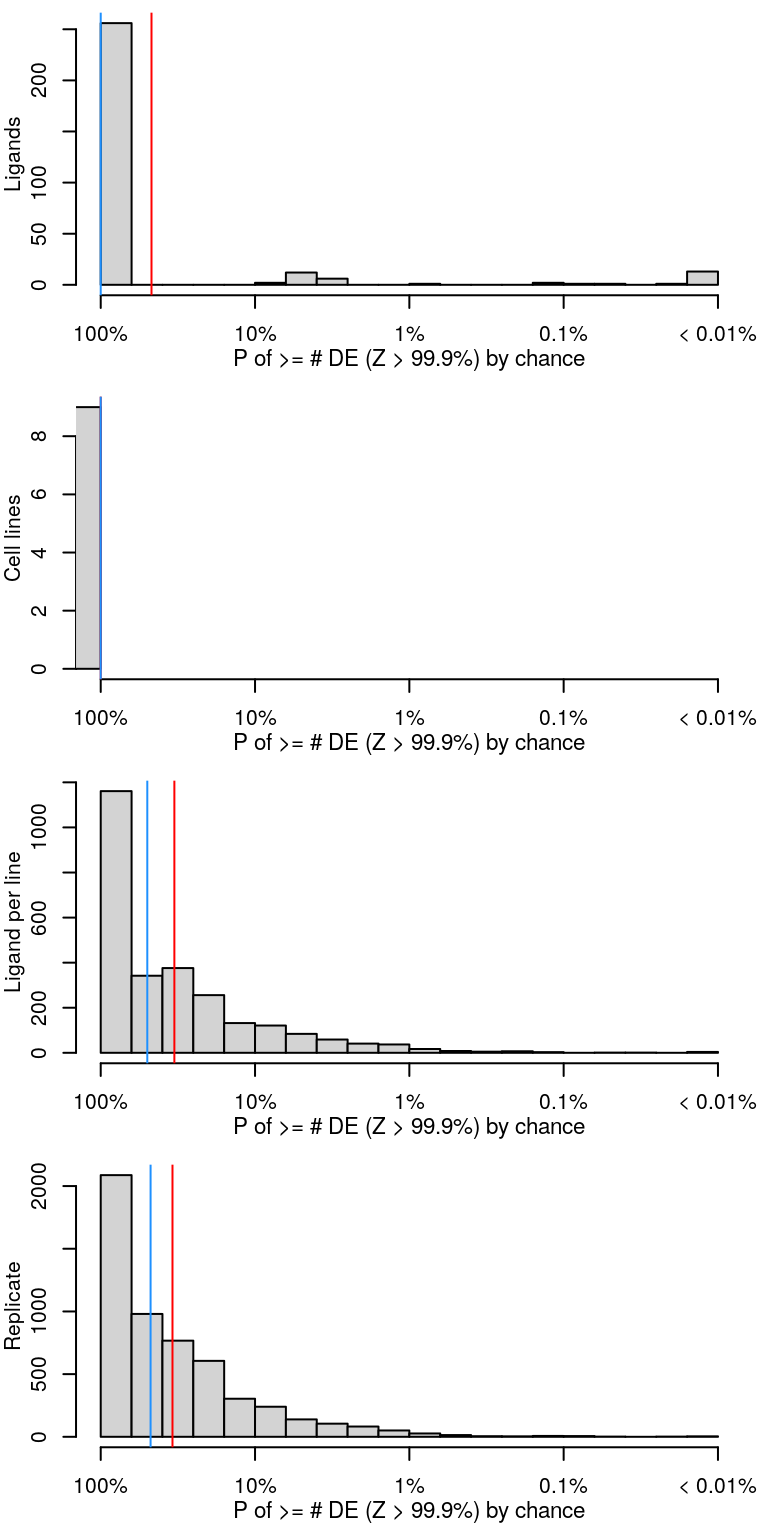
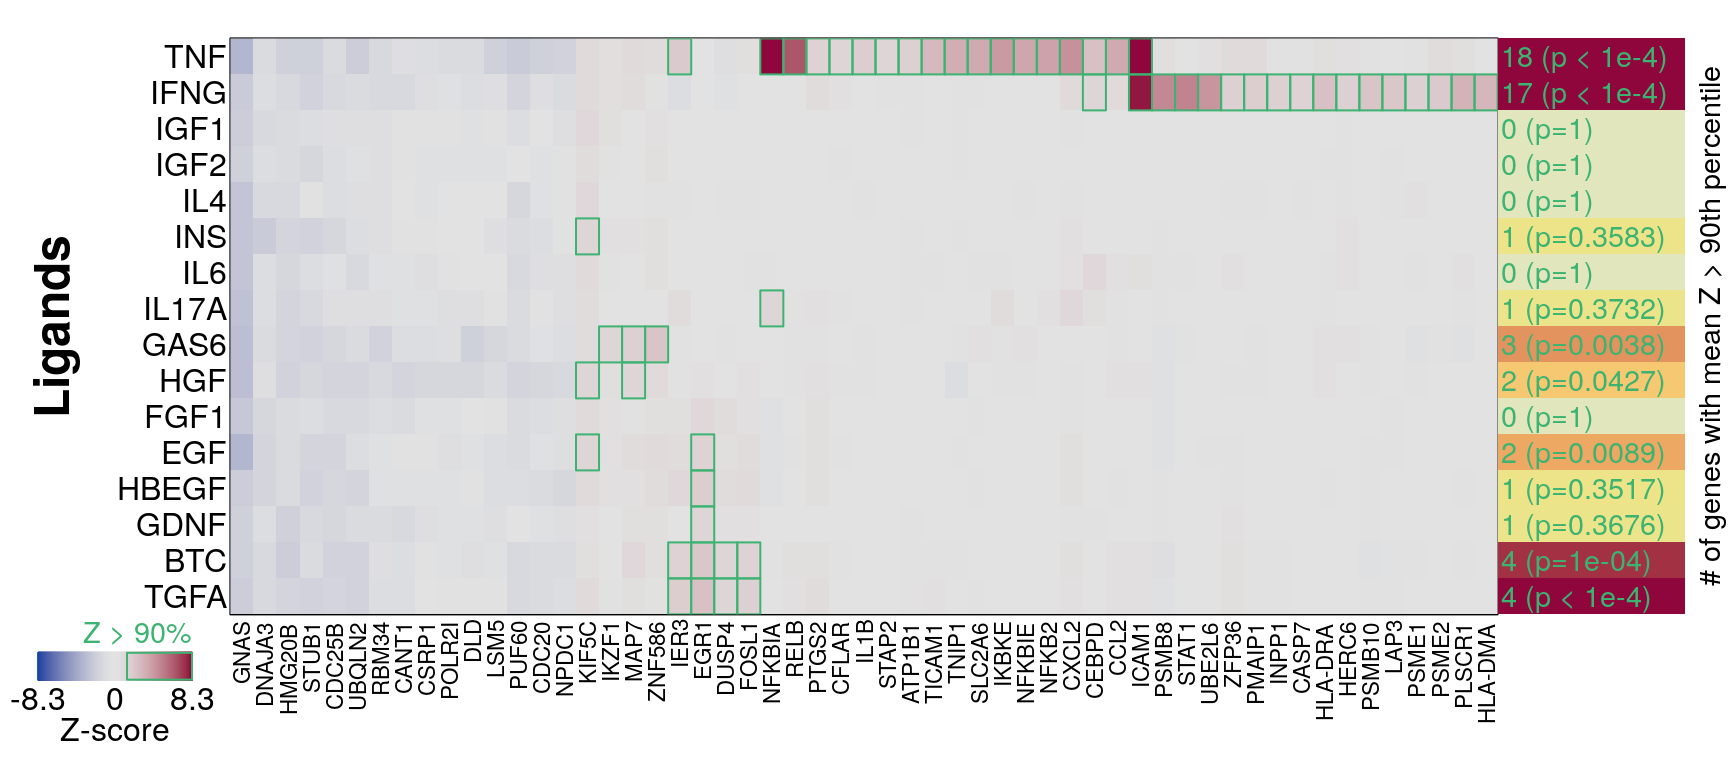
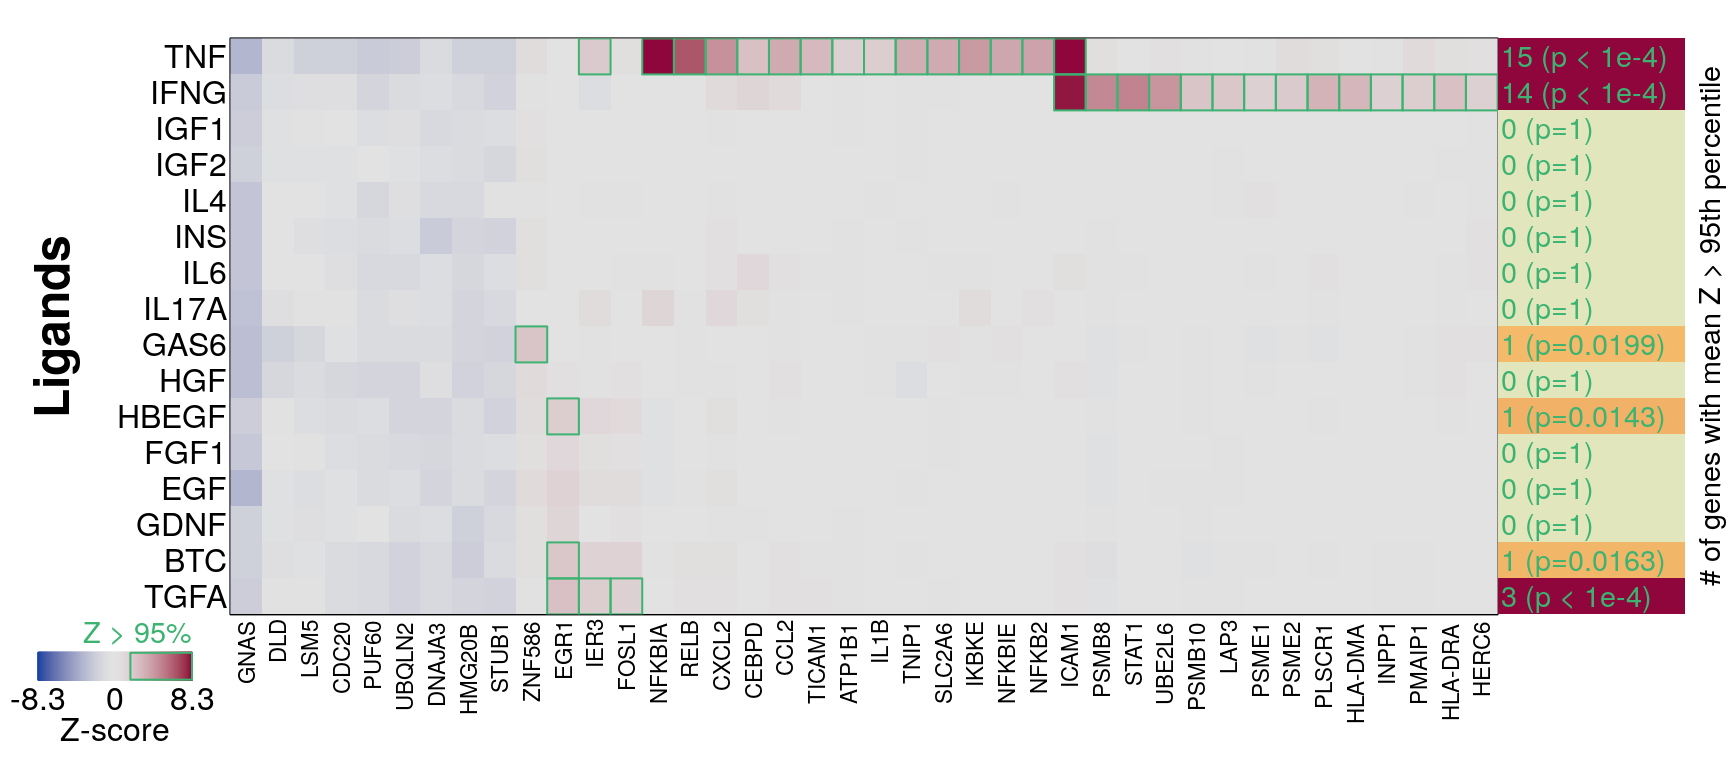
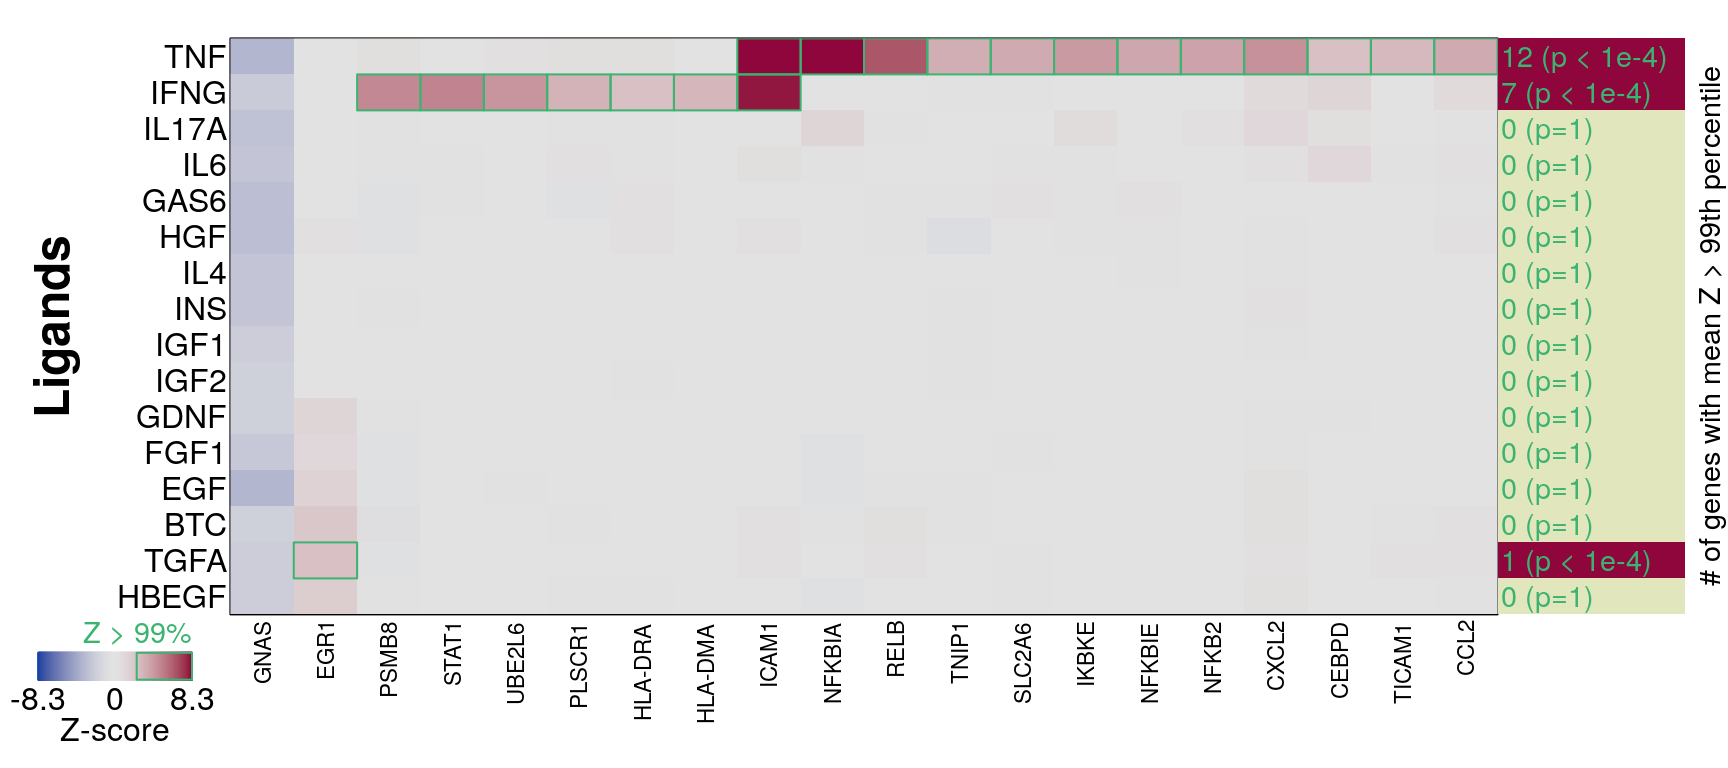
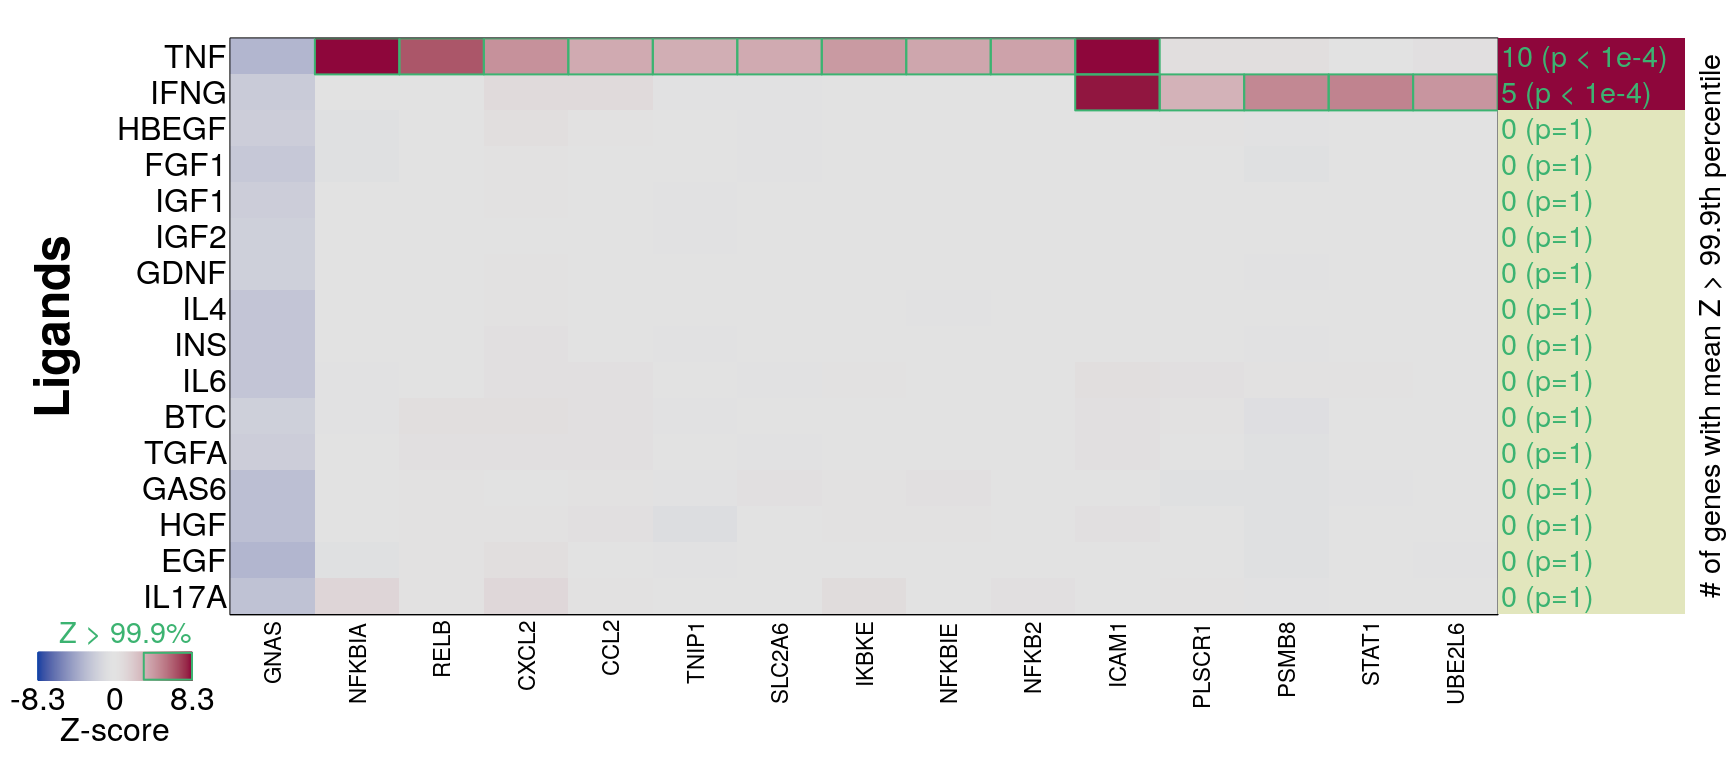
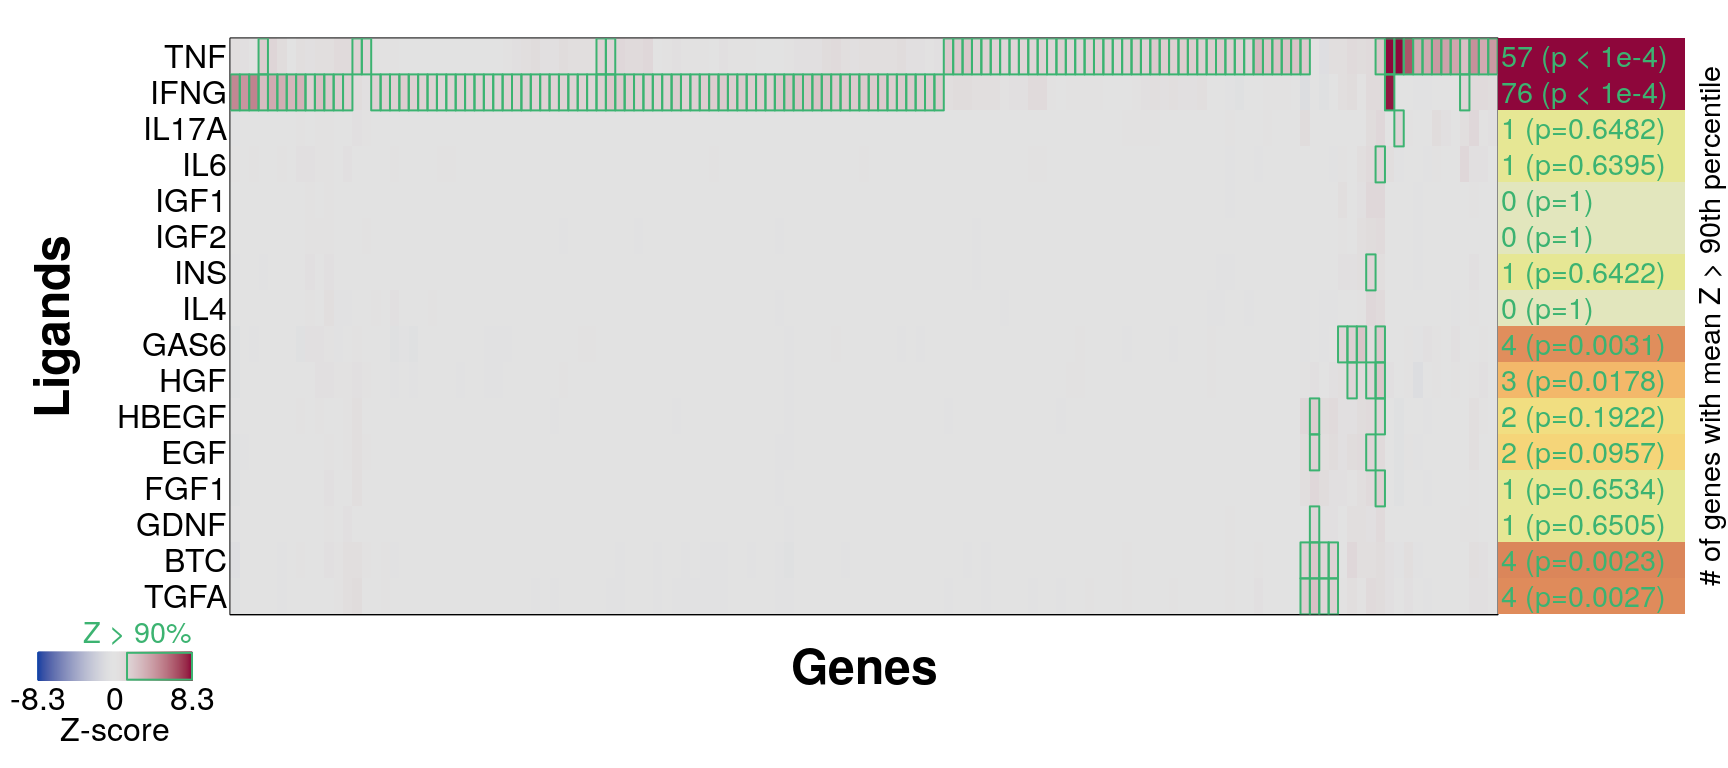
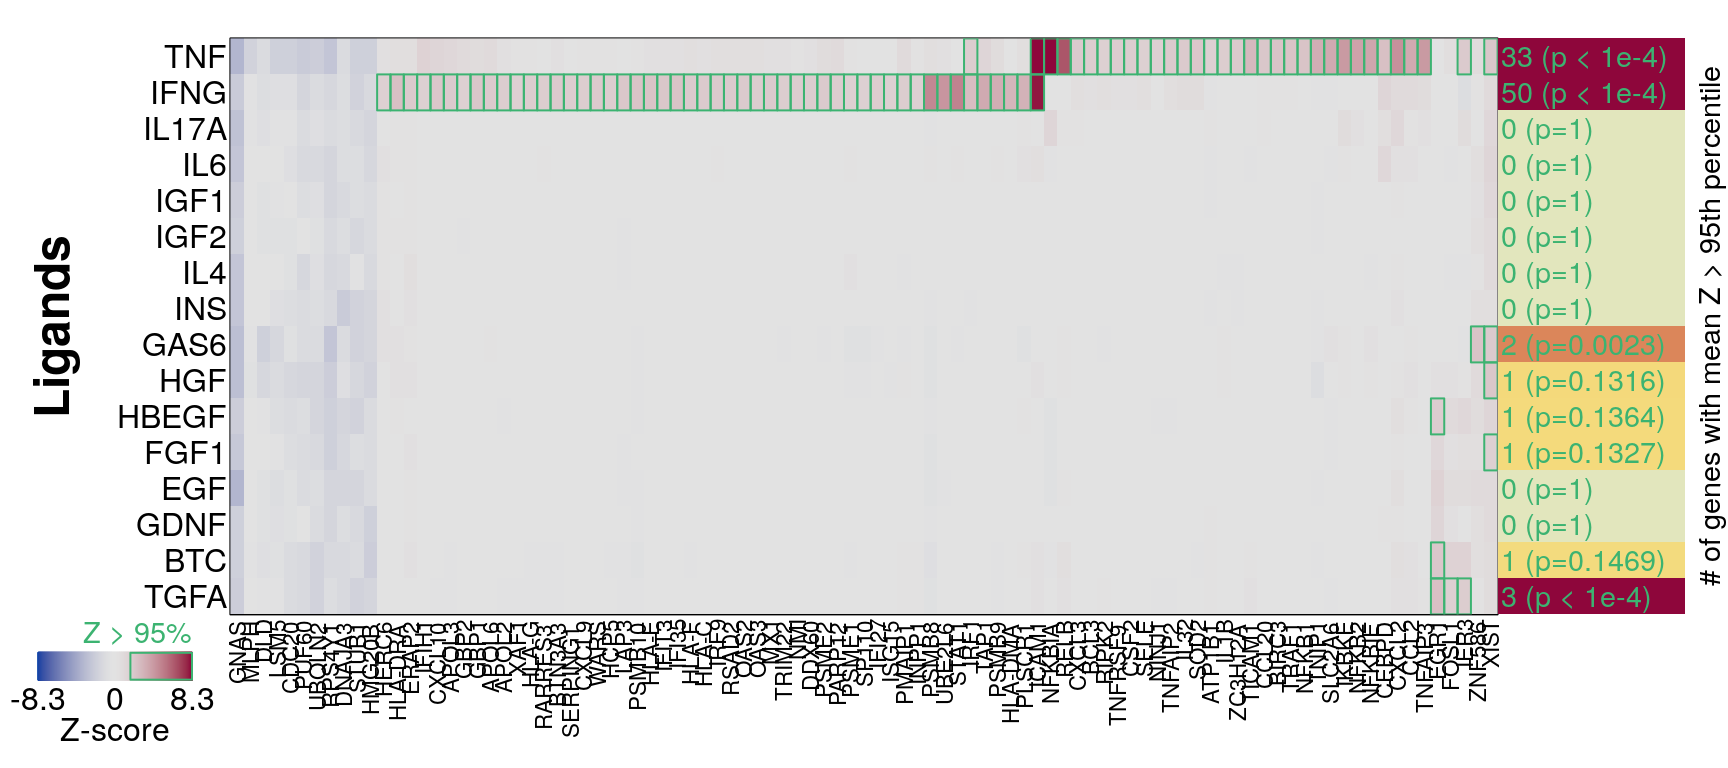
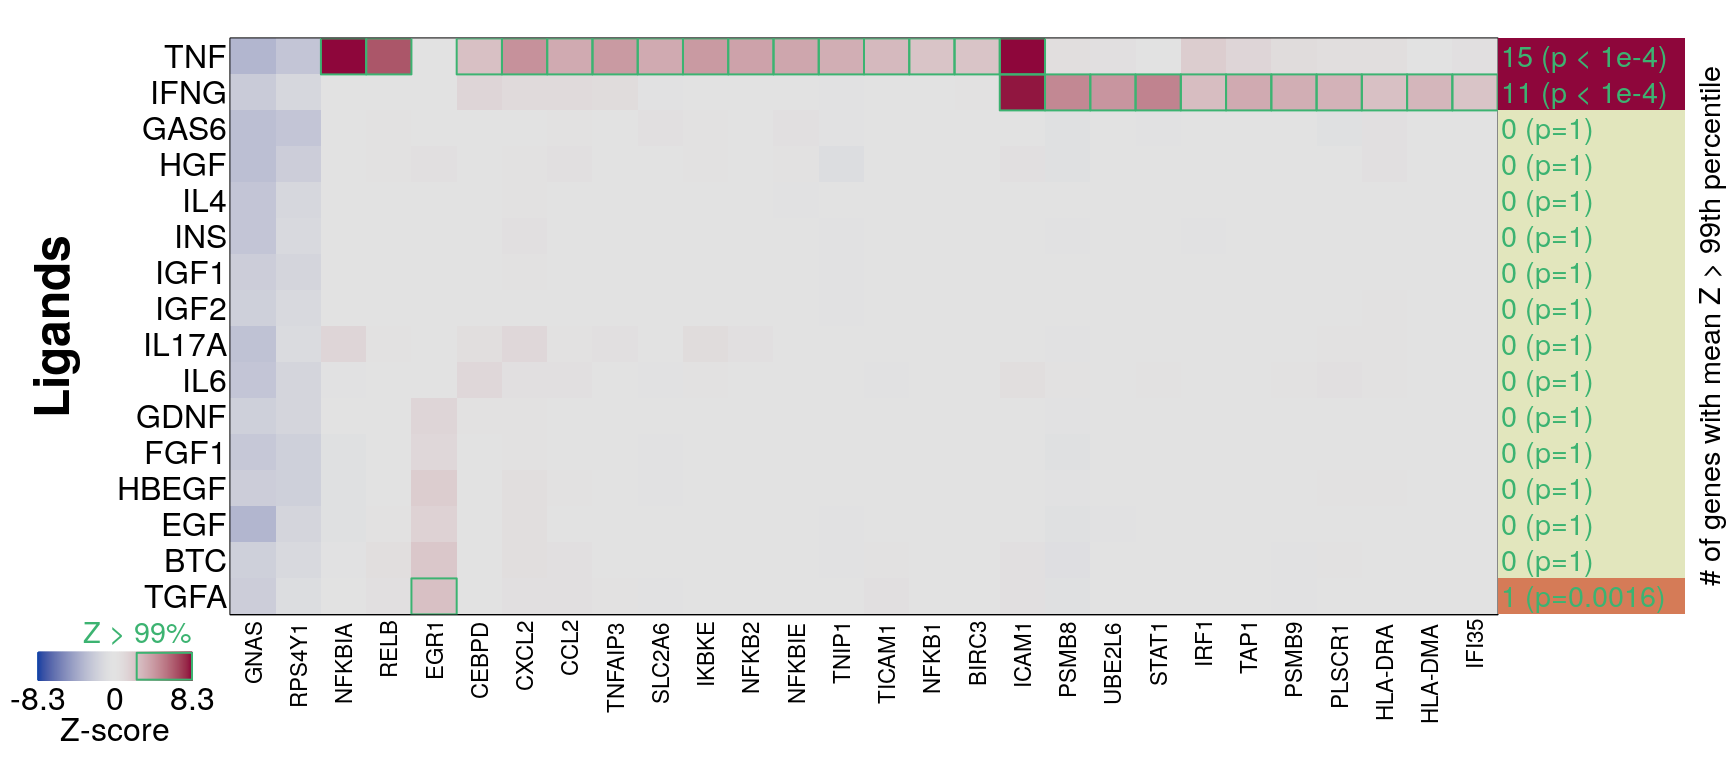
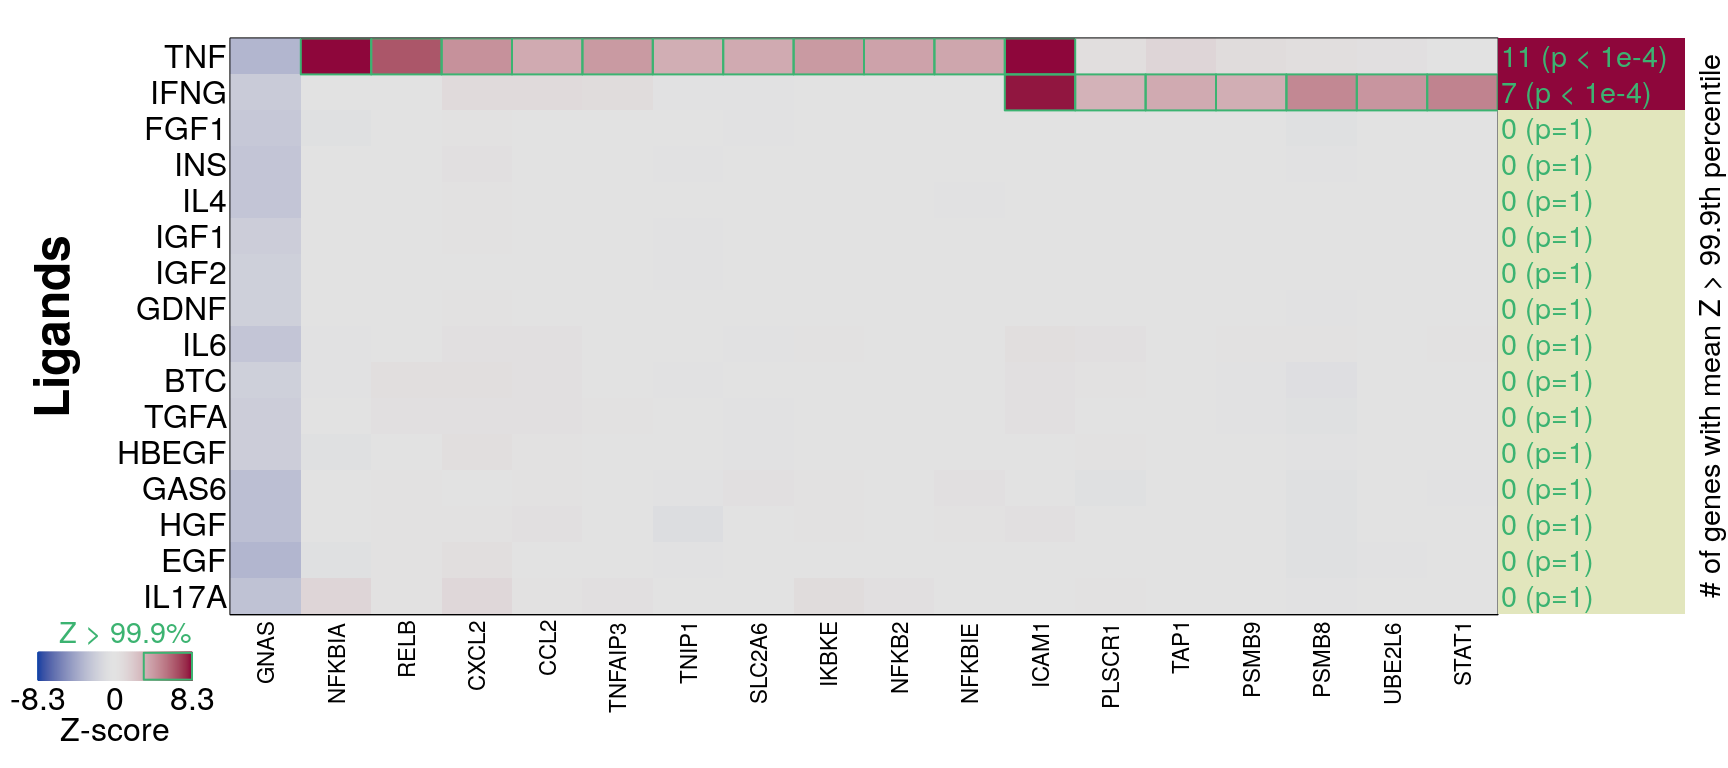
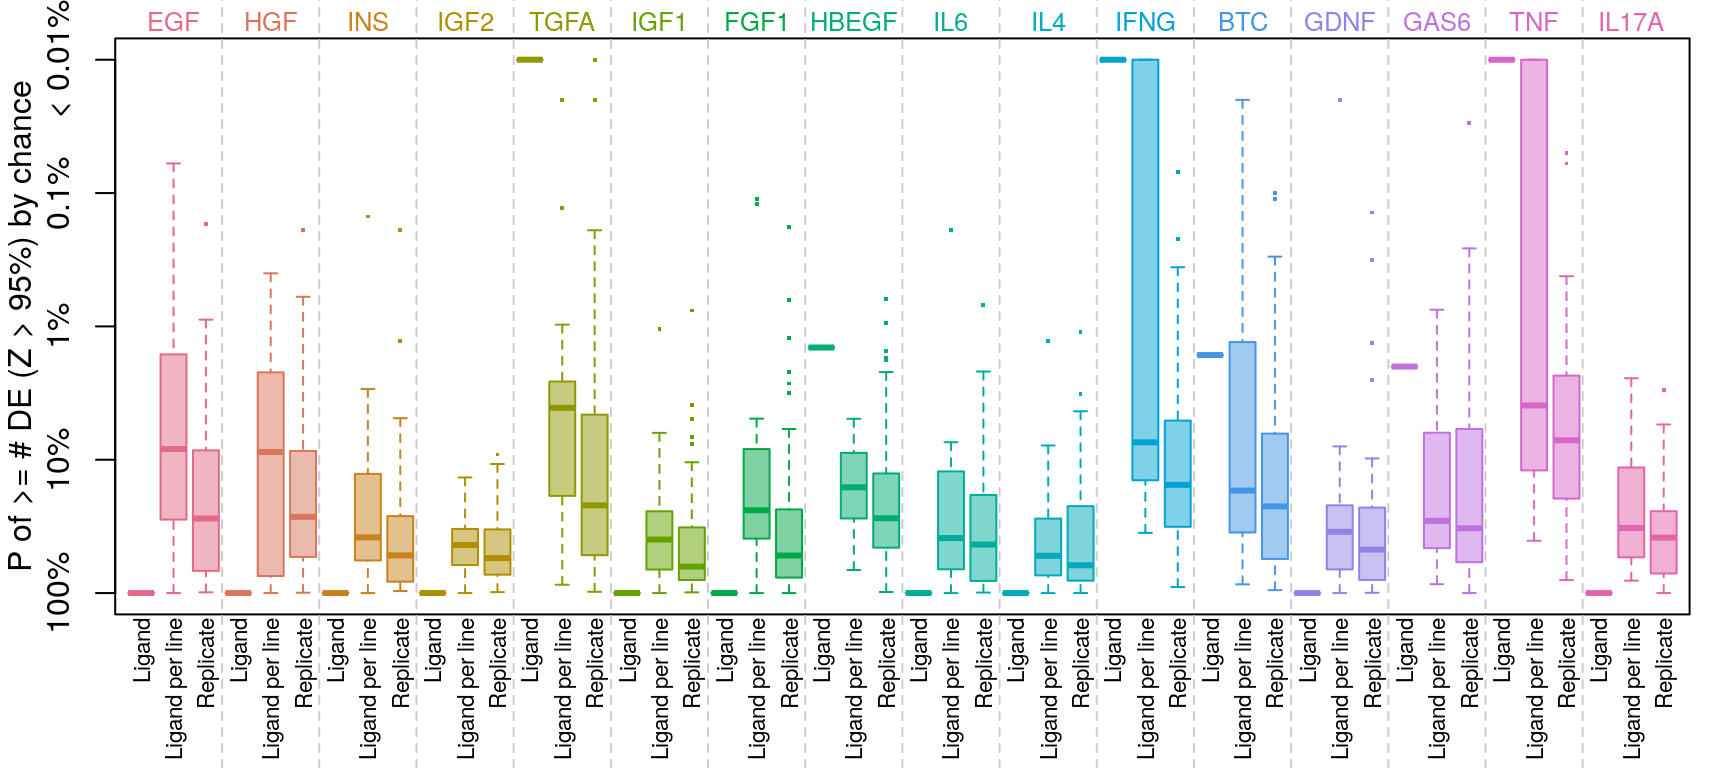
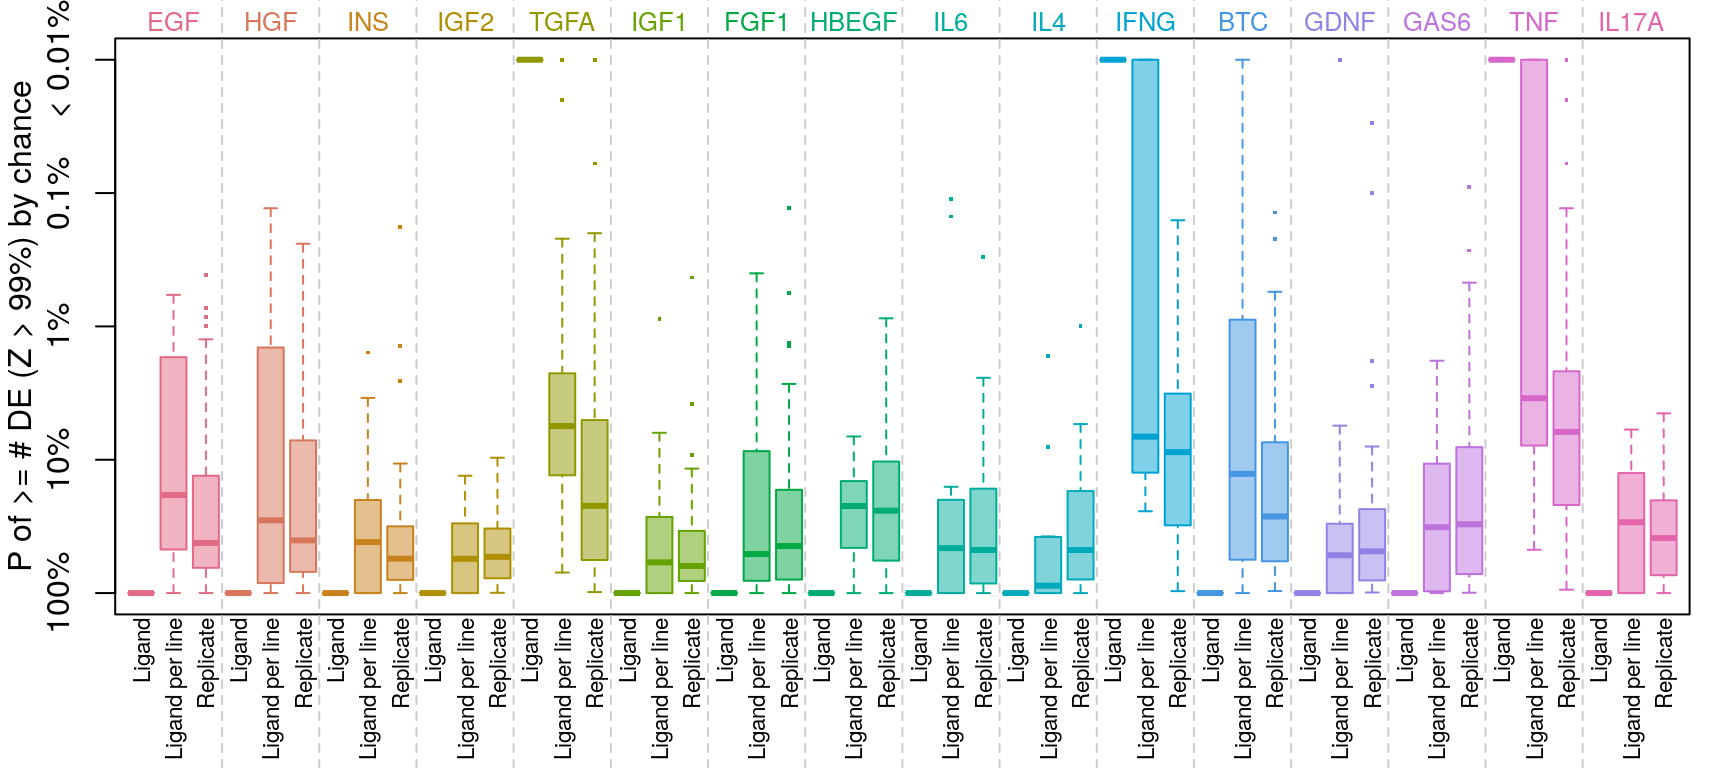
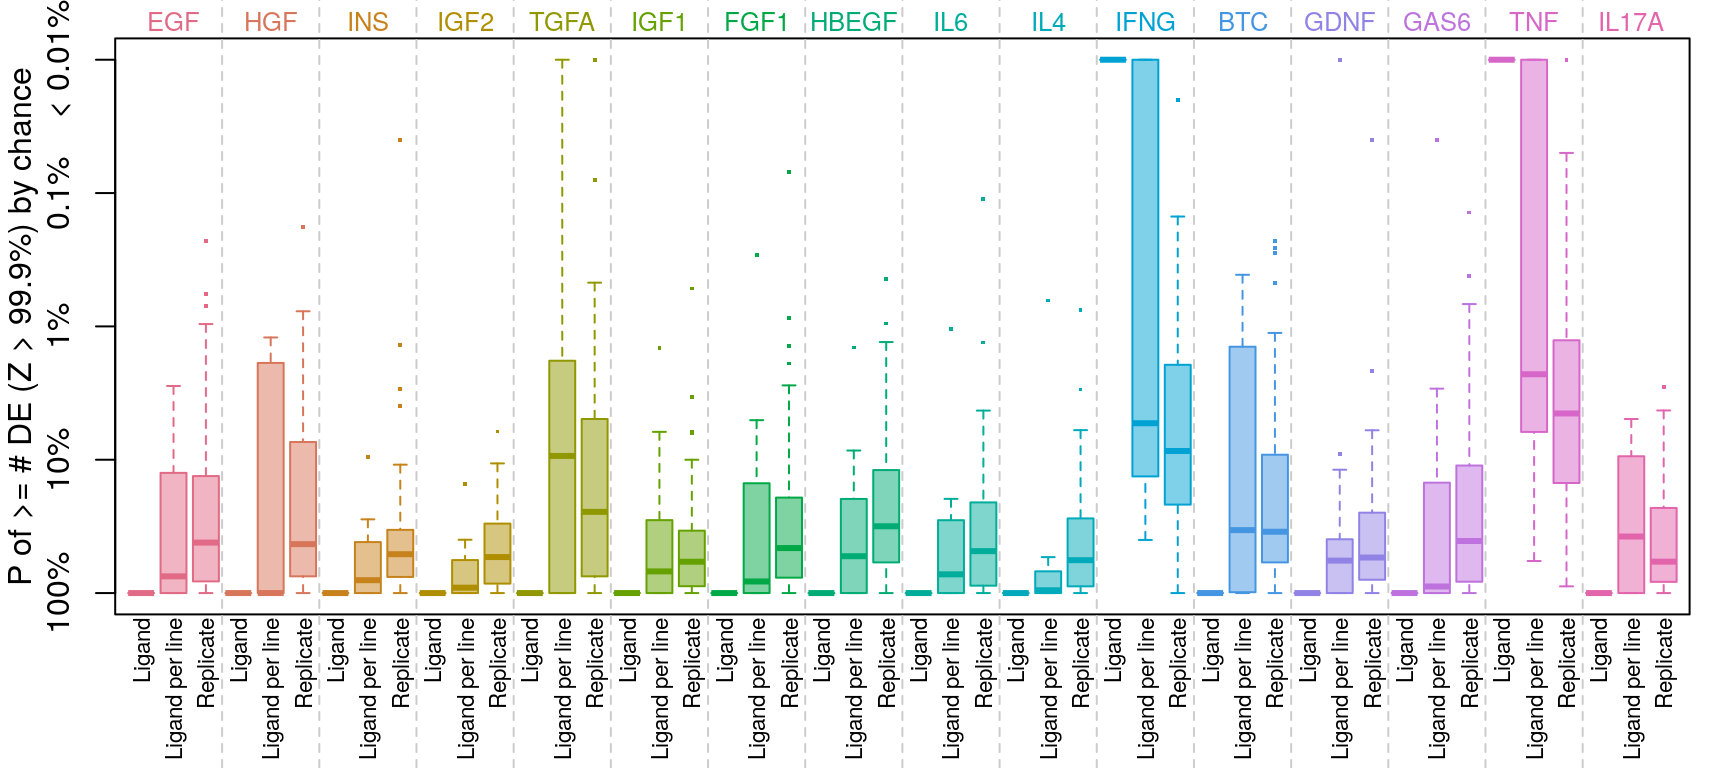
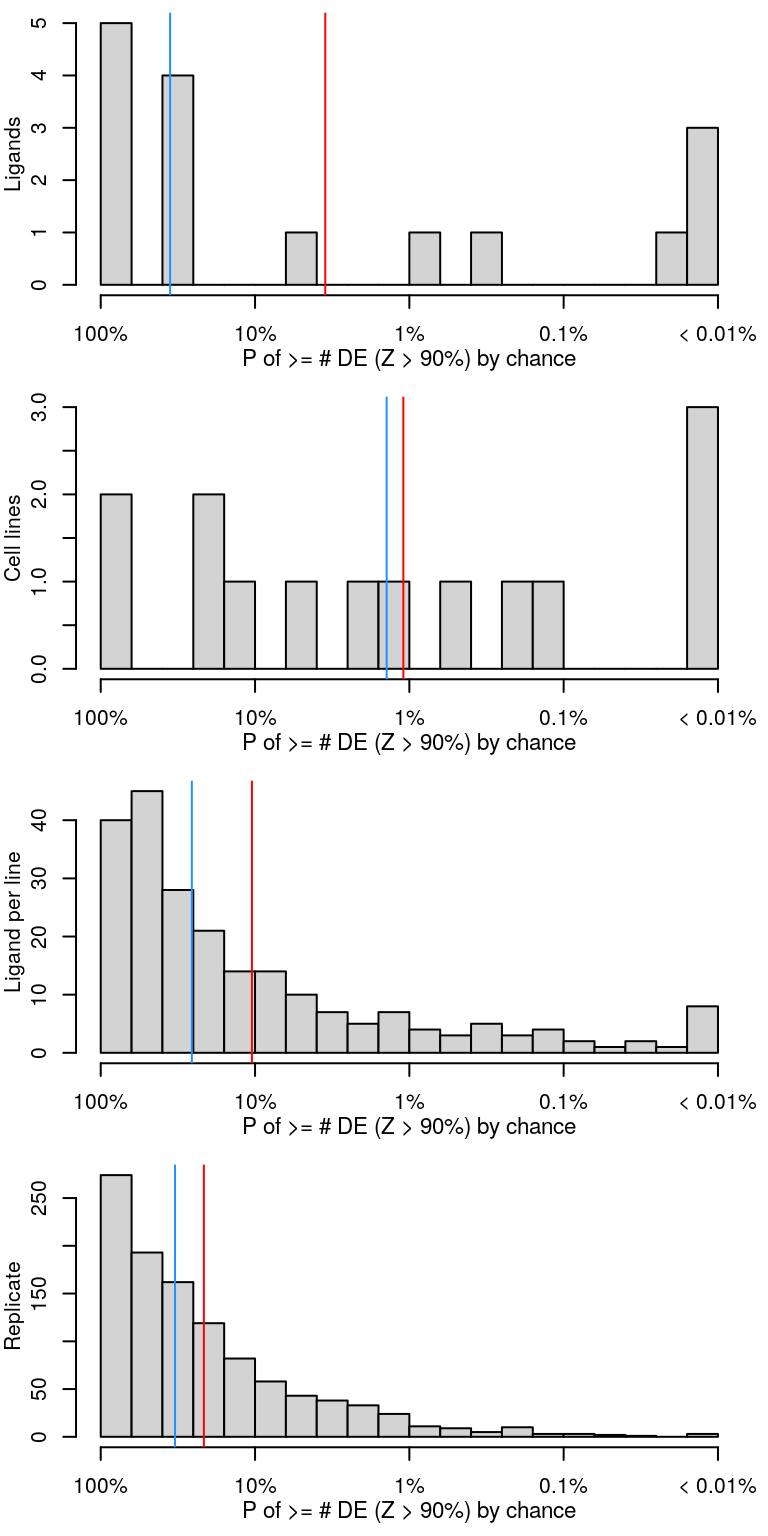
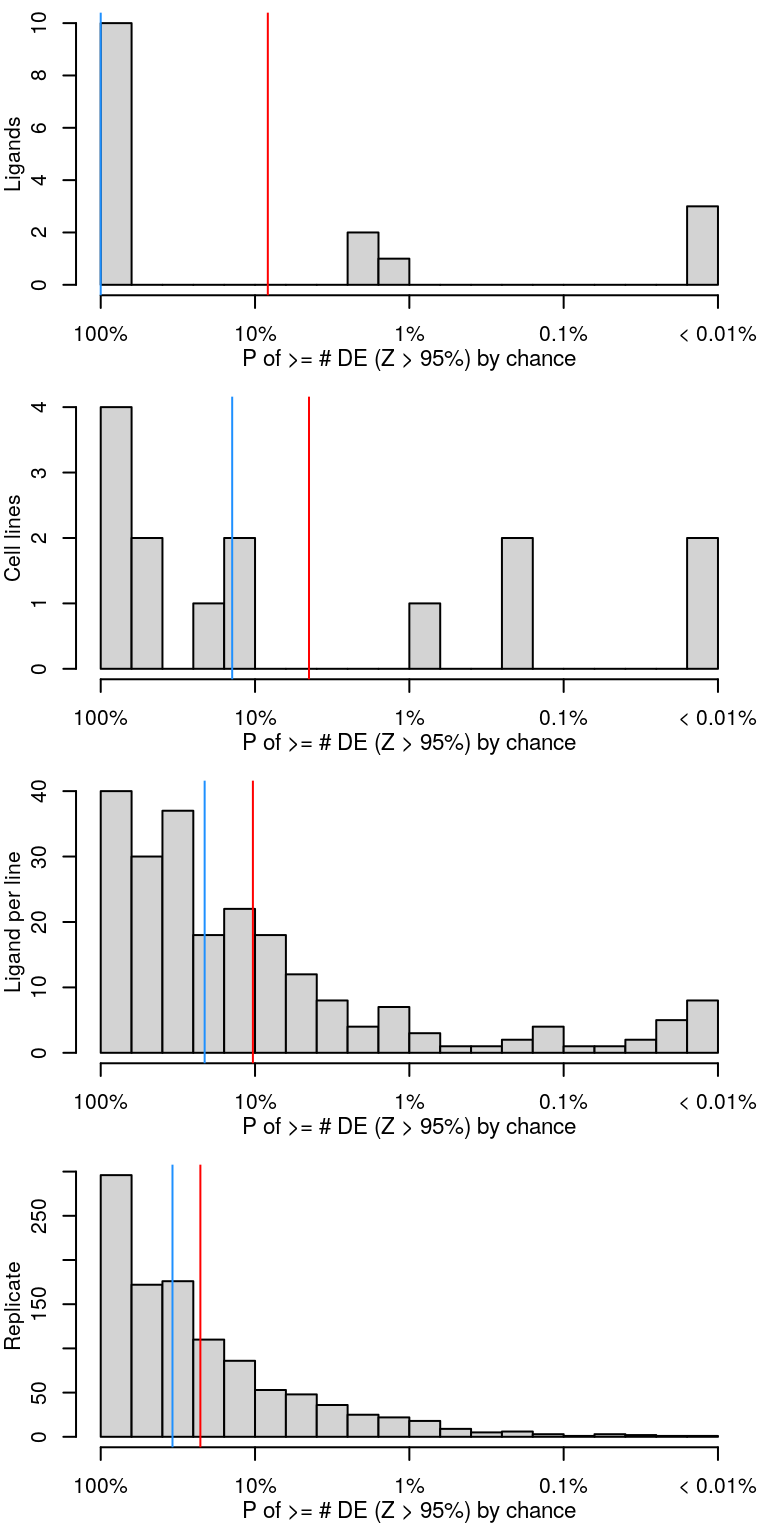
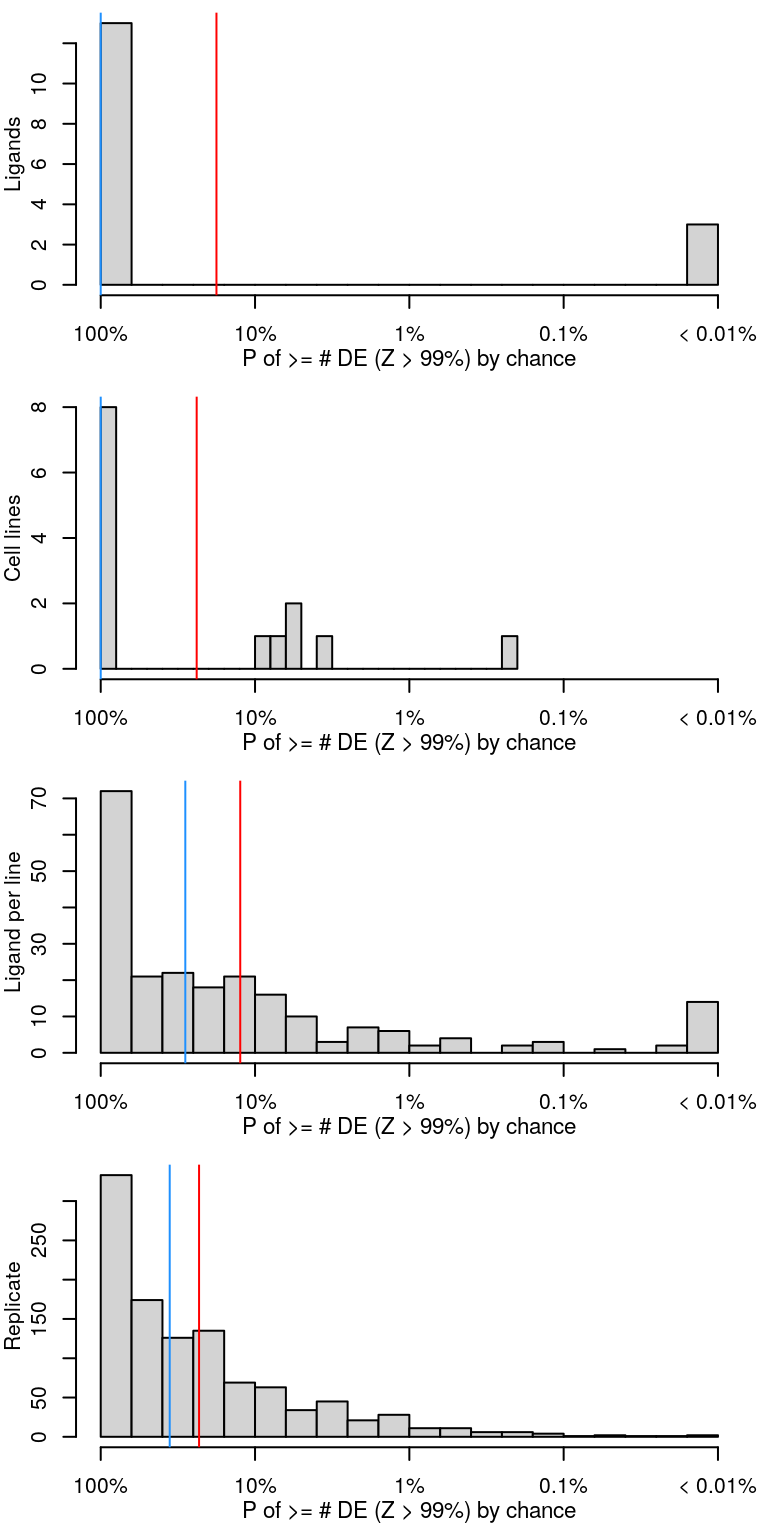
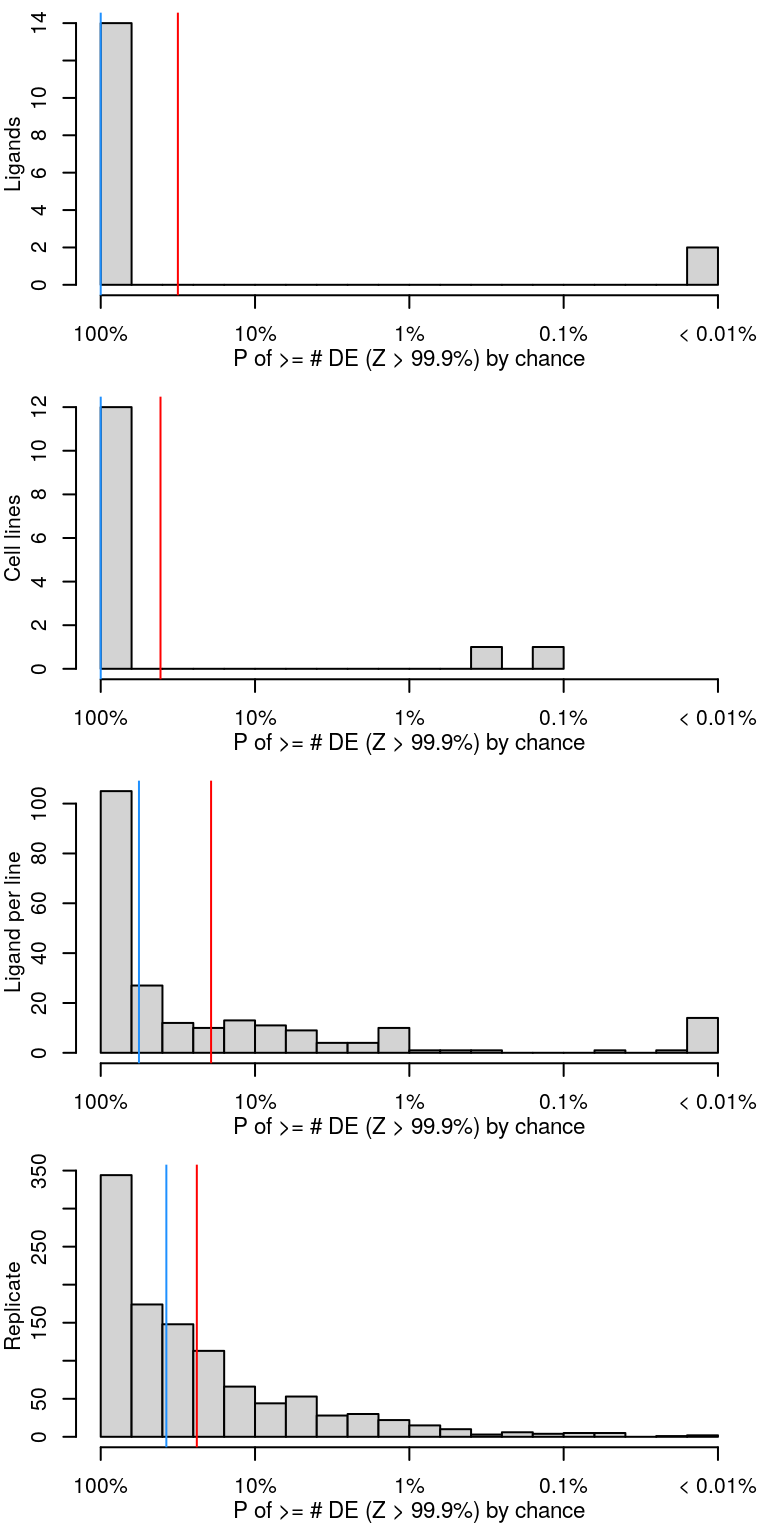
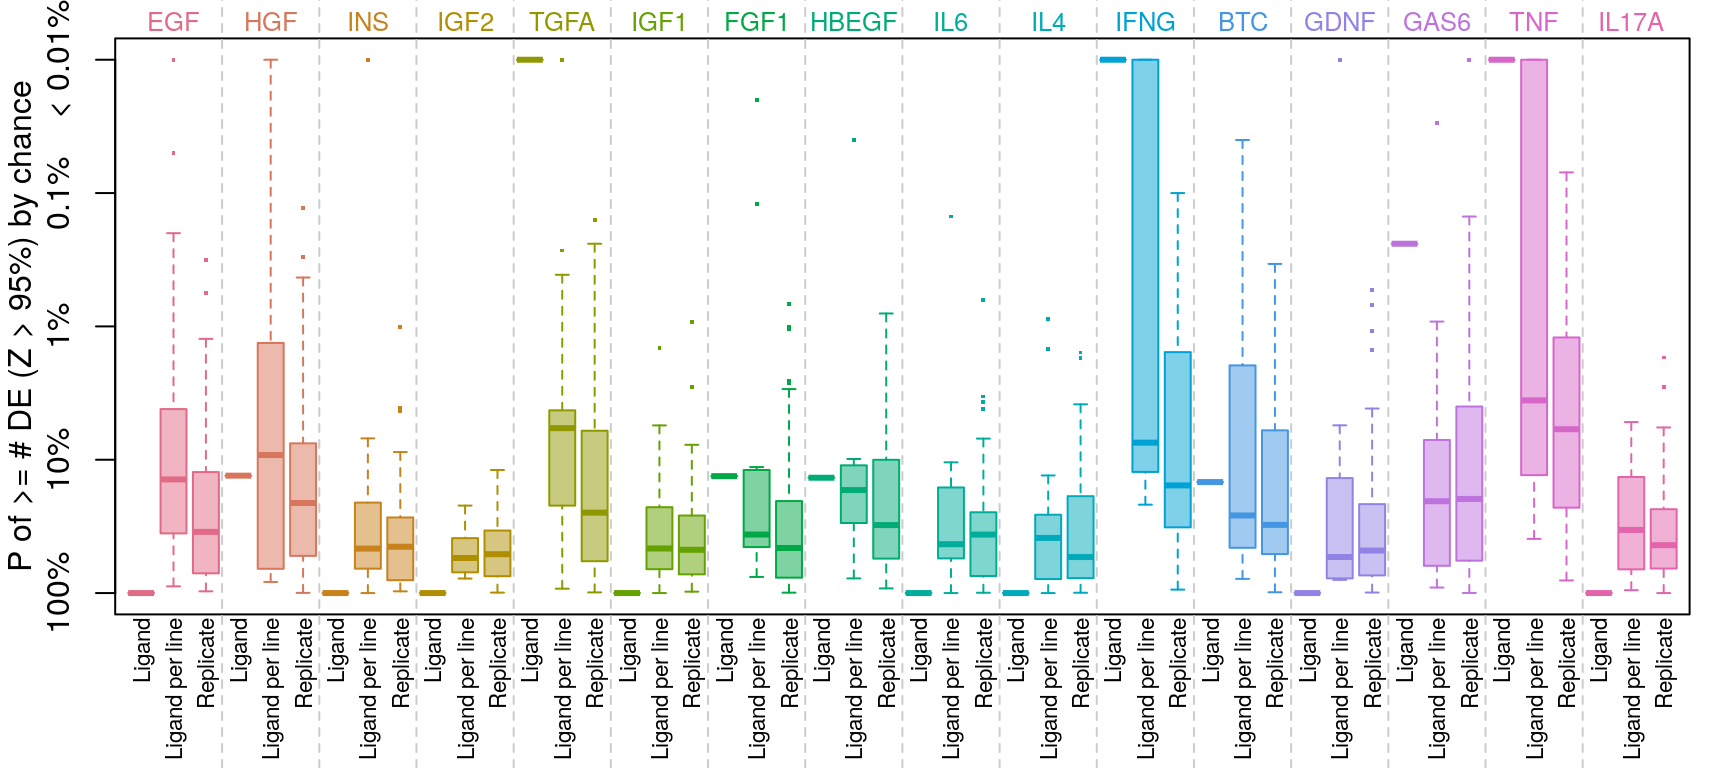
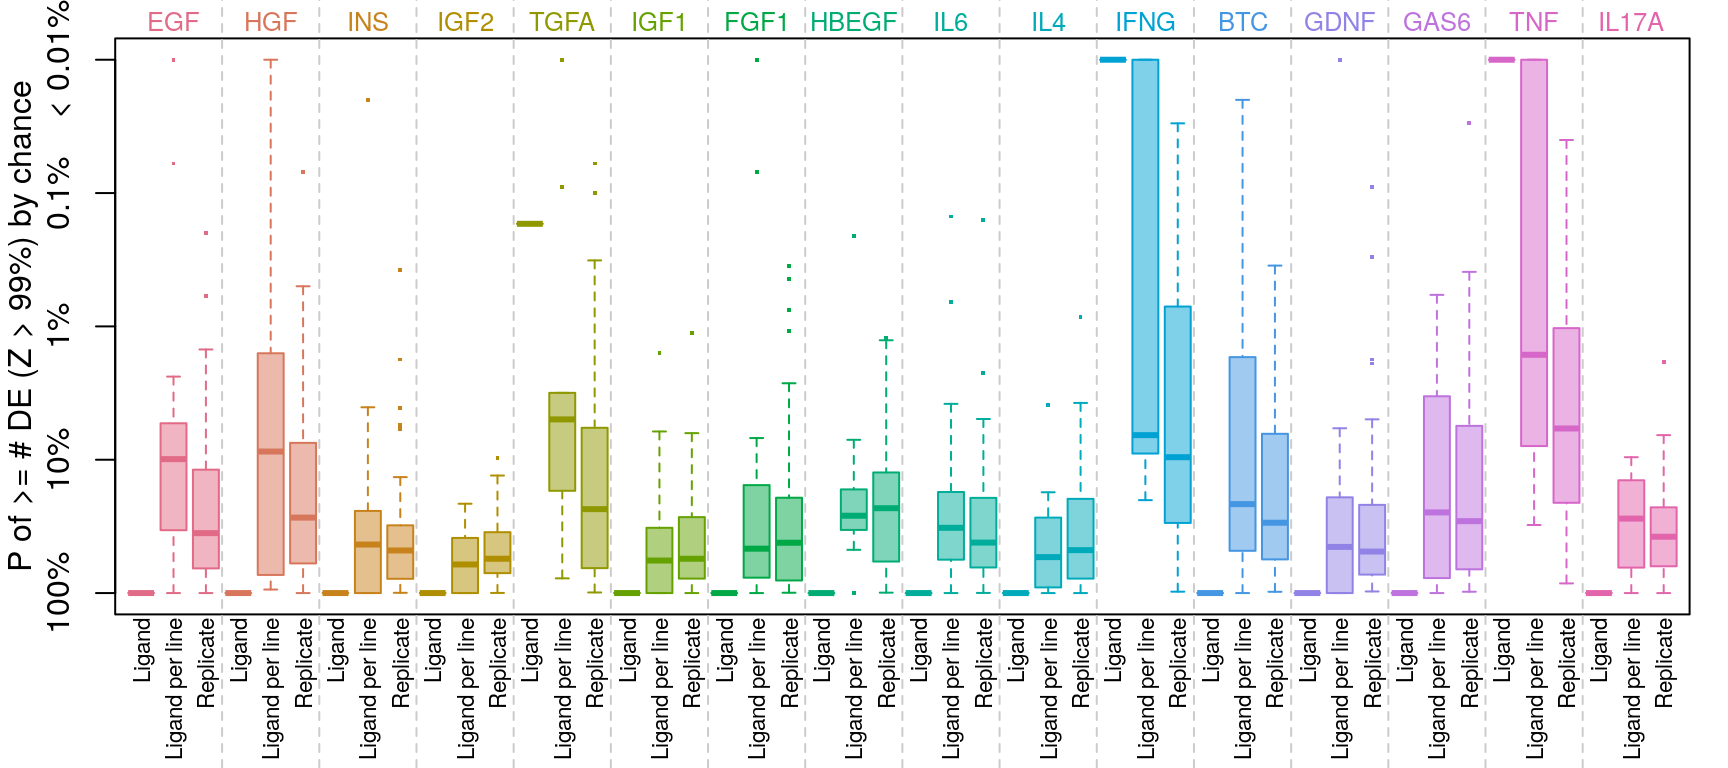
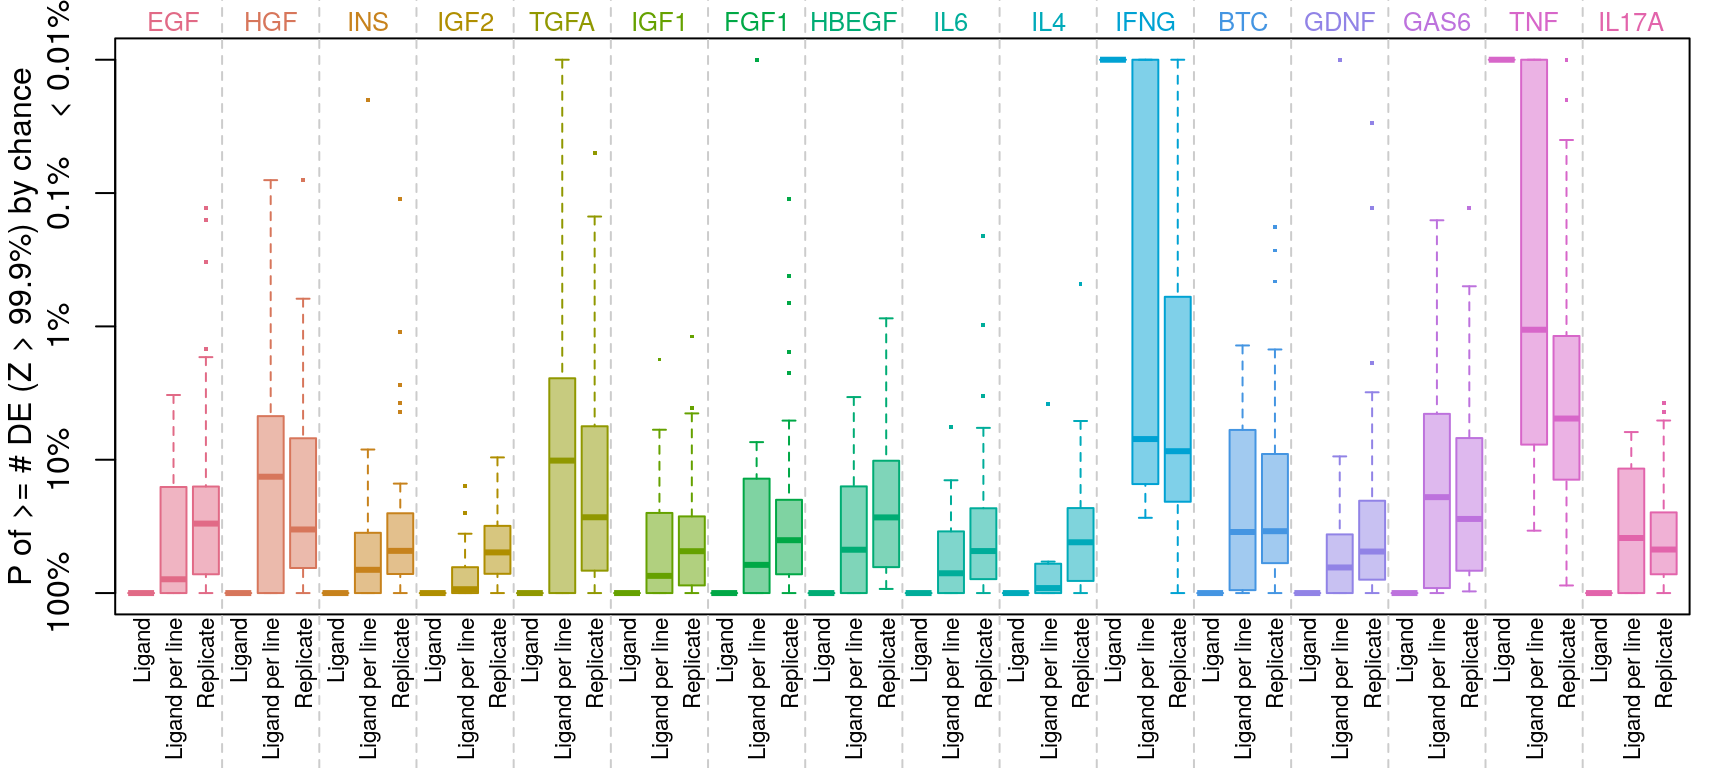
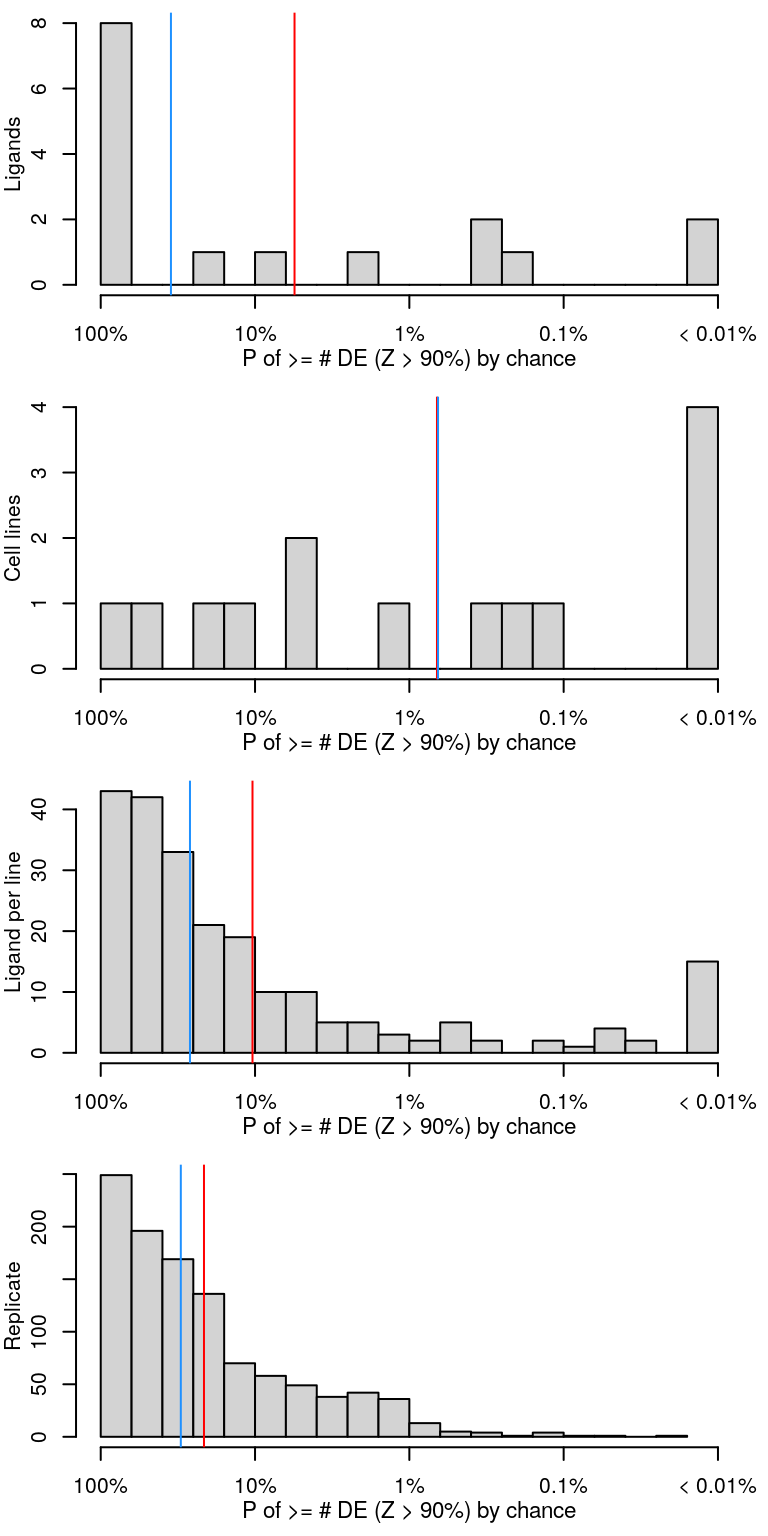
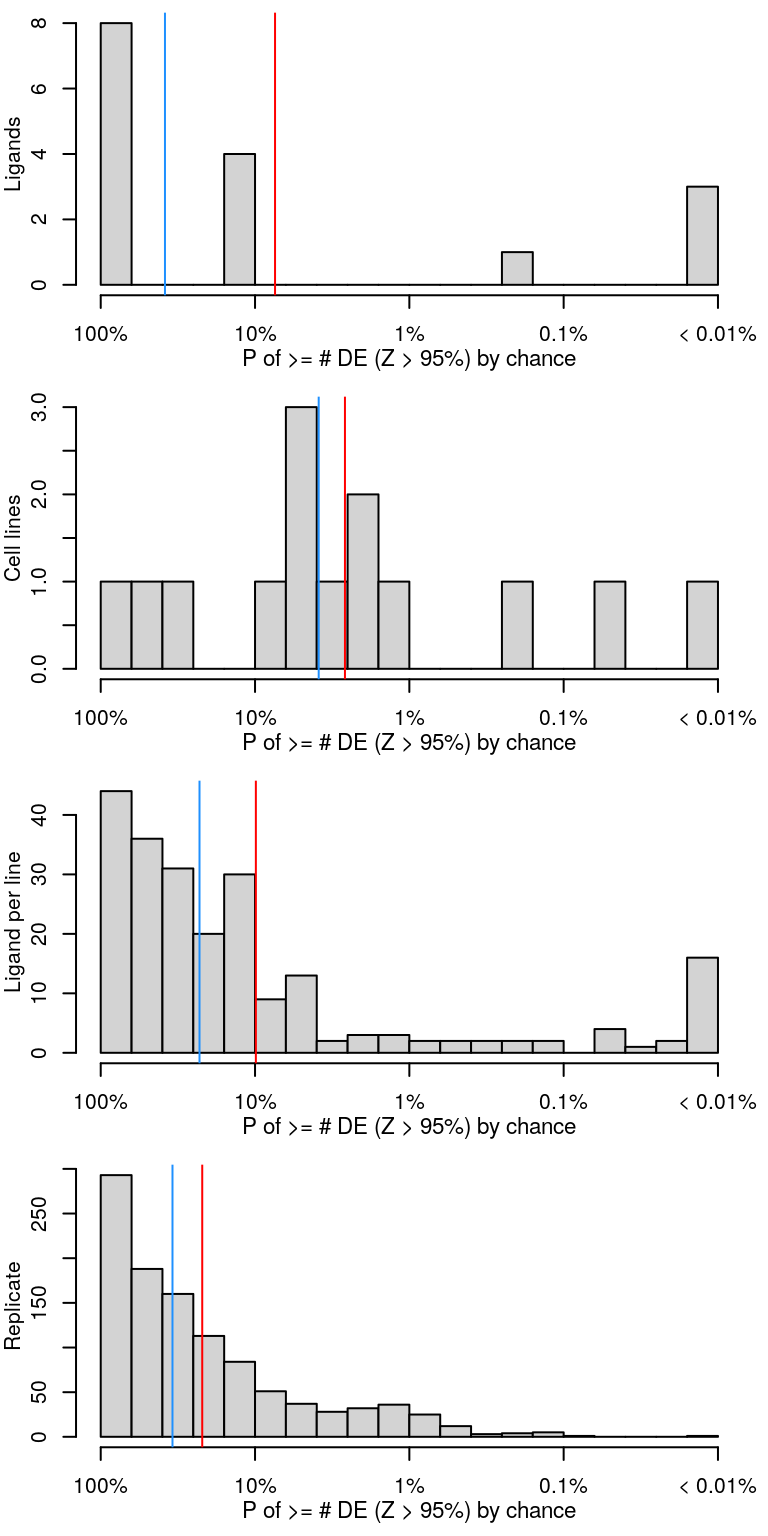
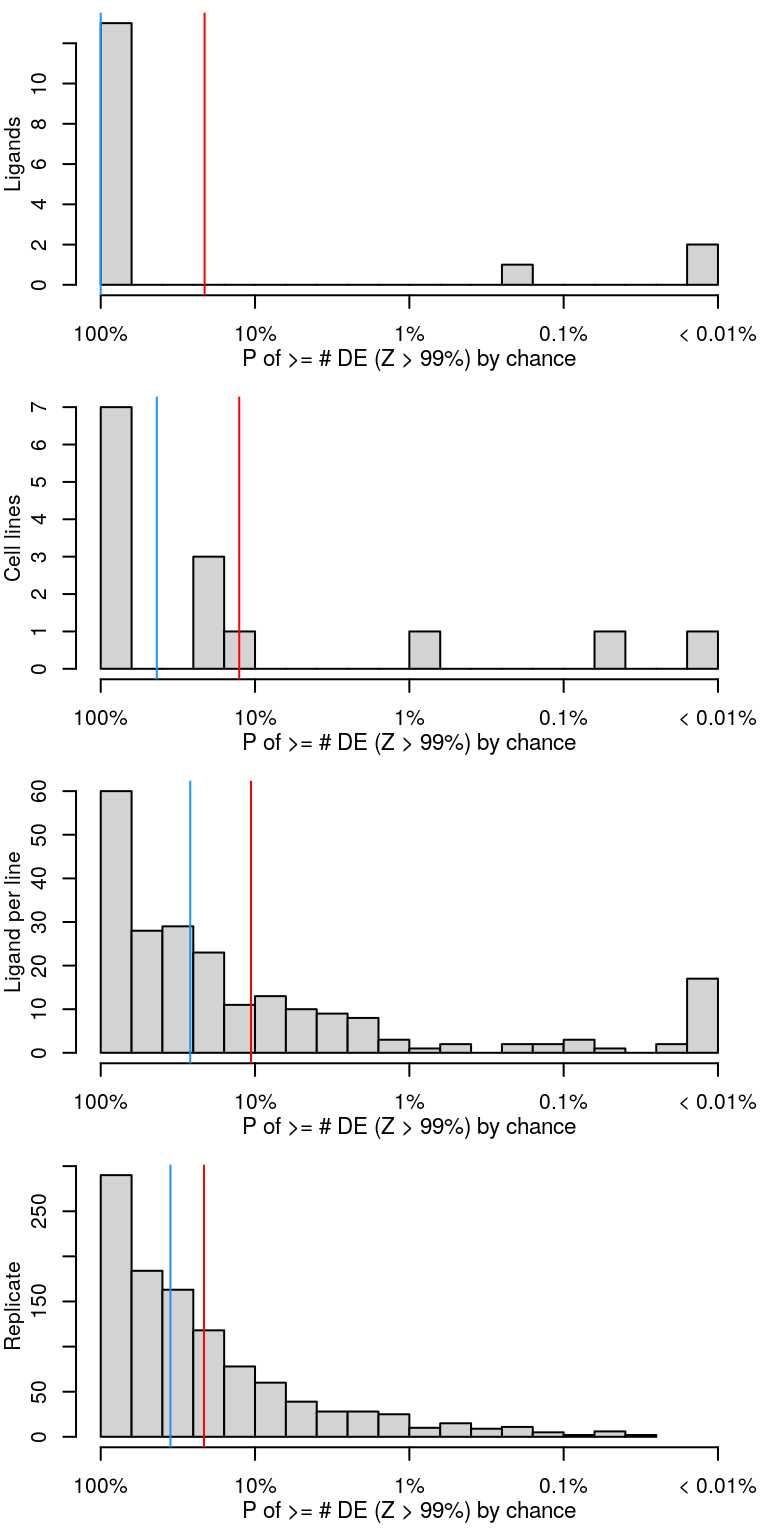
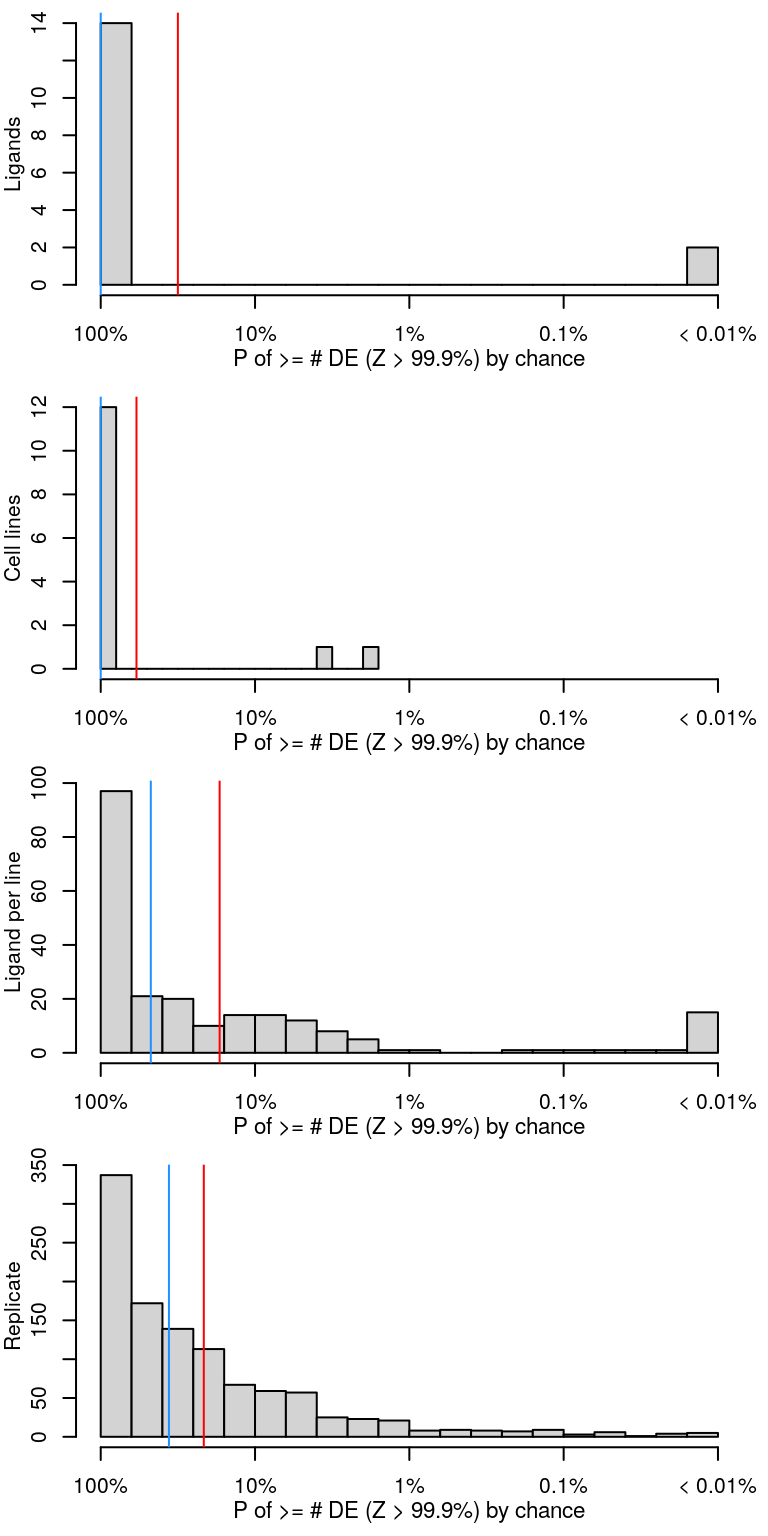
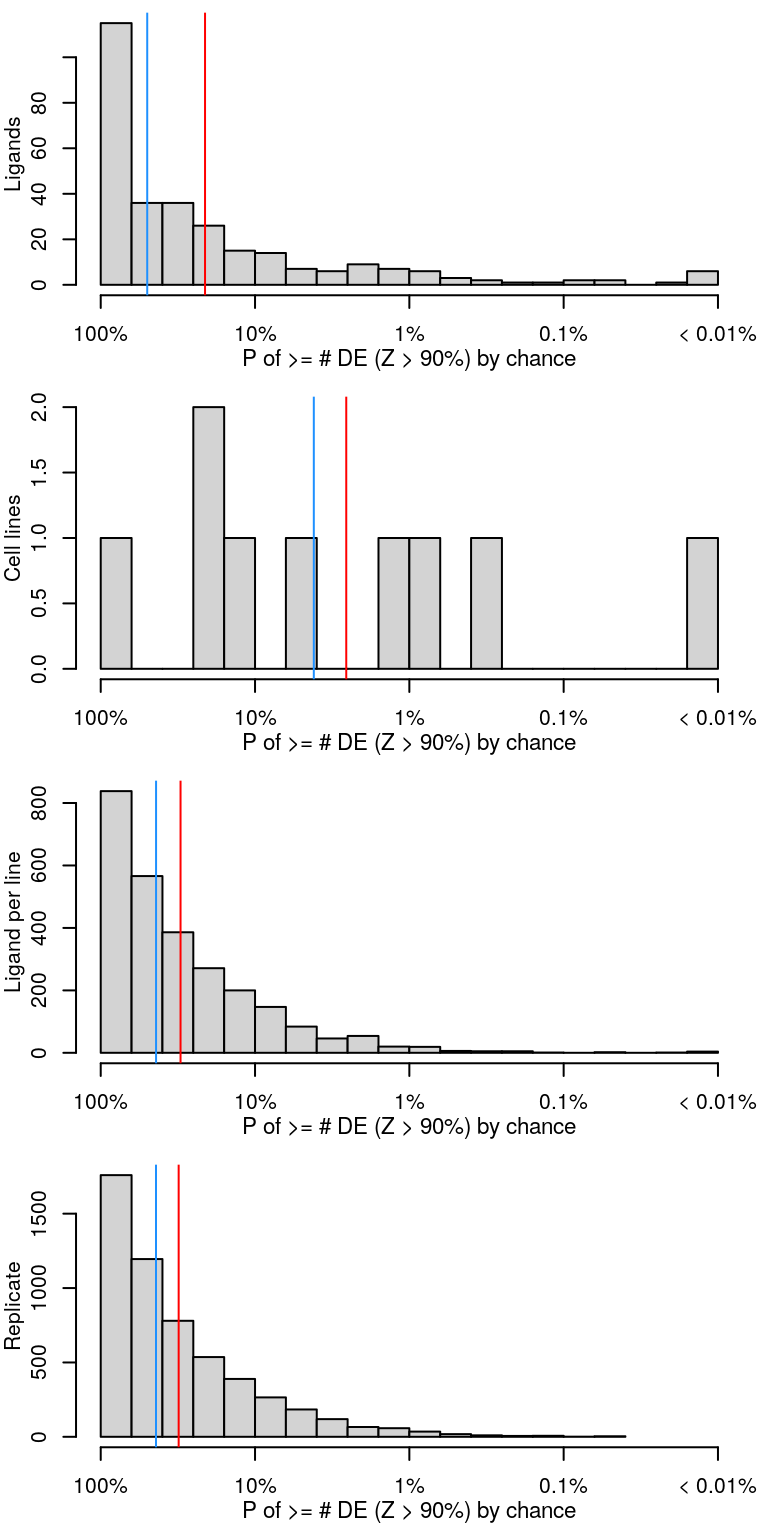
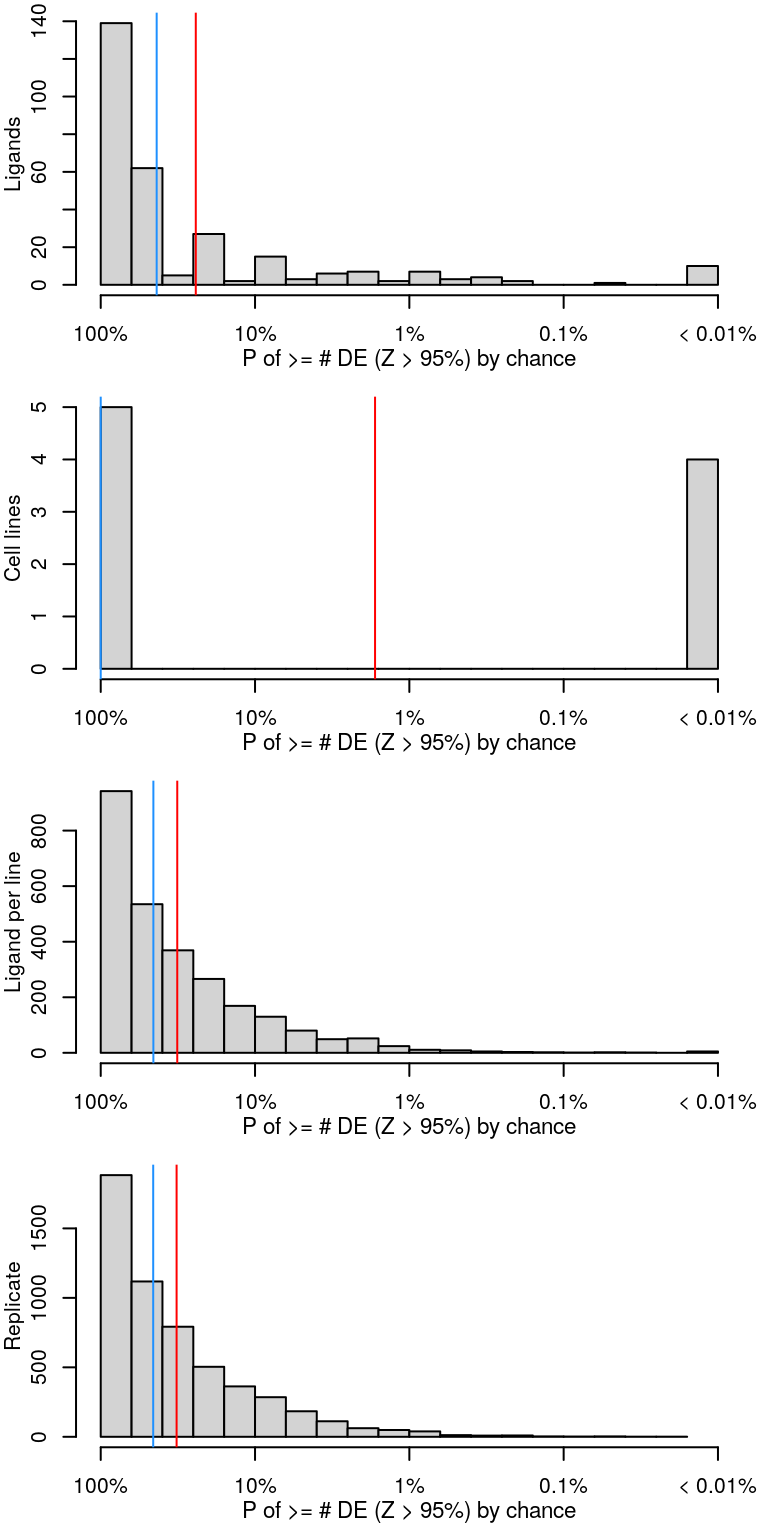
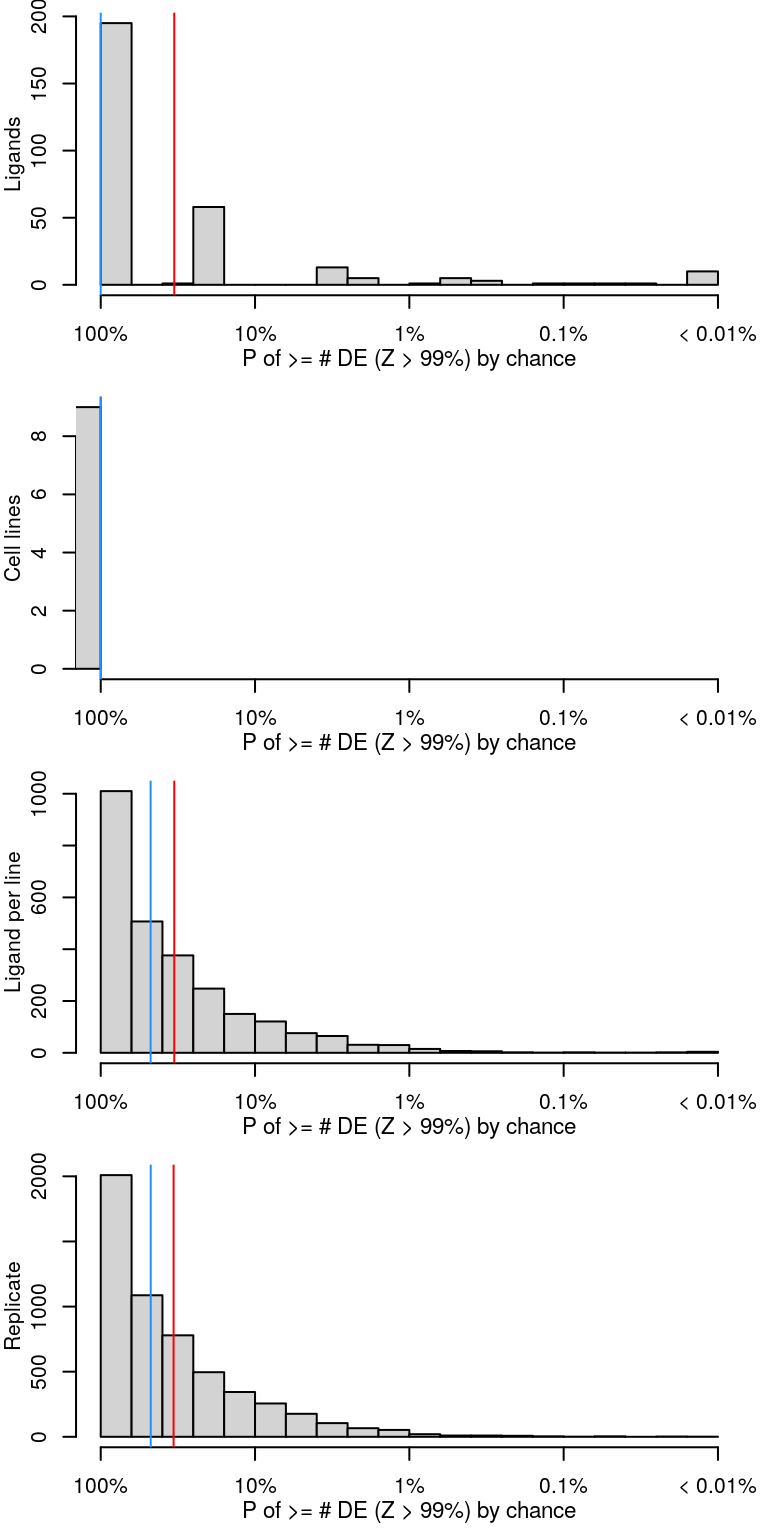
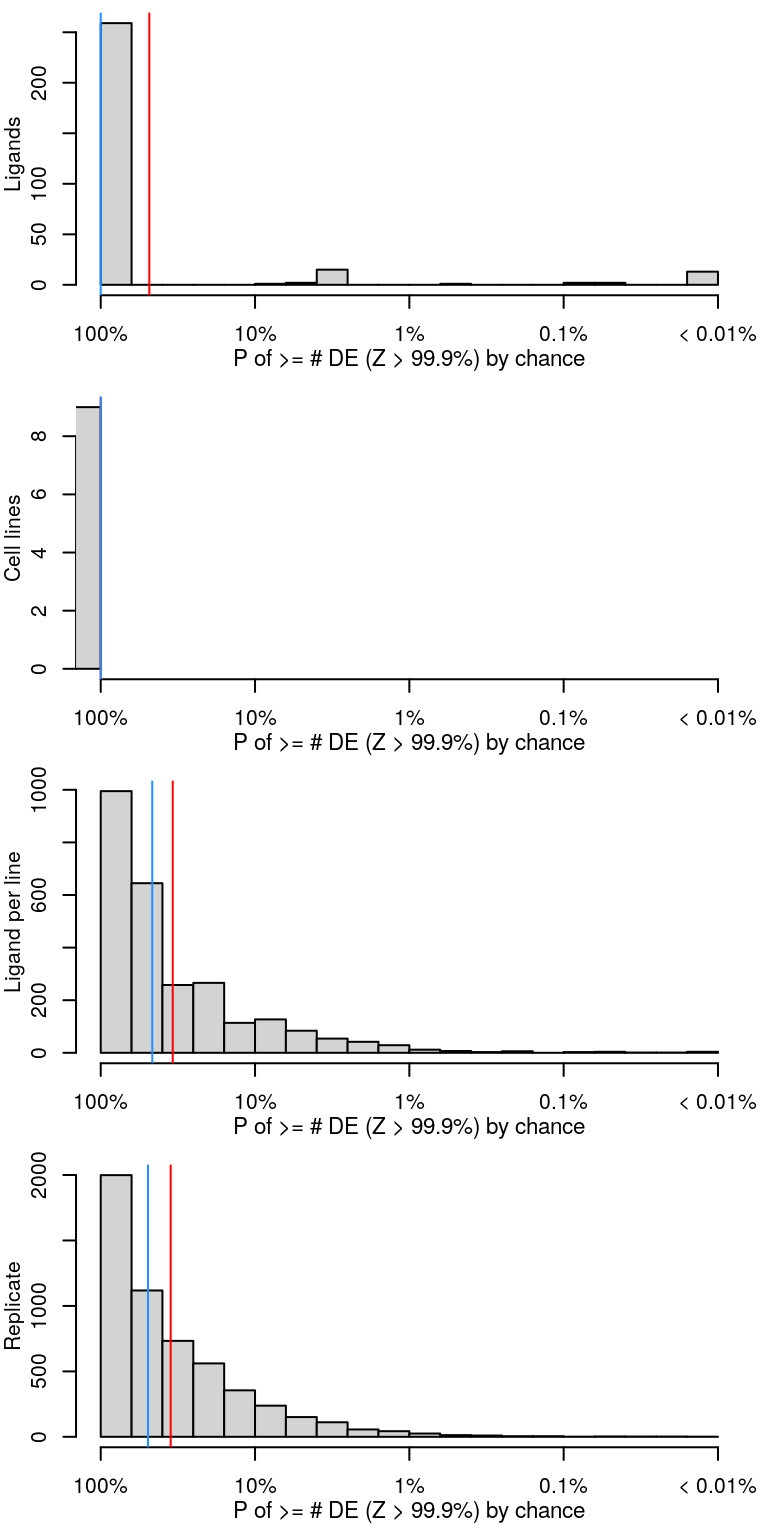
Calculating significantly differentially expressed genes by Z-score threshold (90th, 95th, and 99th percentile). No weighting during averaging (unlike Connectivity Map level 5 data, which weights correlated replicates higher).
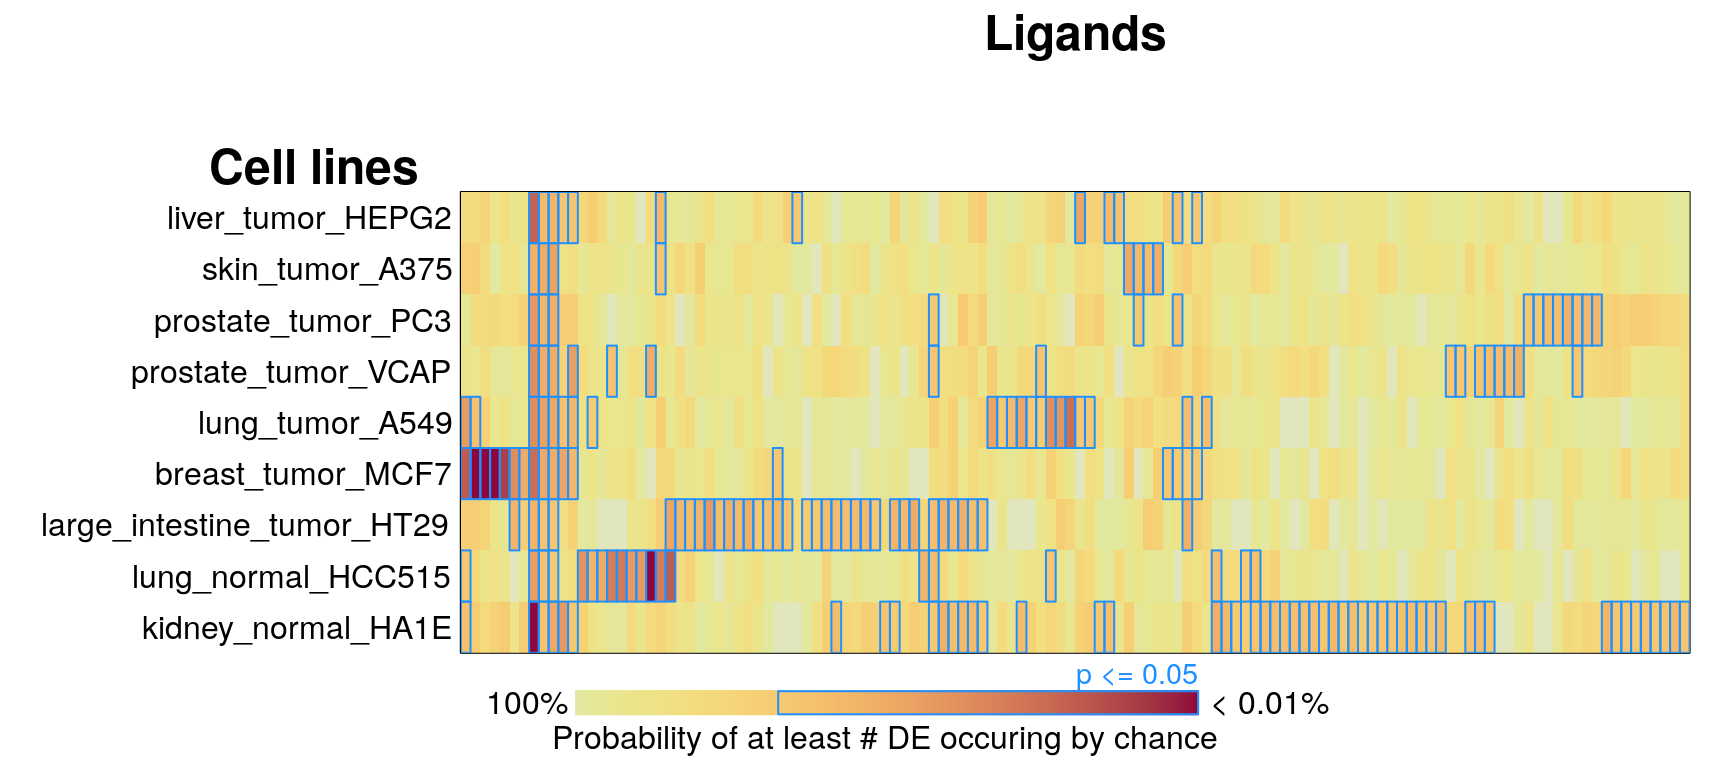
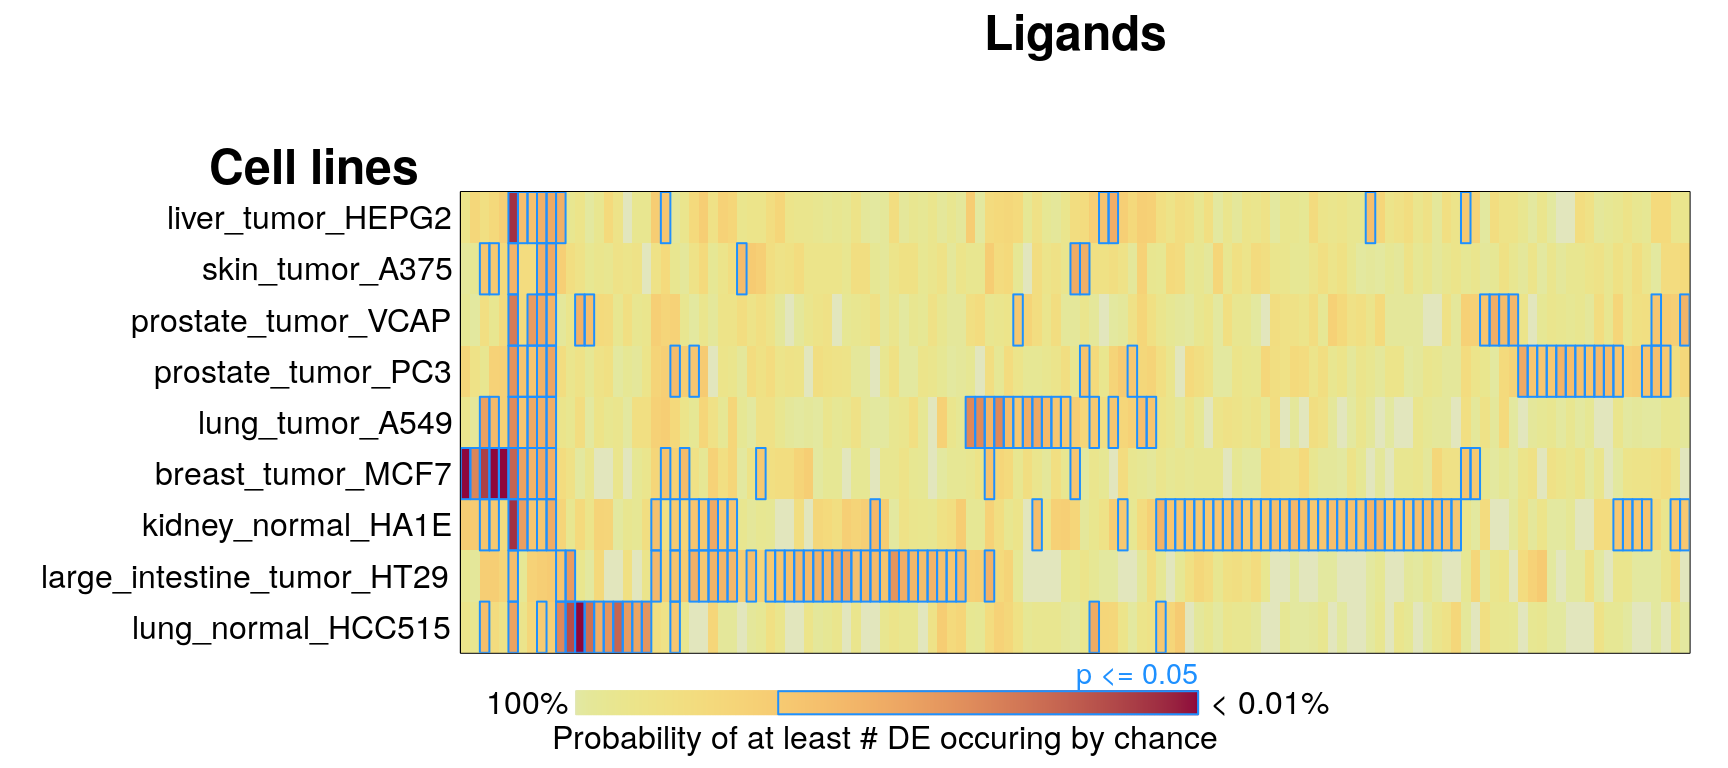
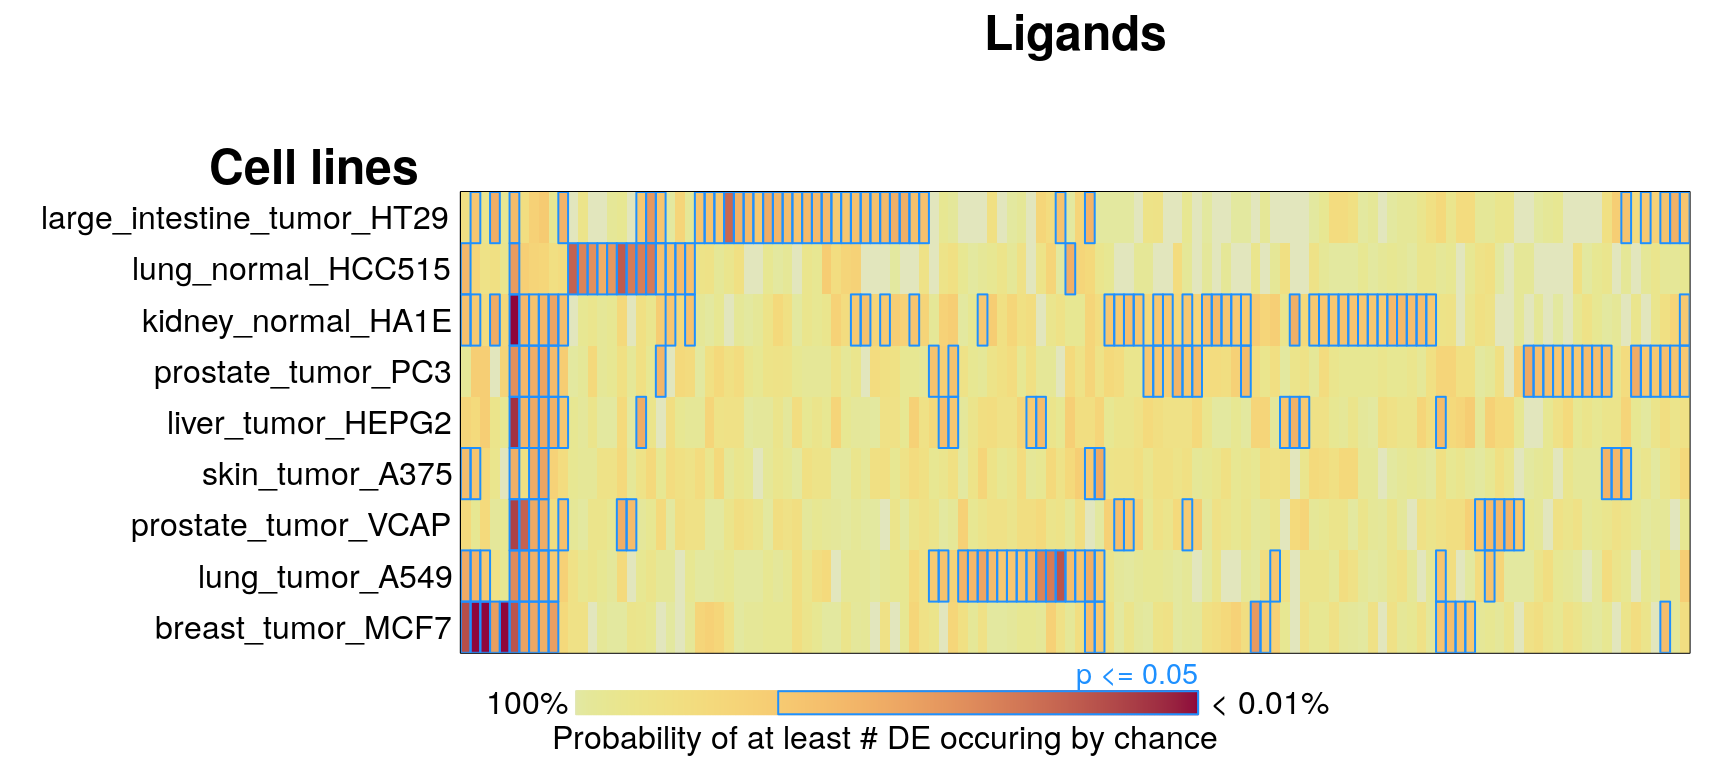
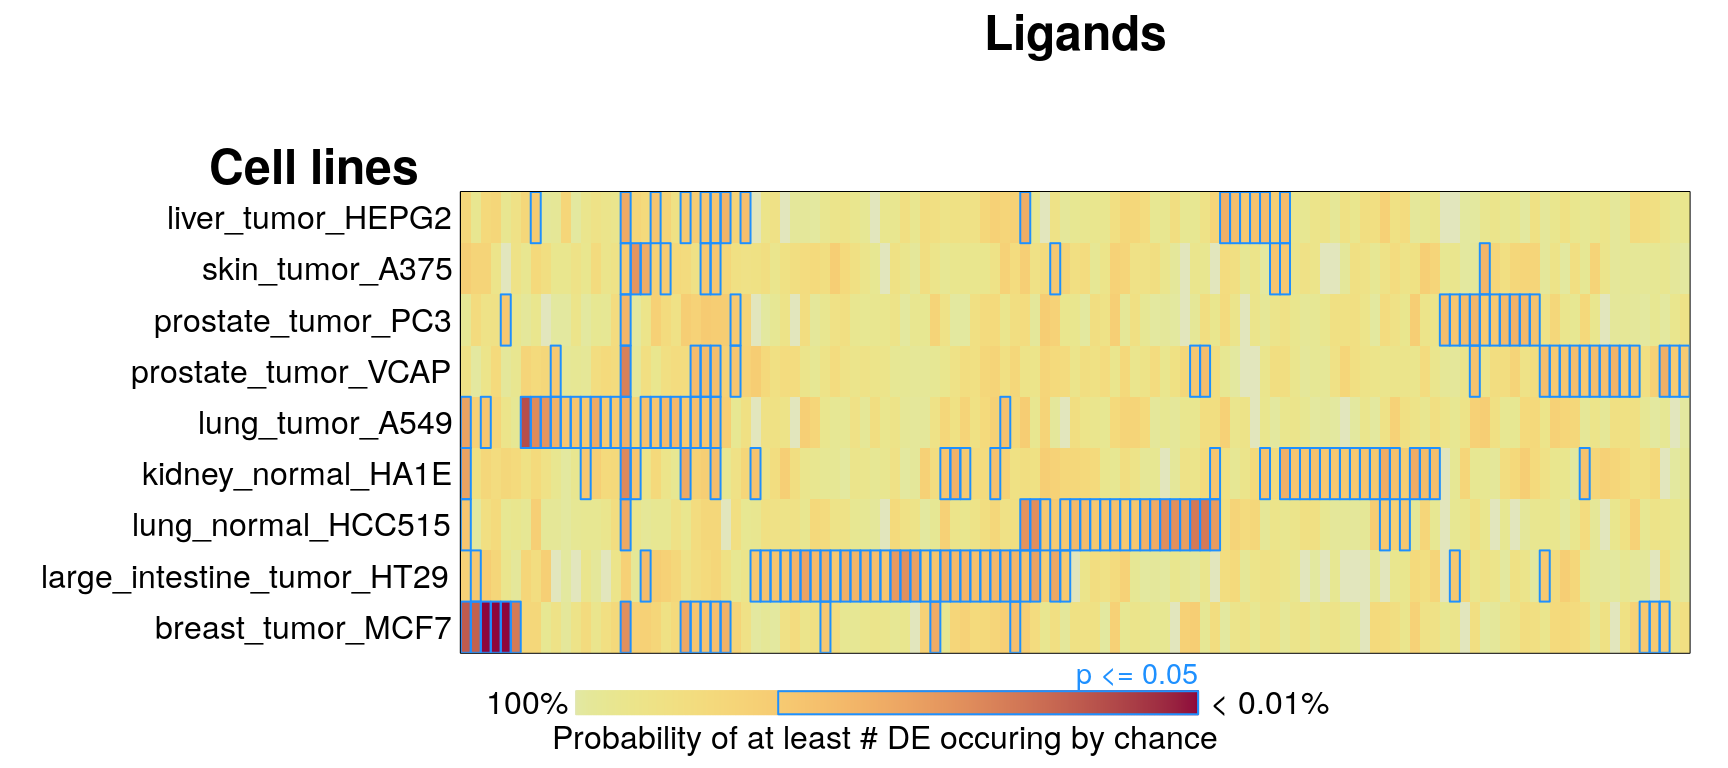
Averaging per ligand
16 ligands, ‘landmark’ genes only
16 ligands, all genes (including inferred)
295 ligands, ‘landmark’ genes only
295 ligands, all genes (including inferred)
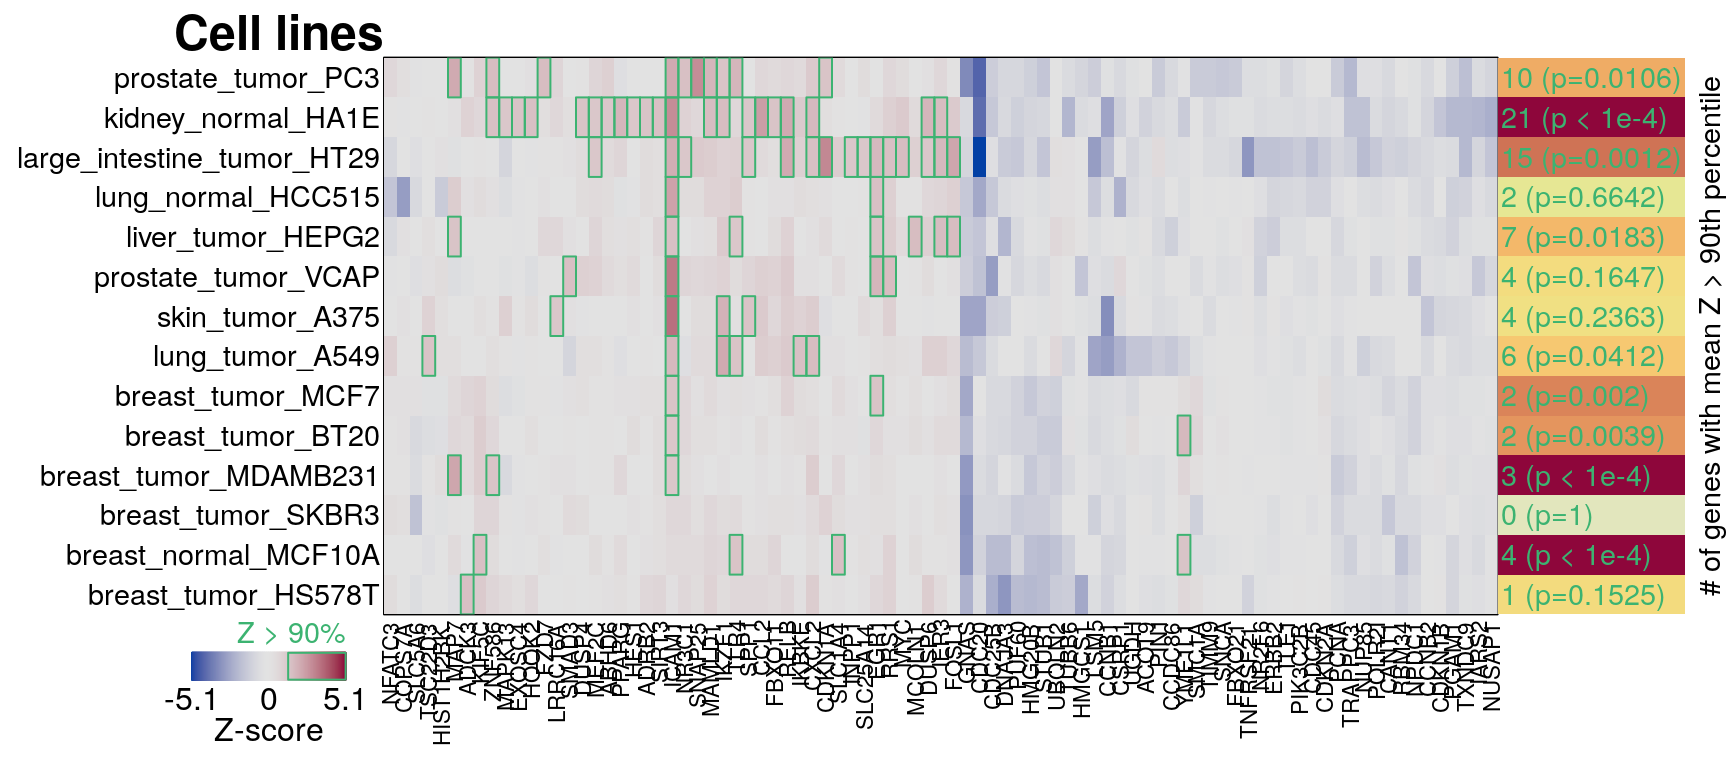
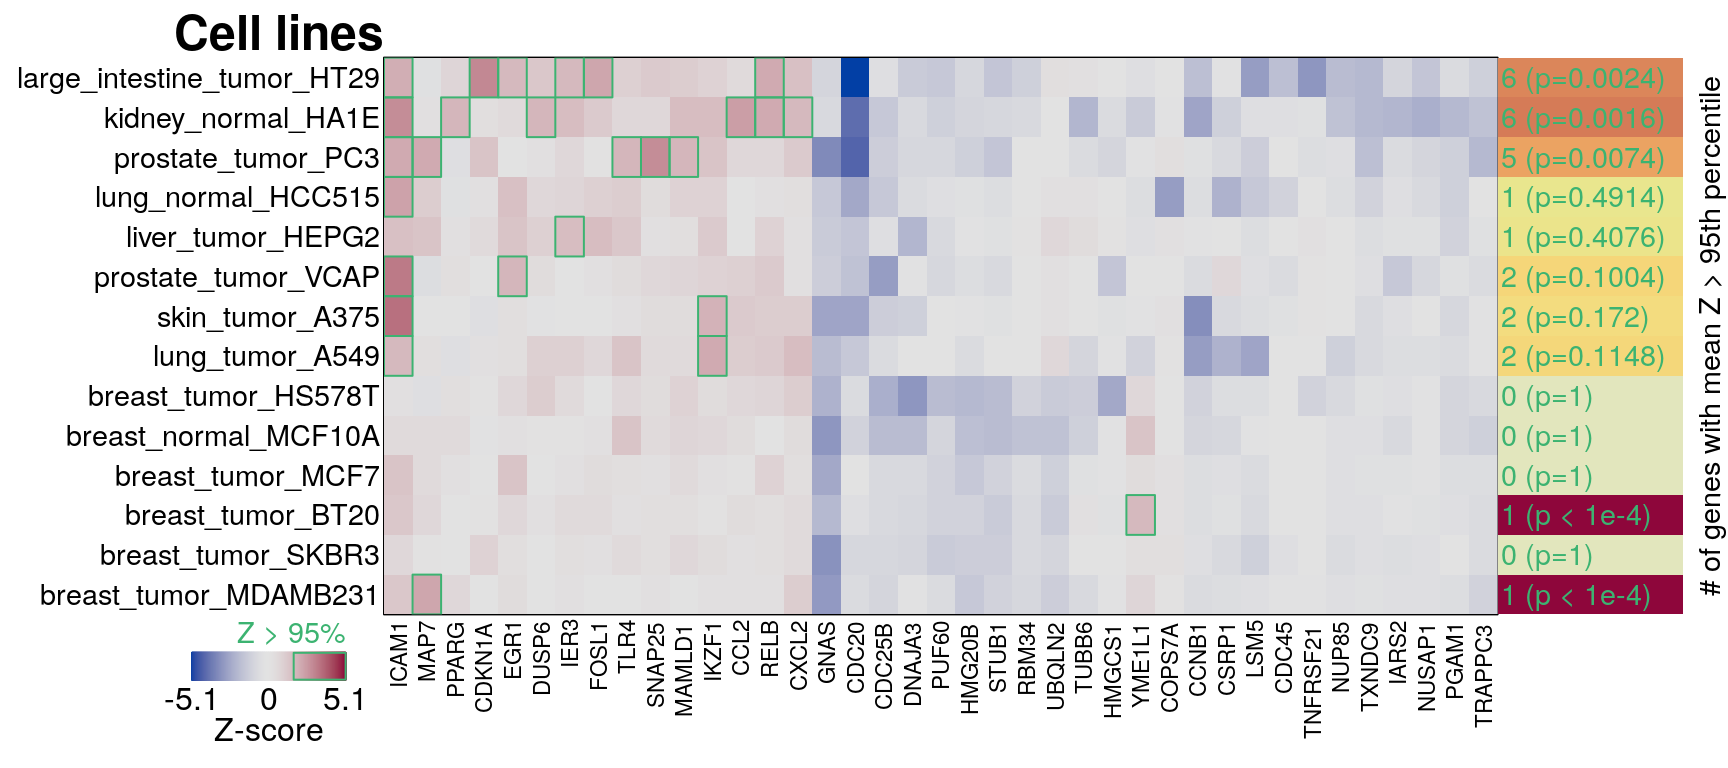
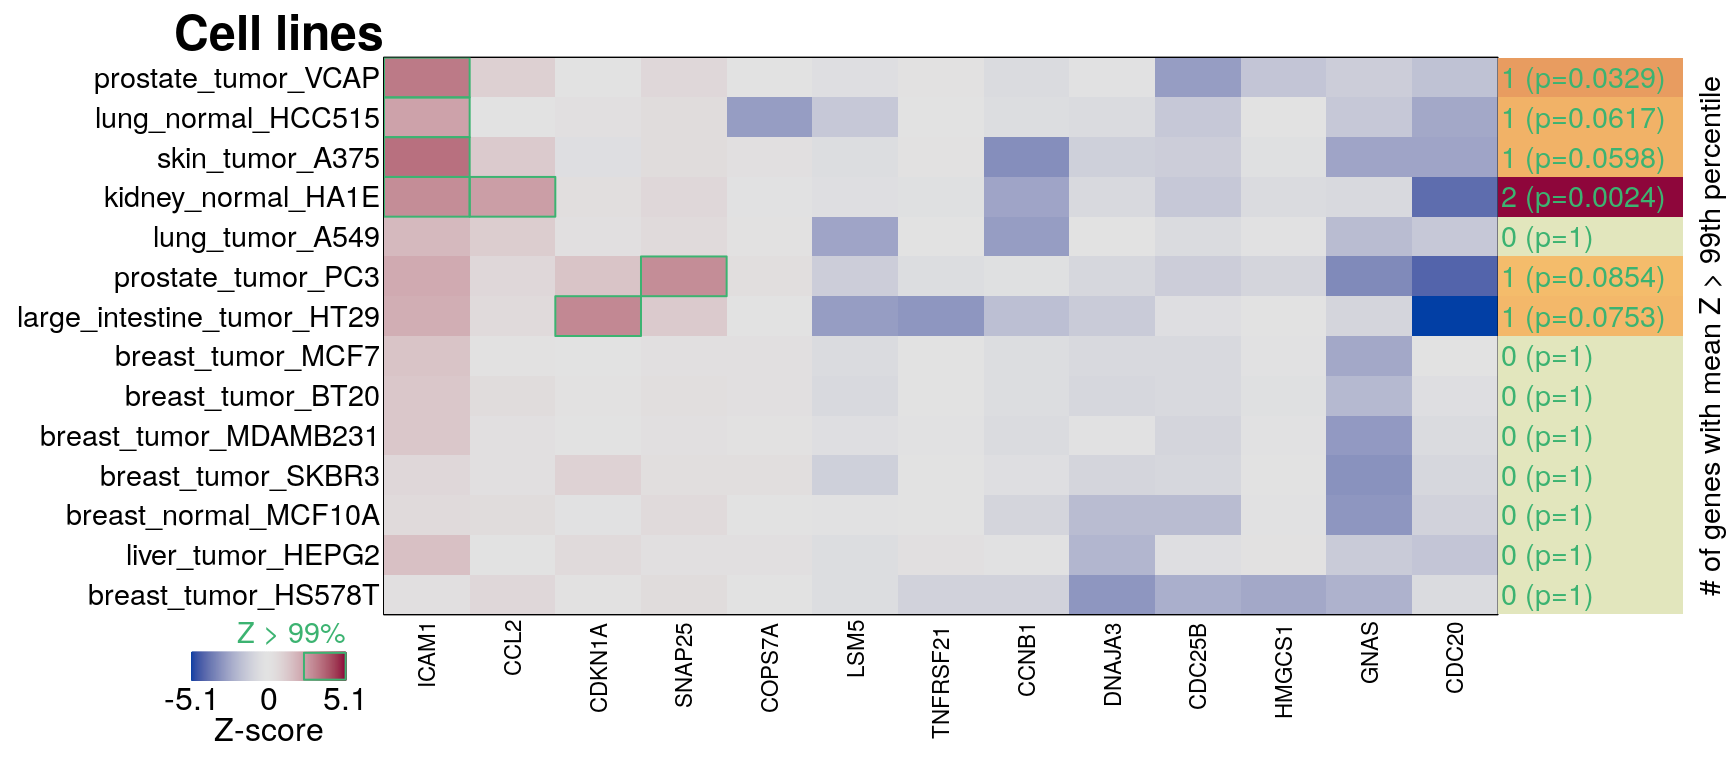
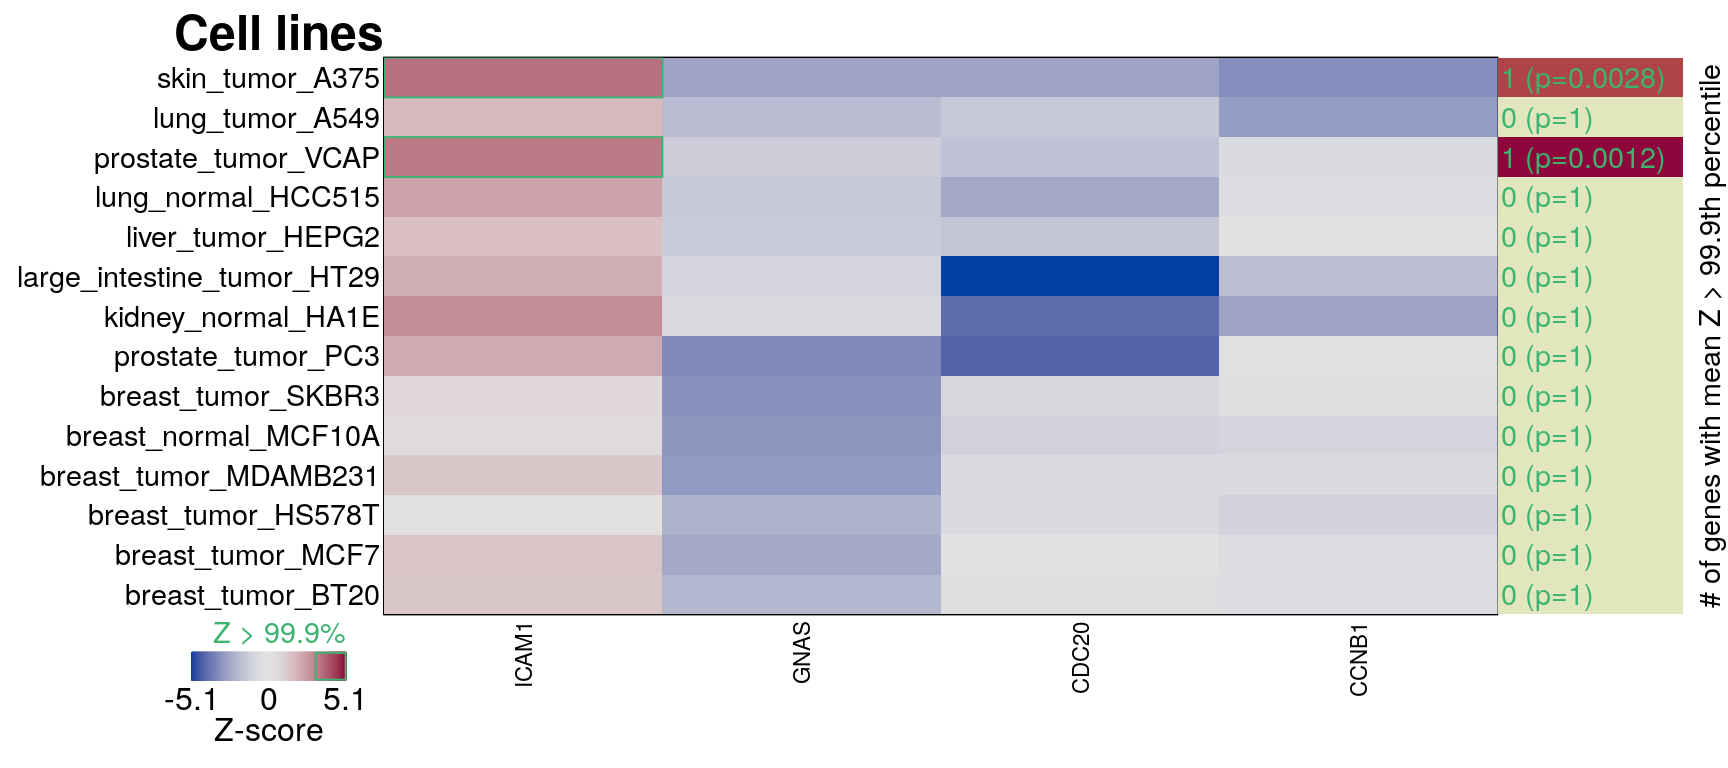
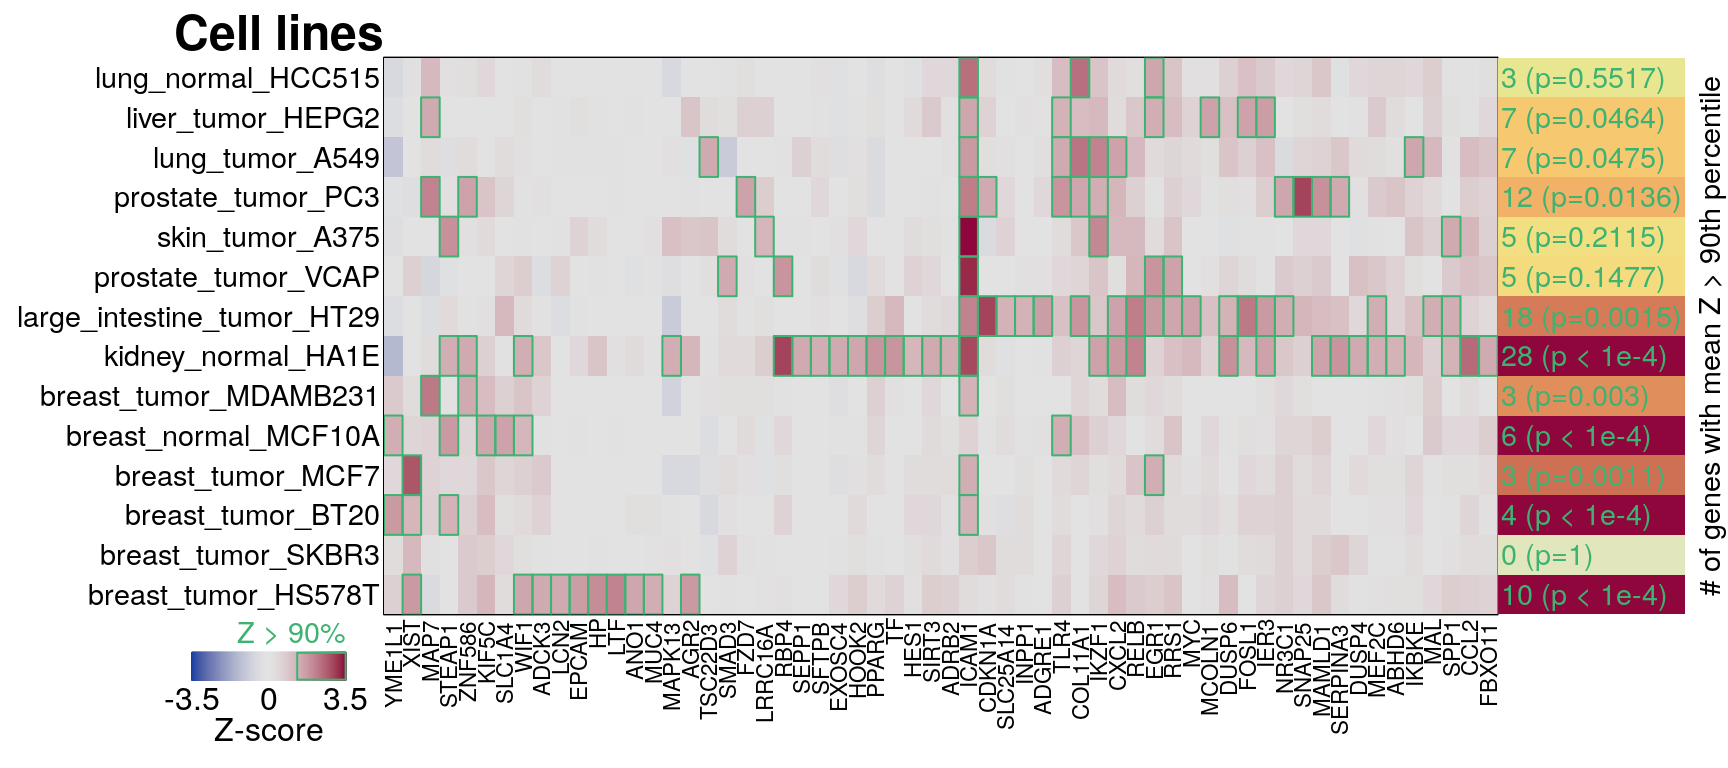
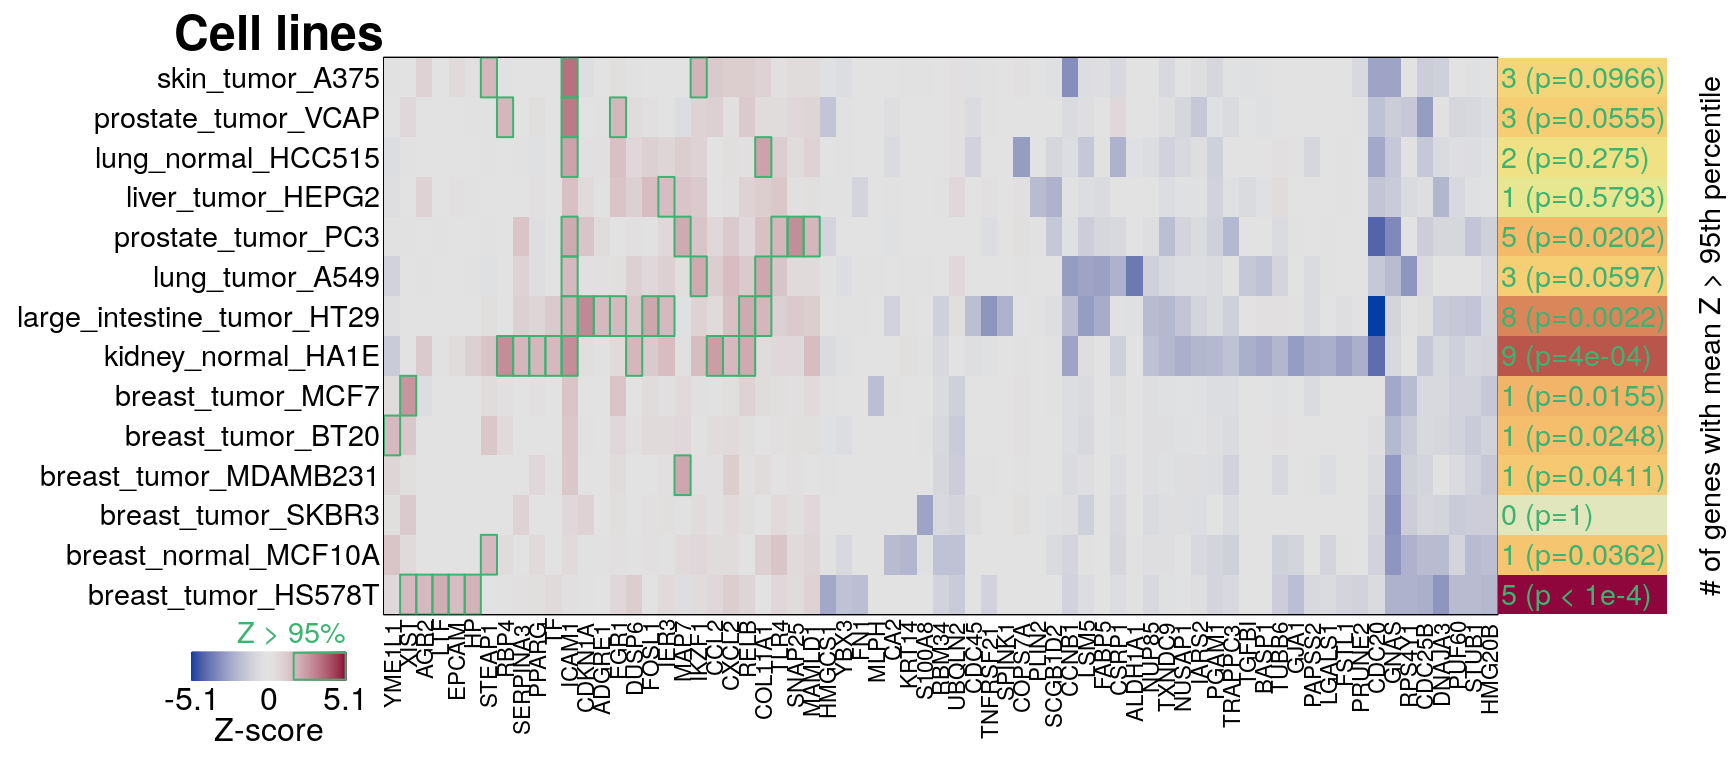
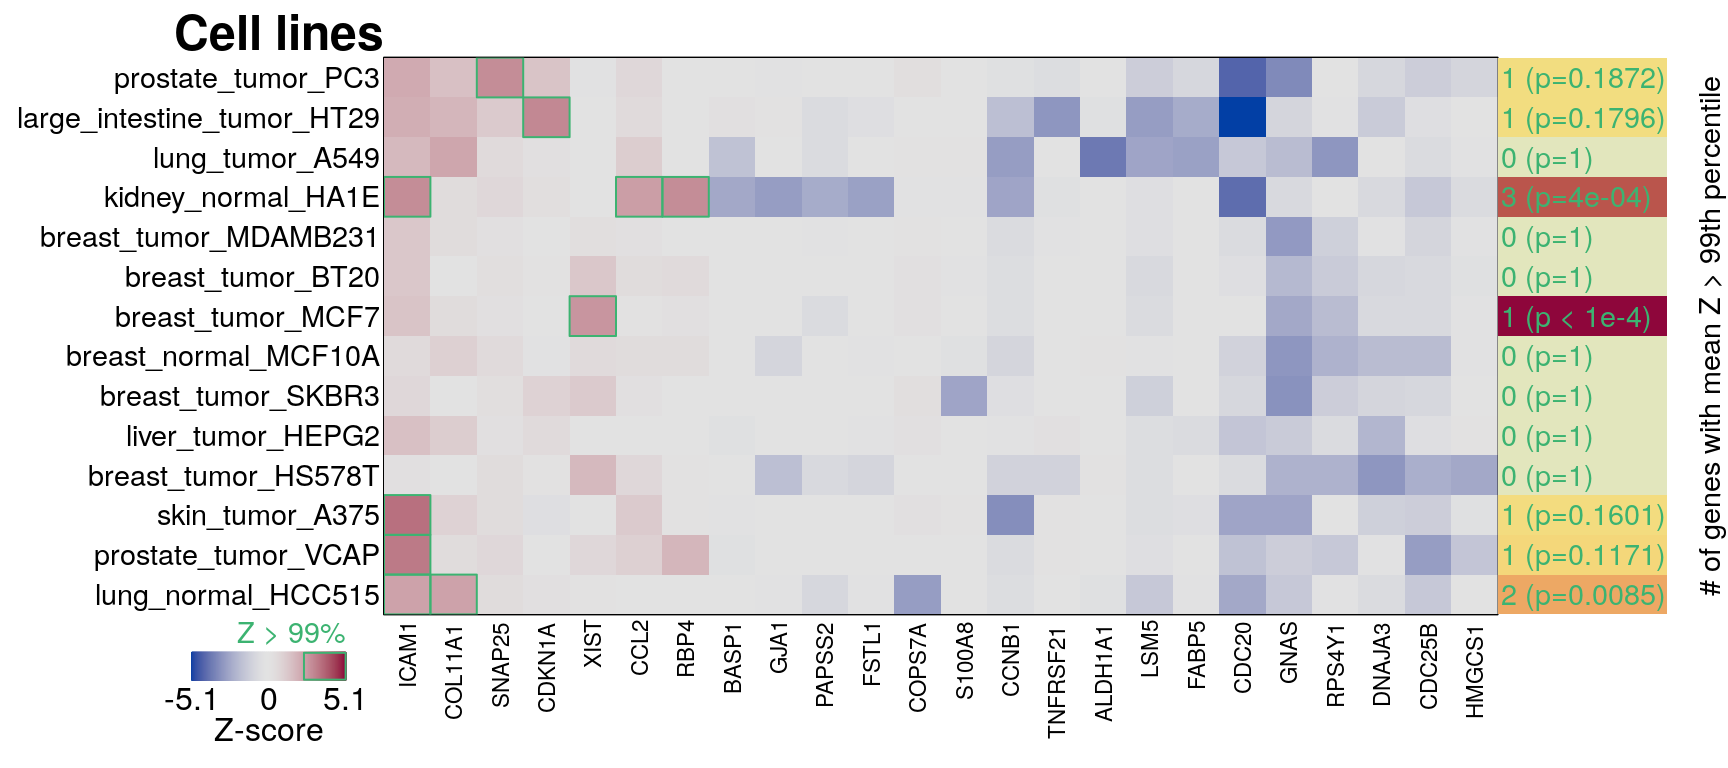
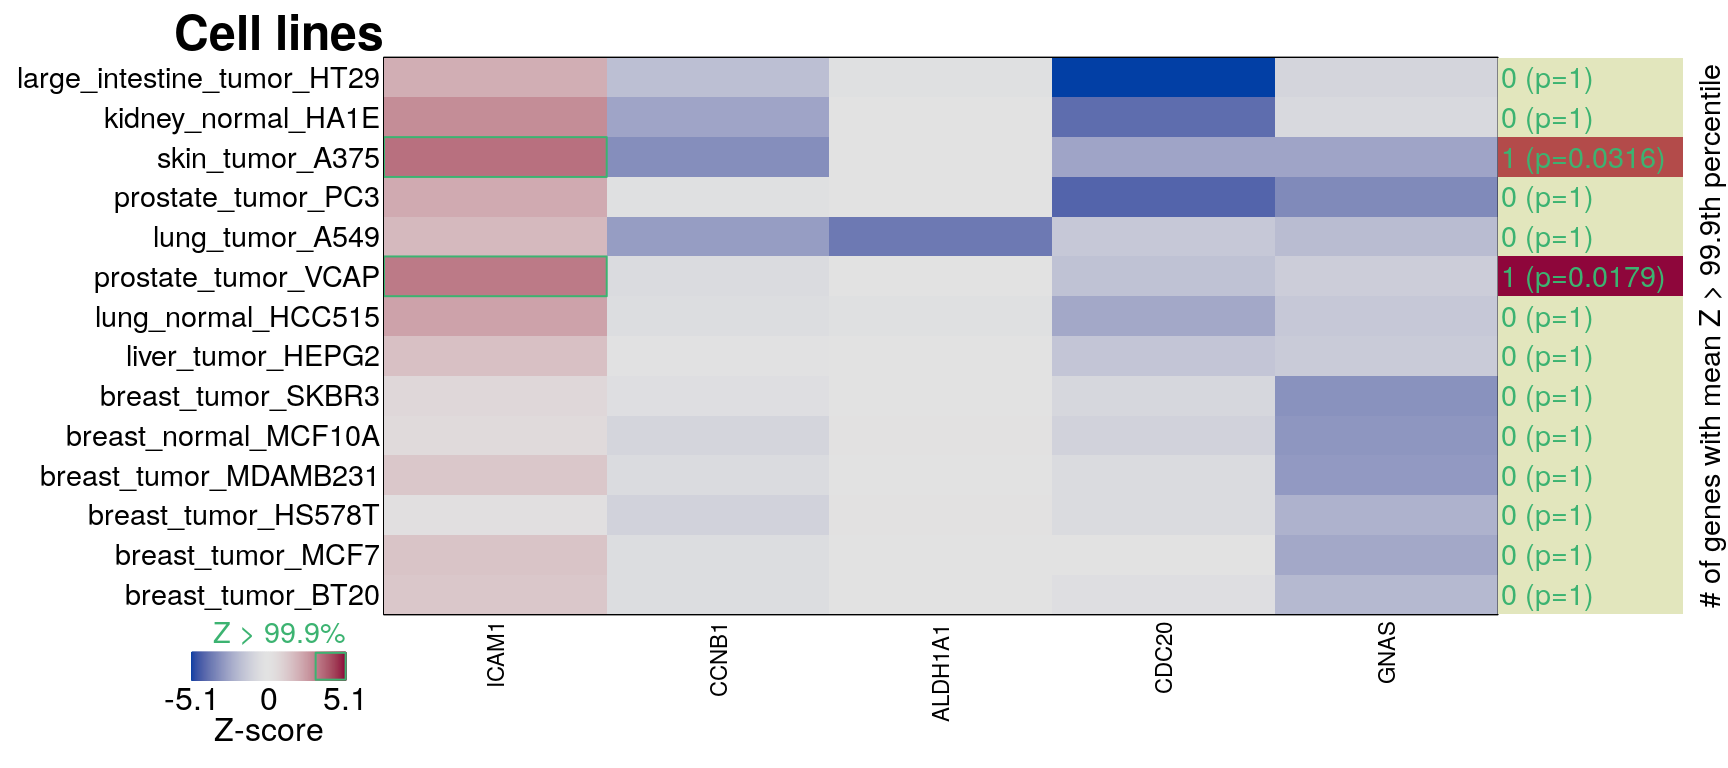
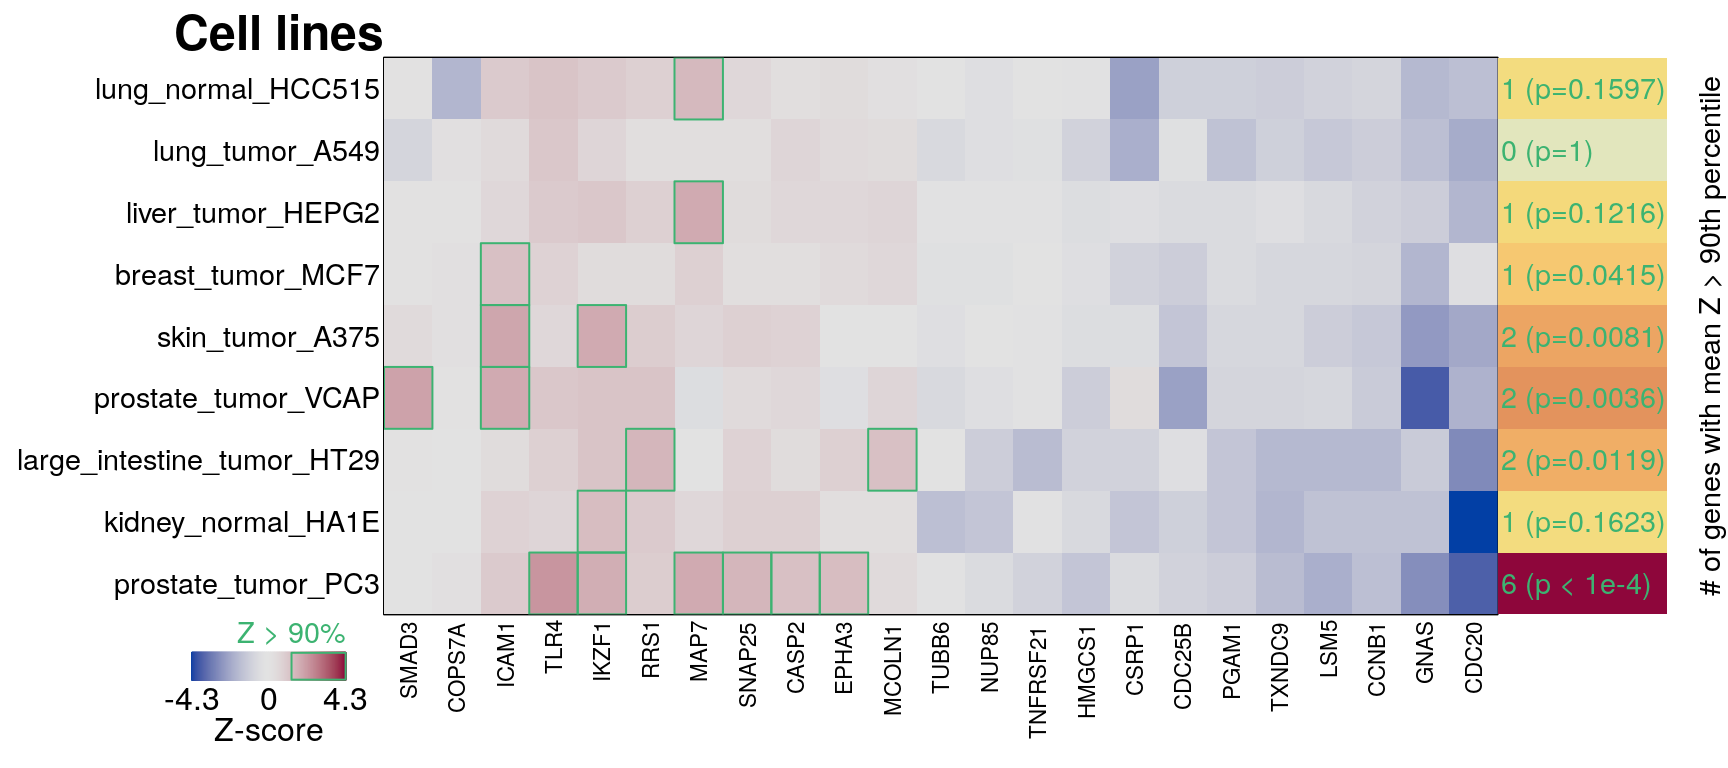
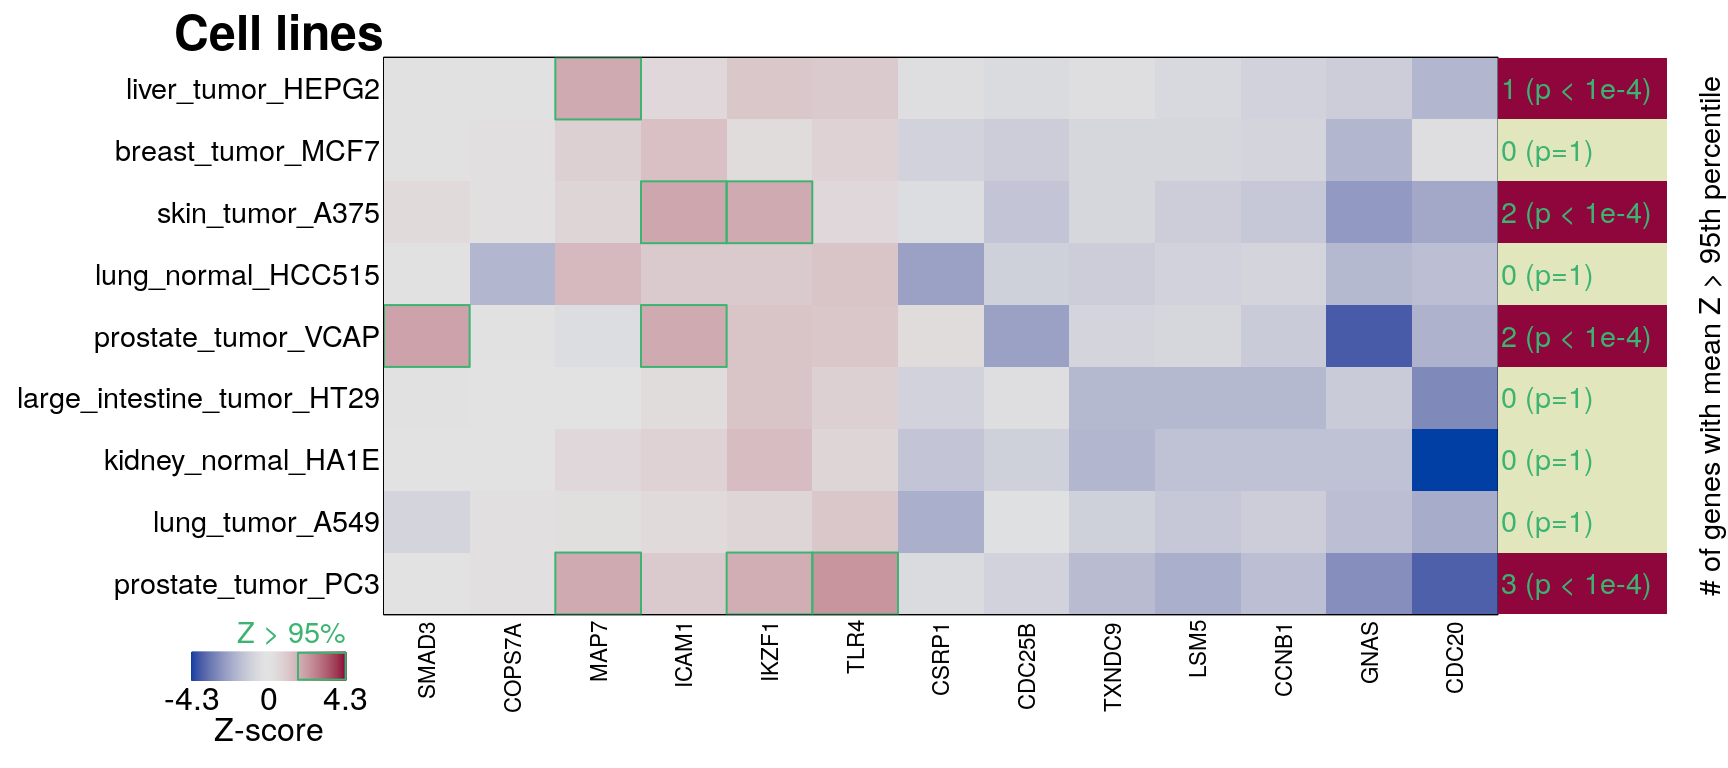
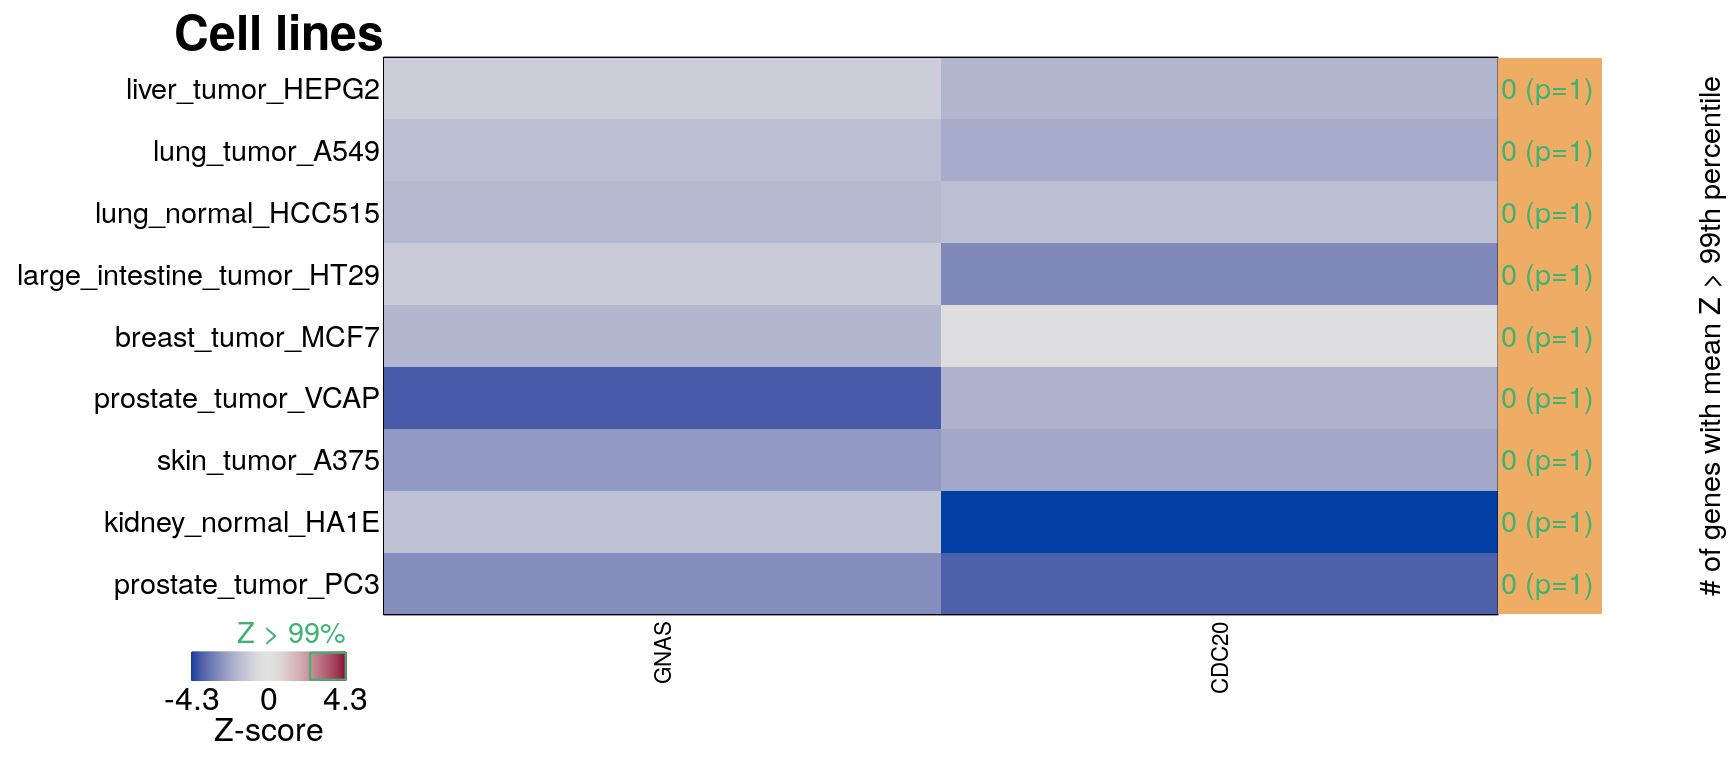
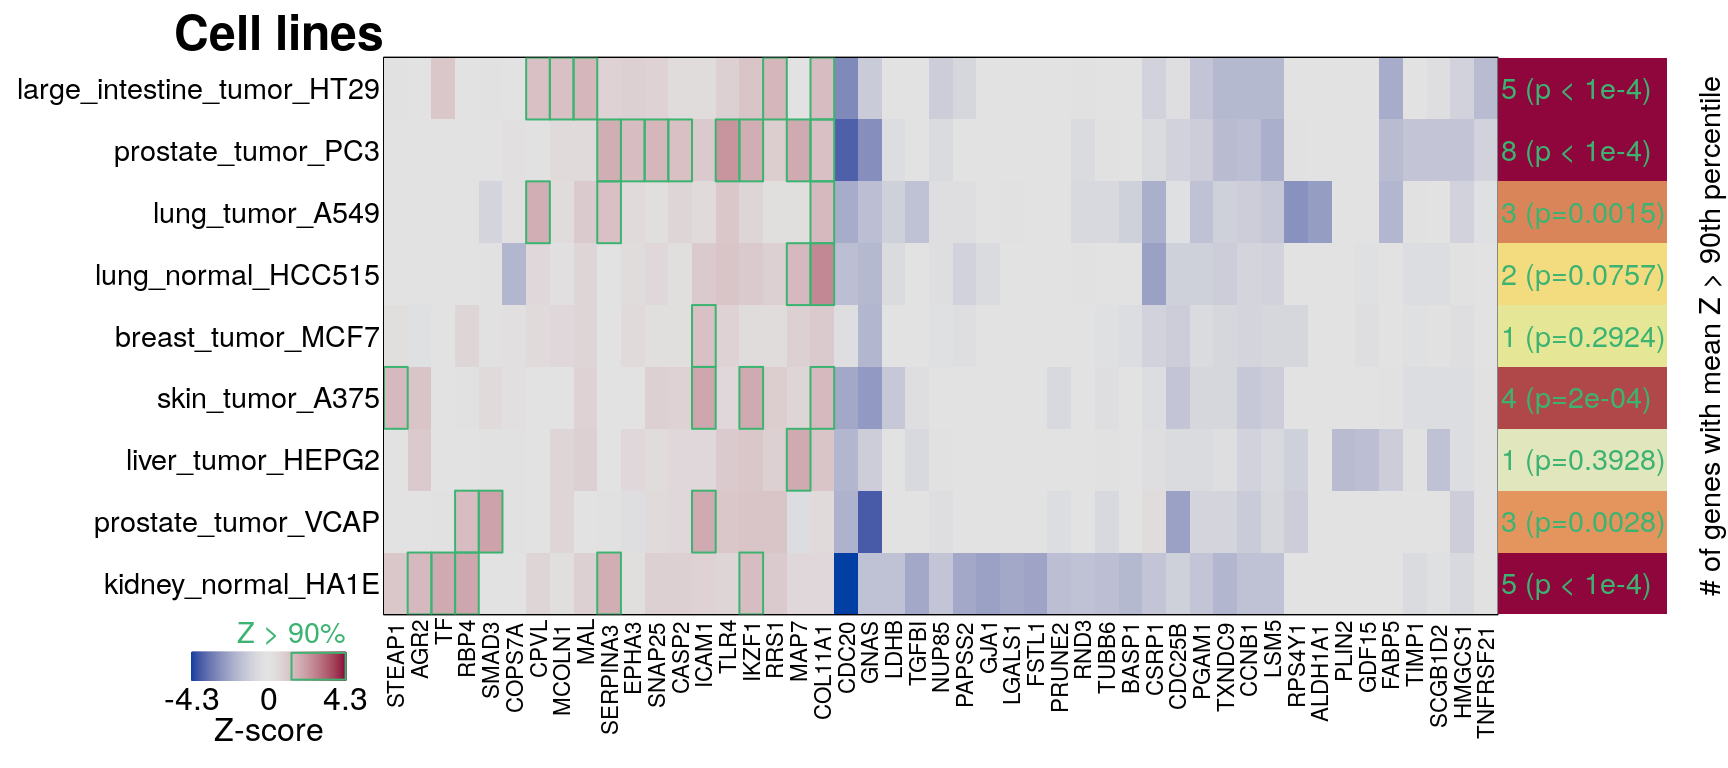
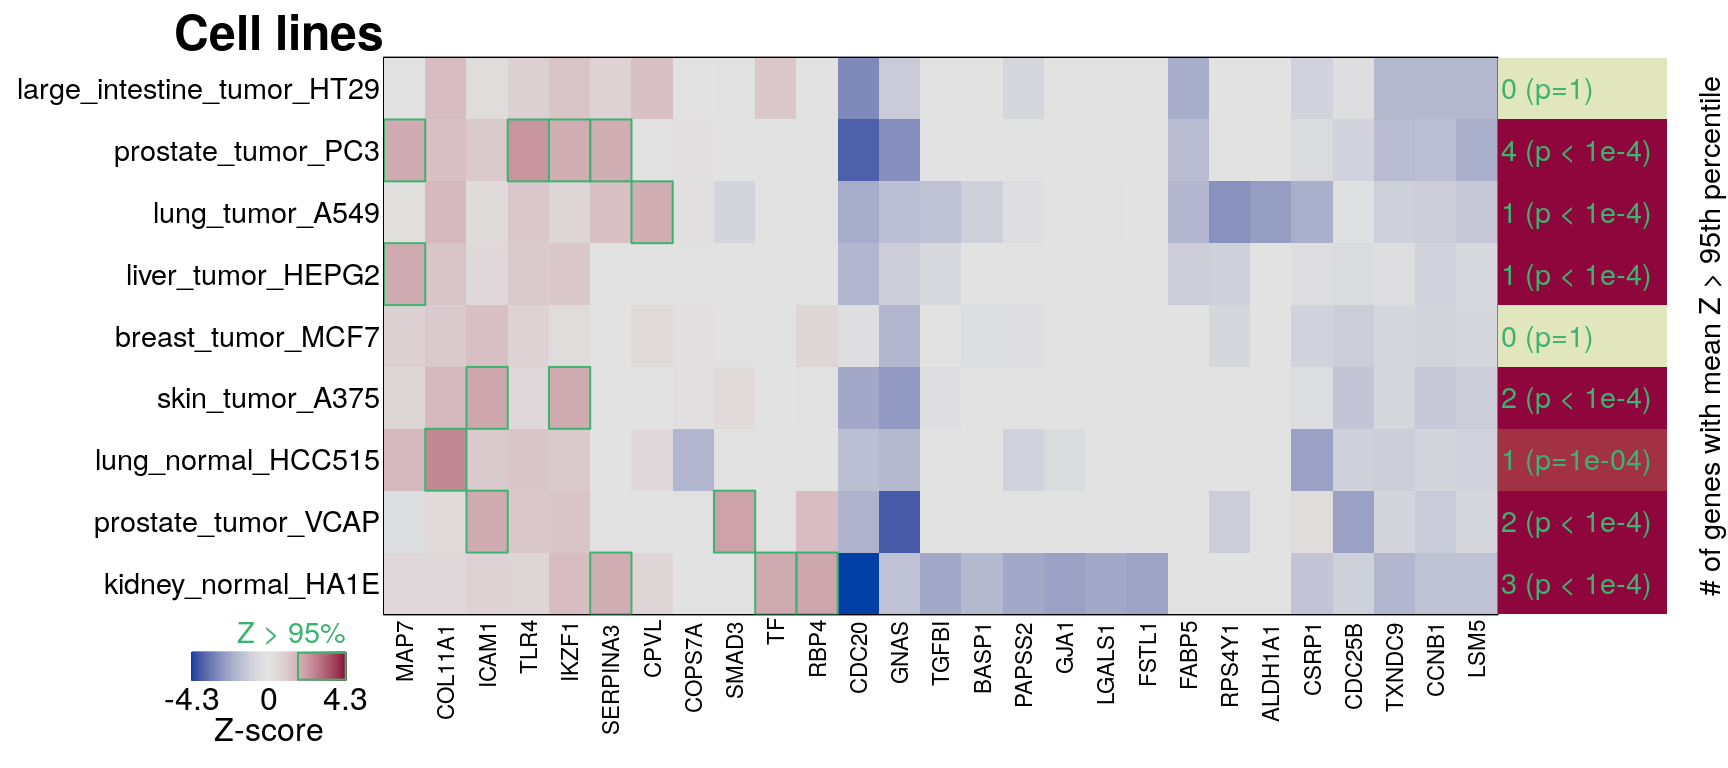
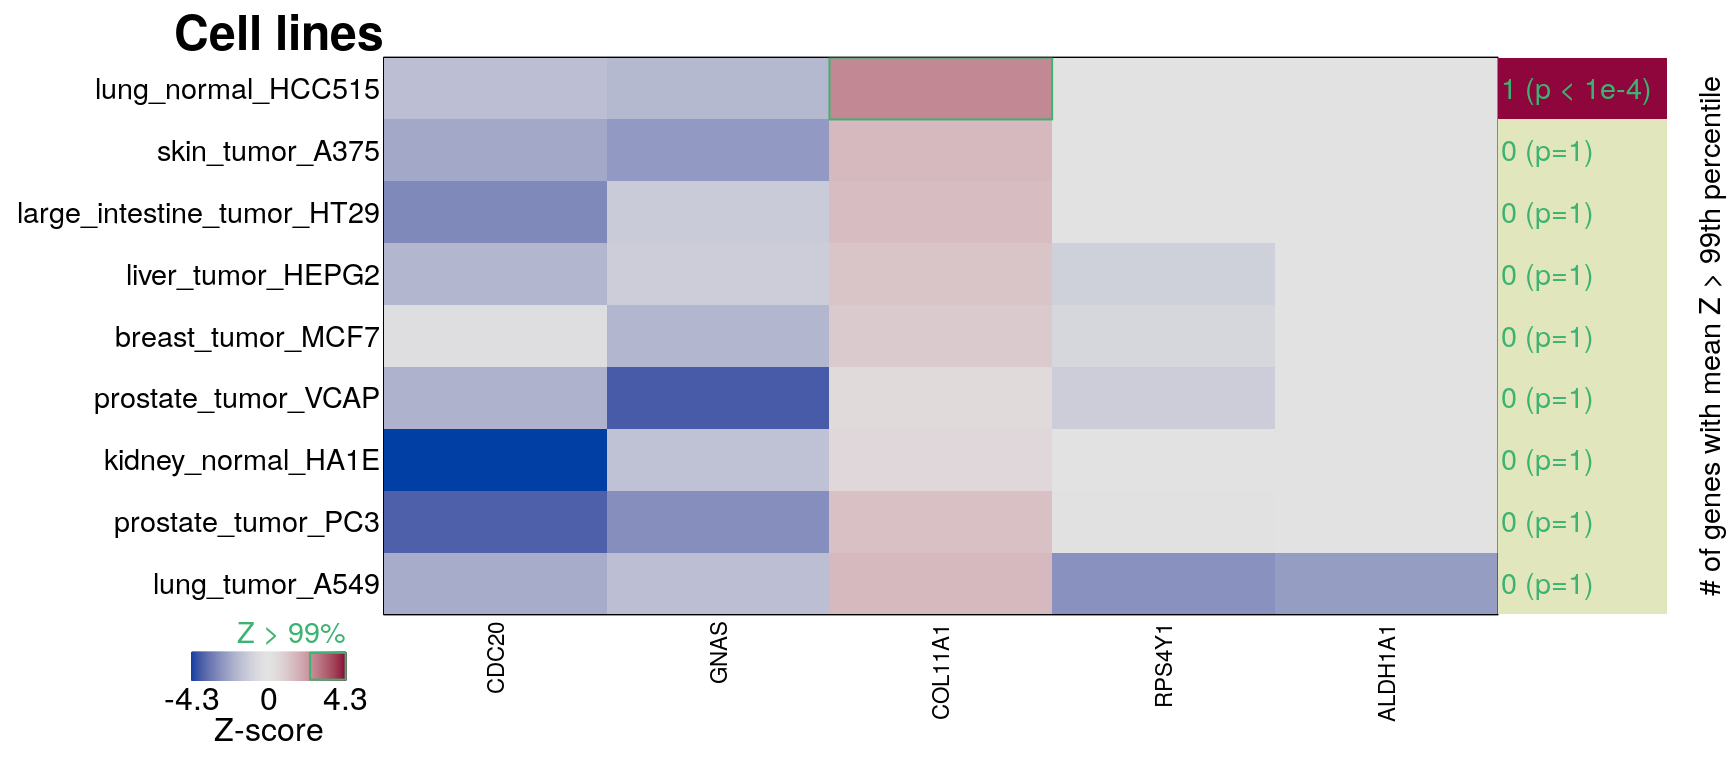
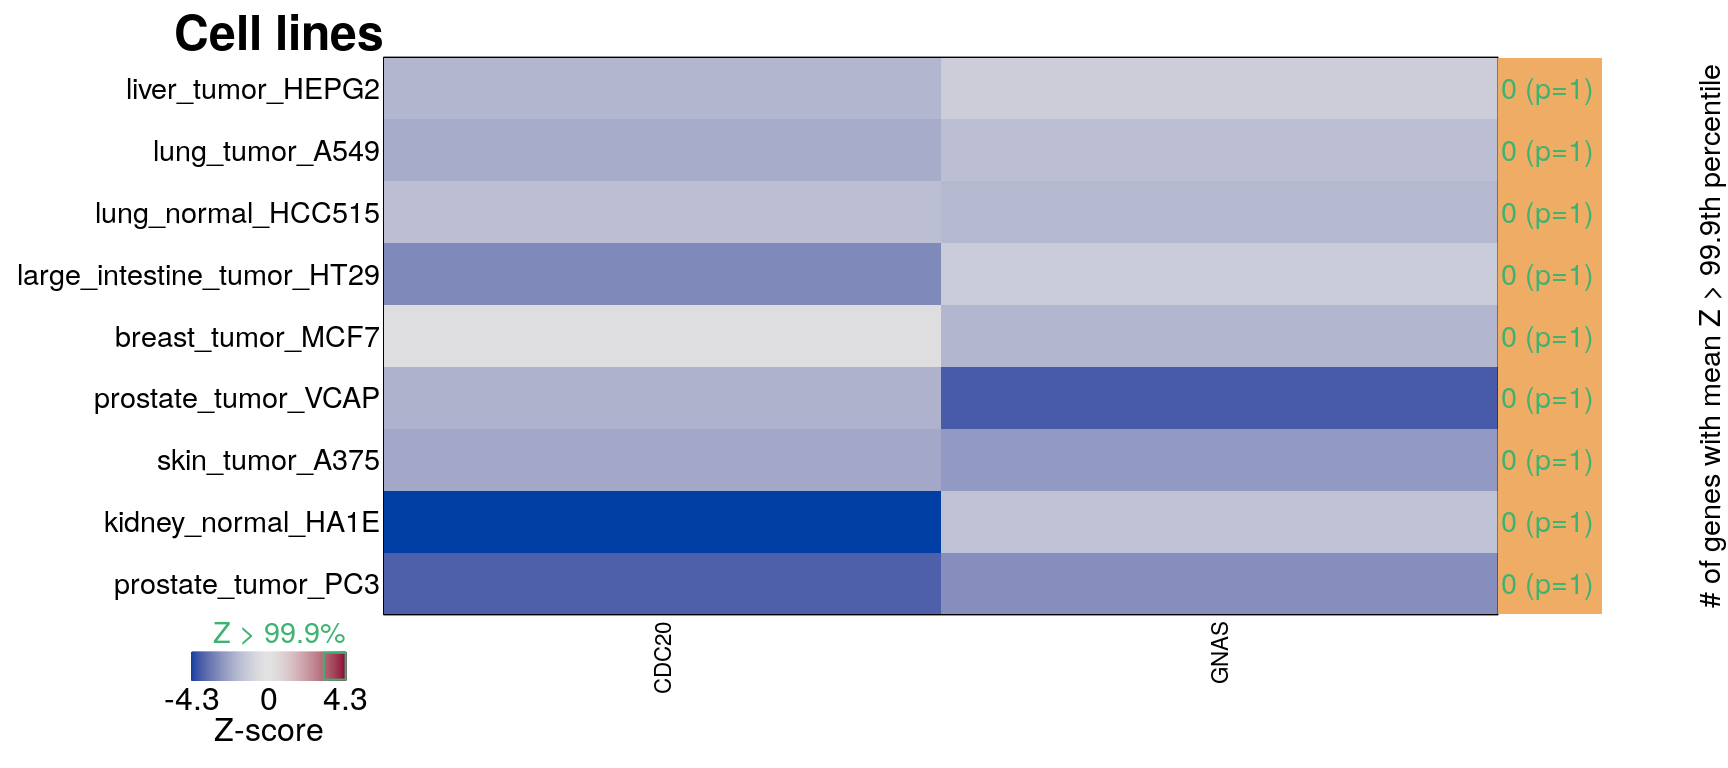
Averaging per cell line
16 ligands, ‘landmark’ genes only
16 ligands, all genes (including inferred)
295 ligands, ‘landmark’ genes only

295 ligands, all genes (including inferred)
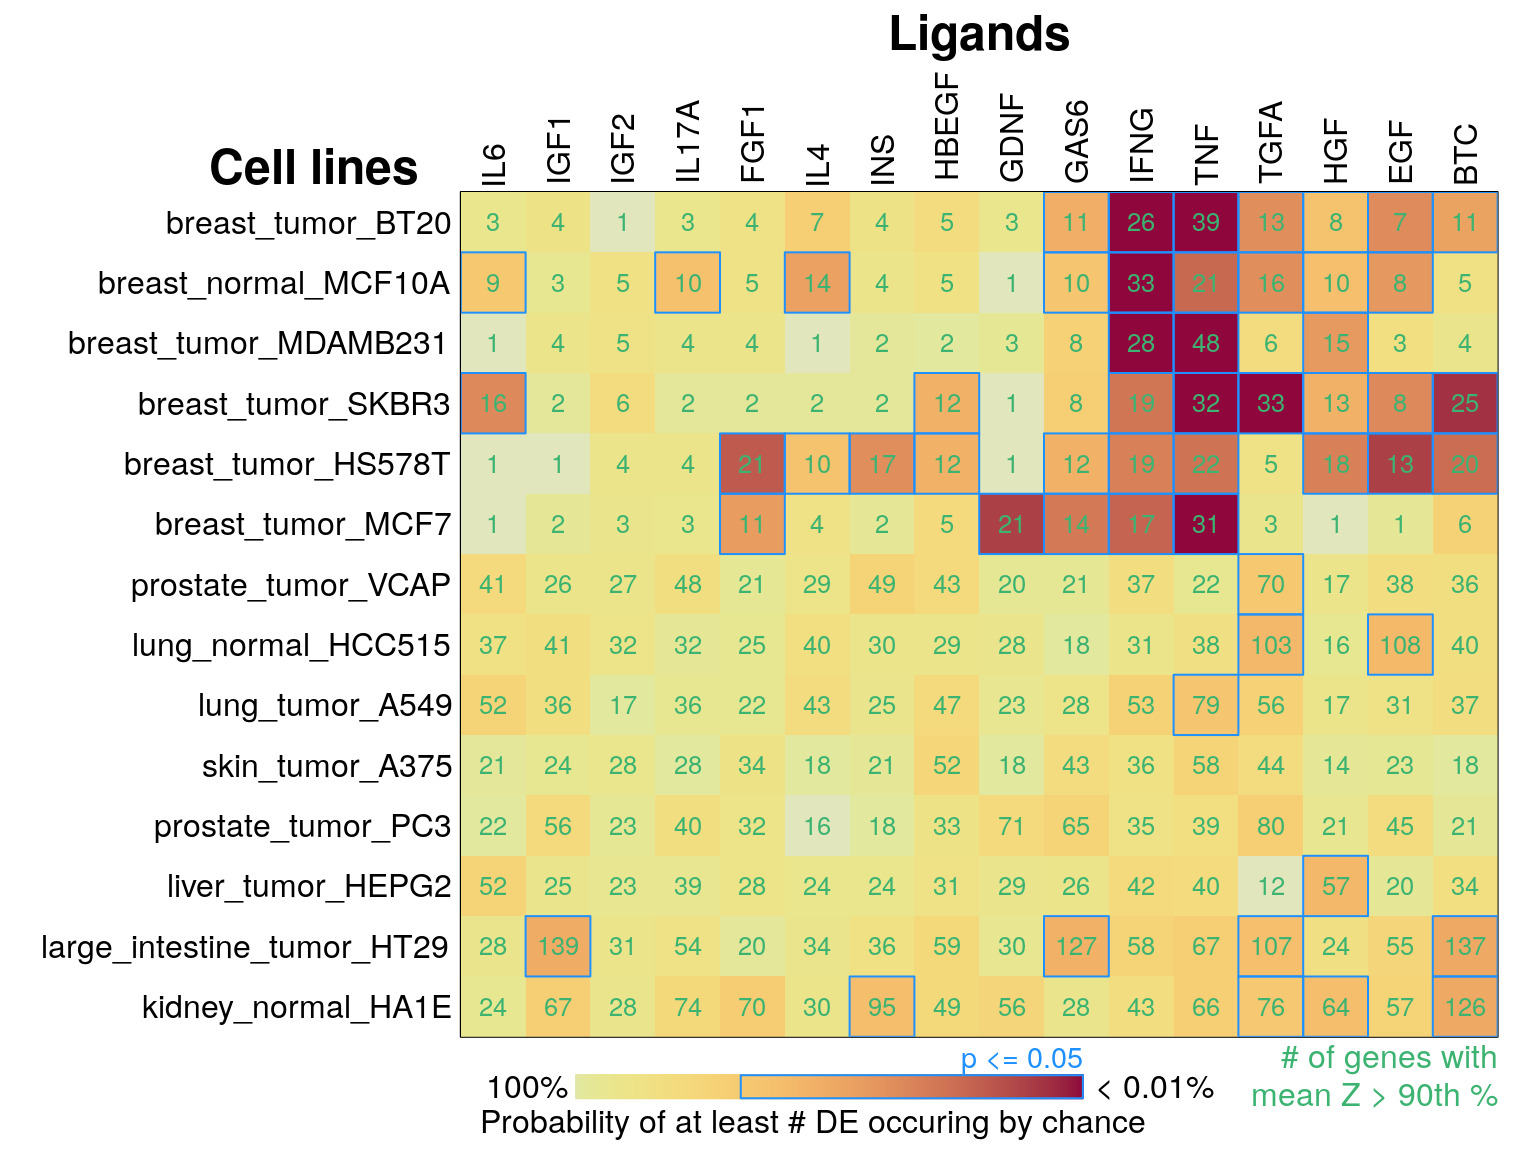
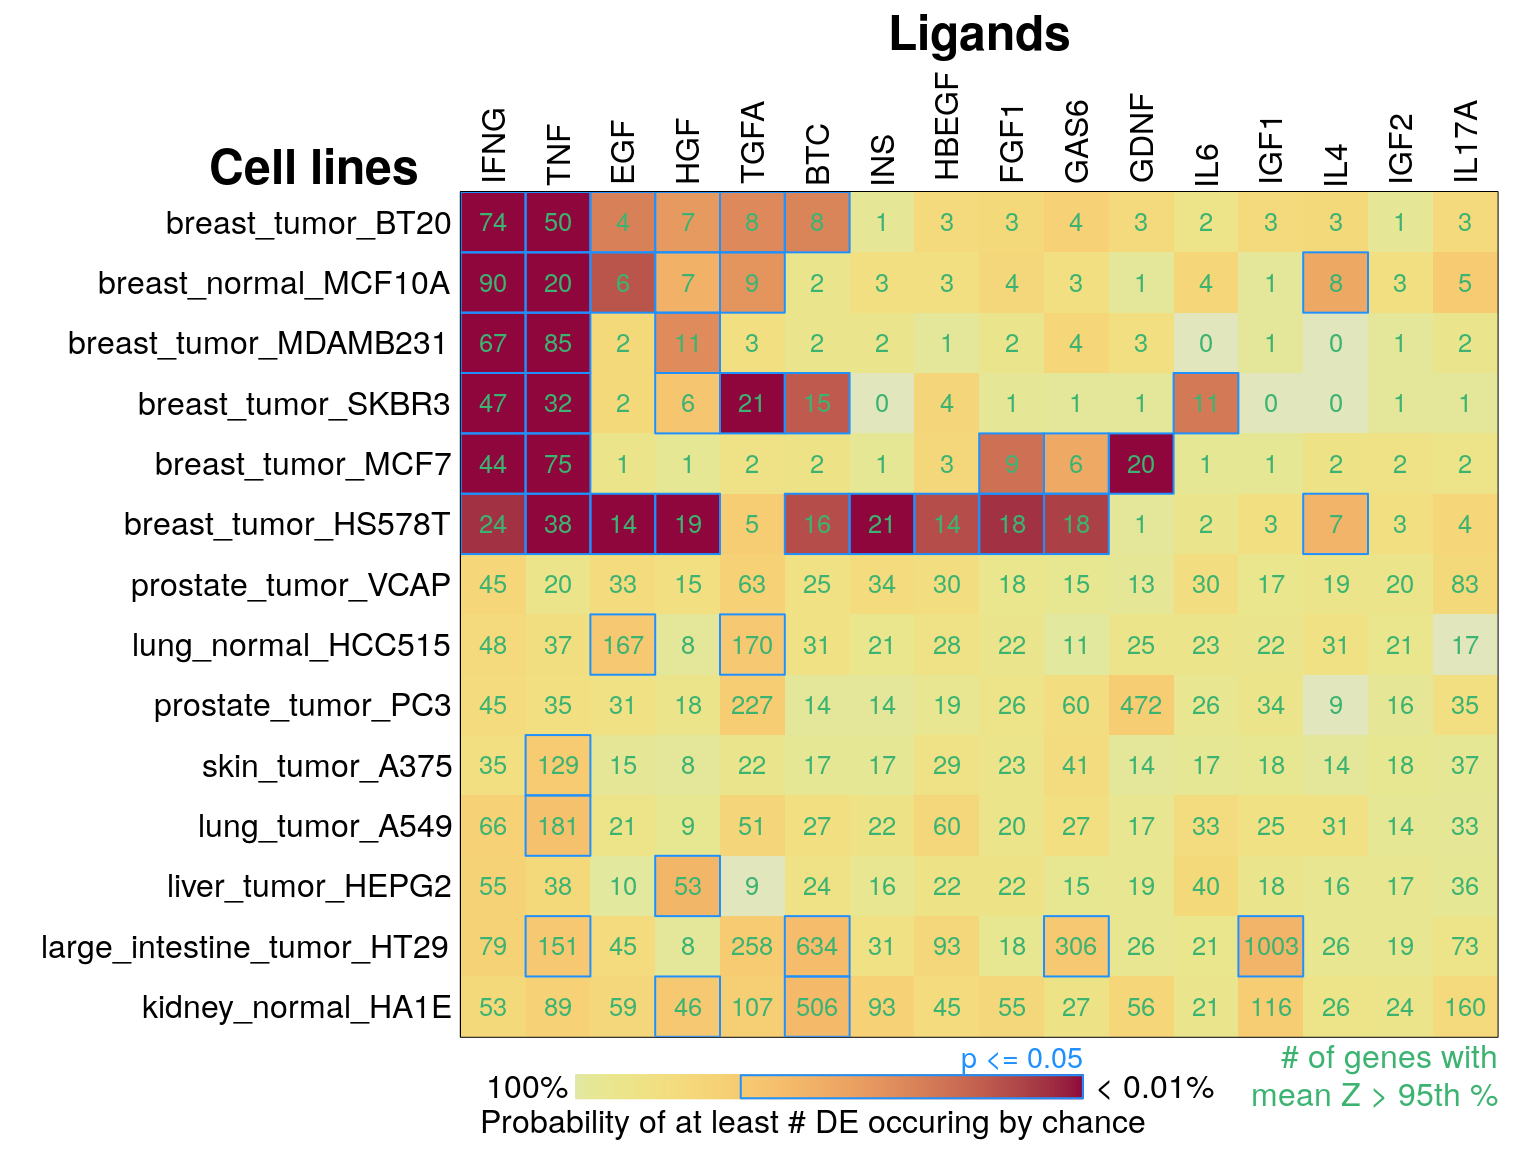
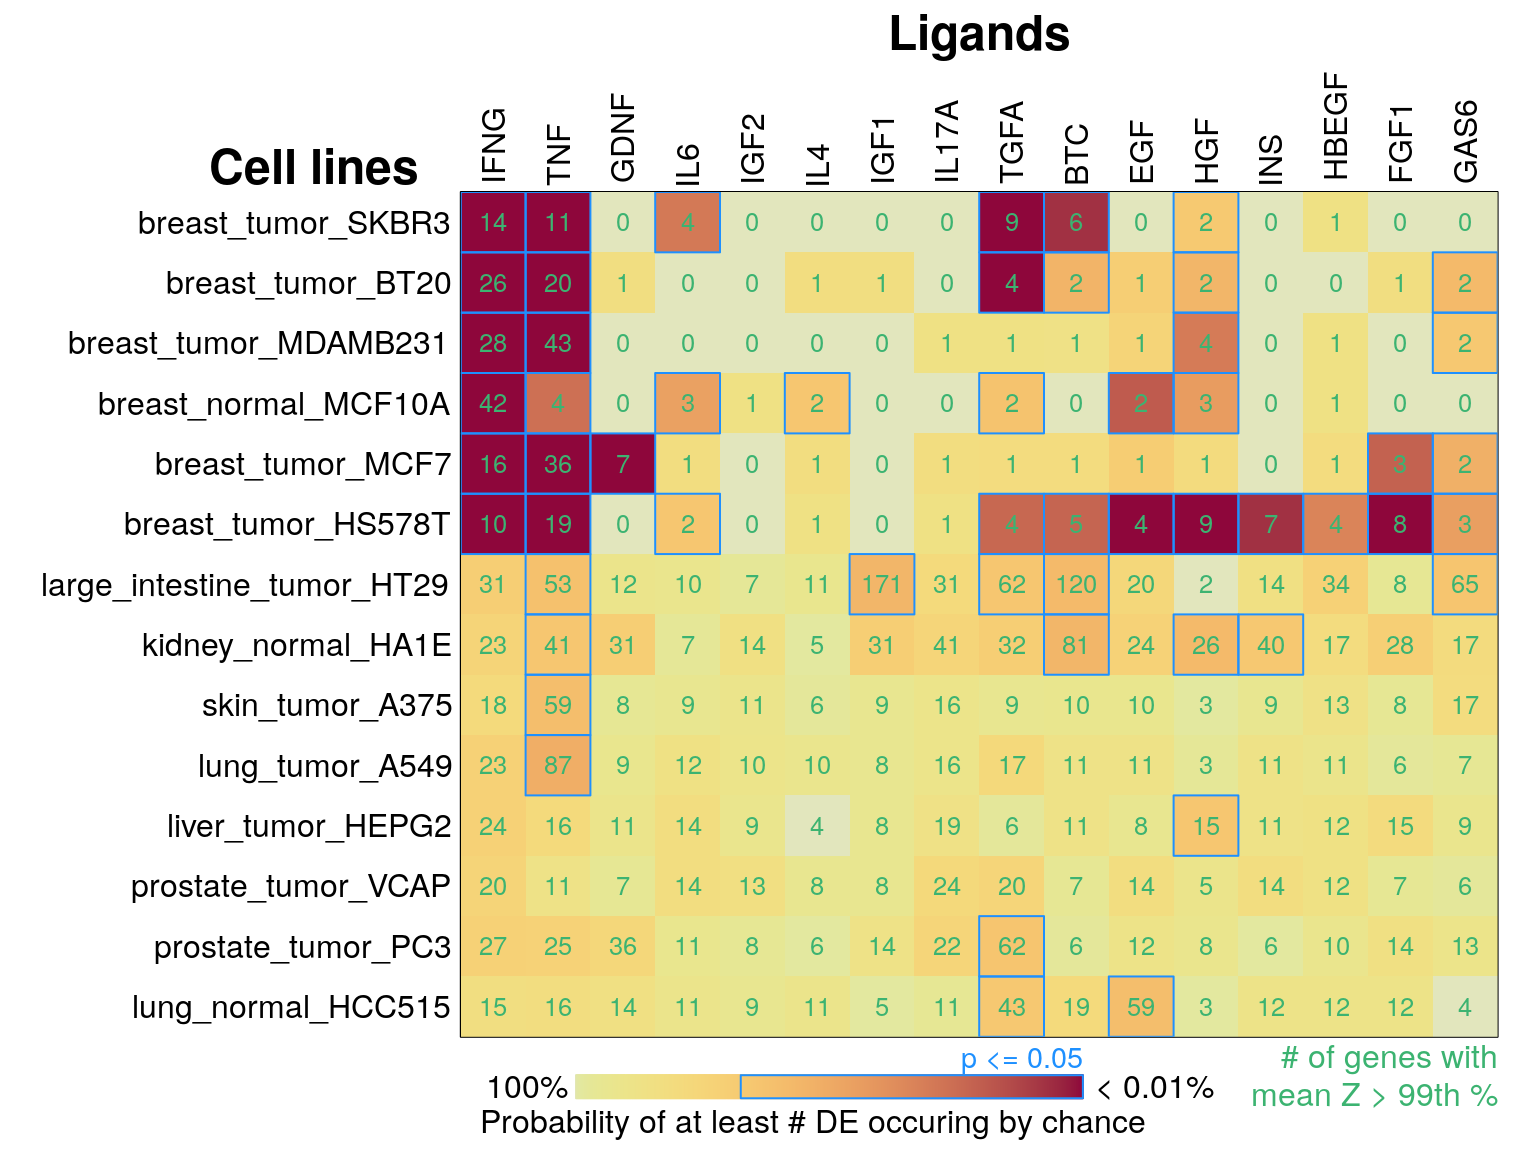
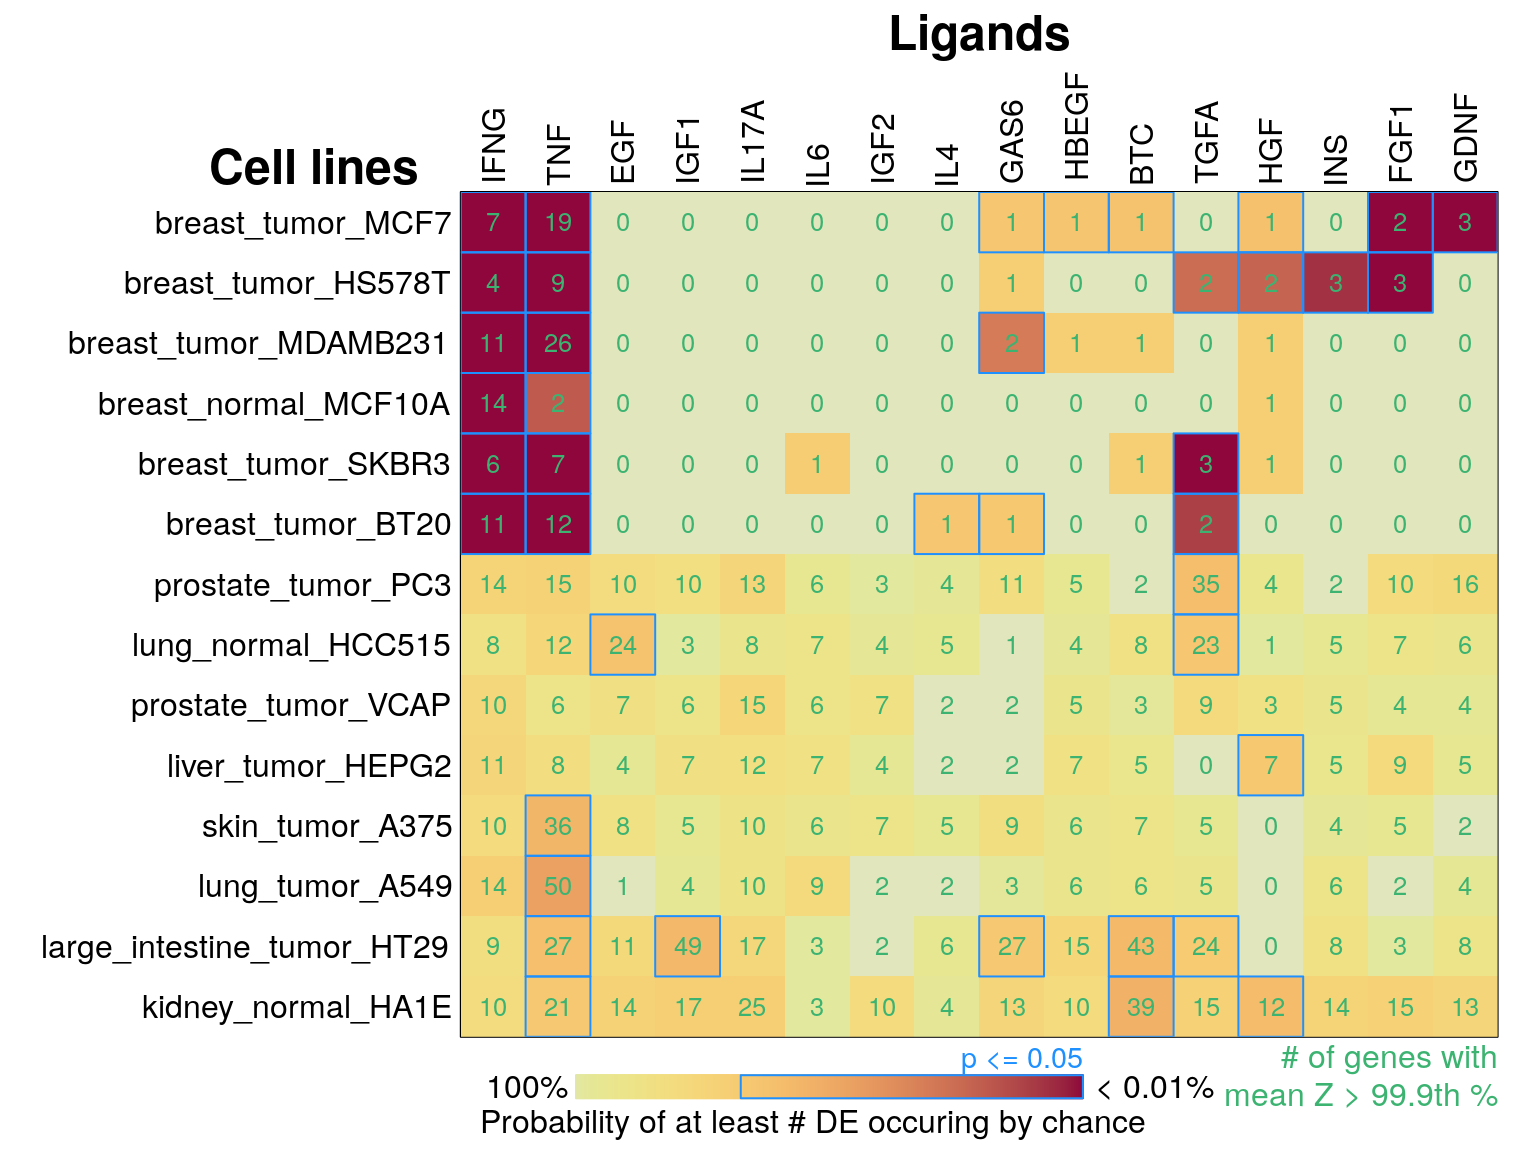
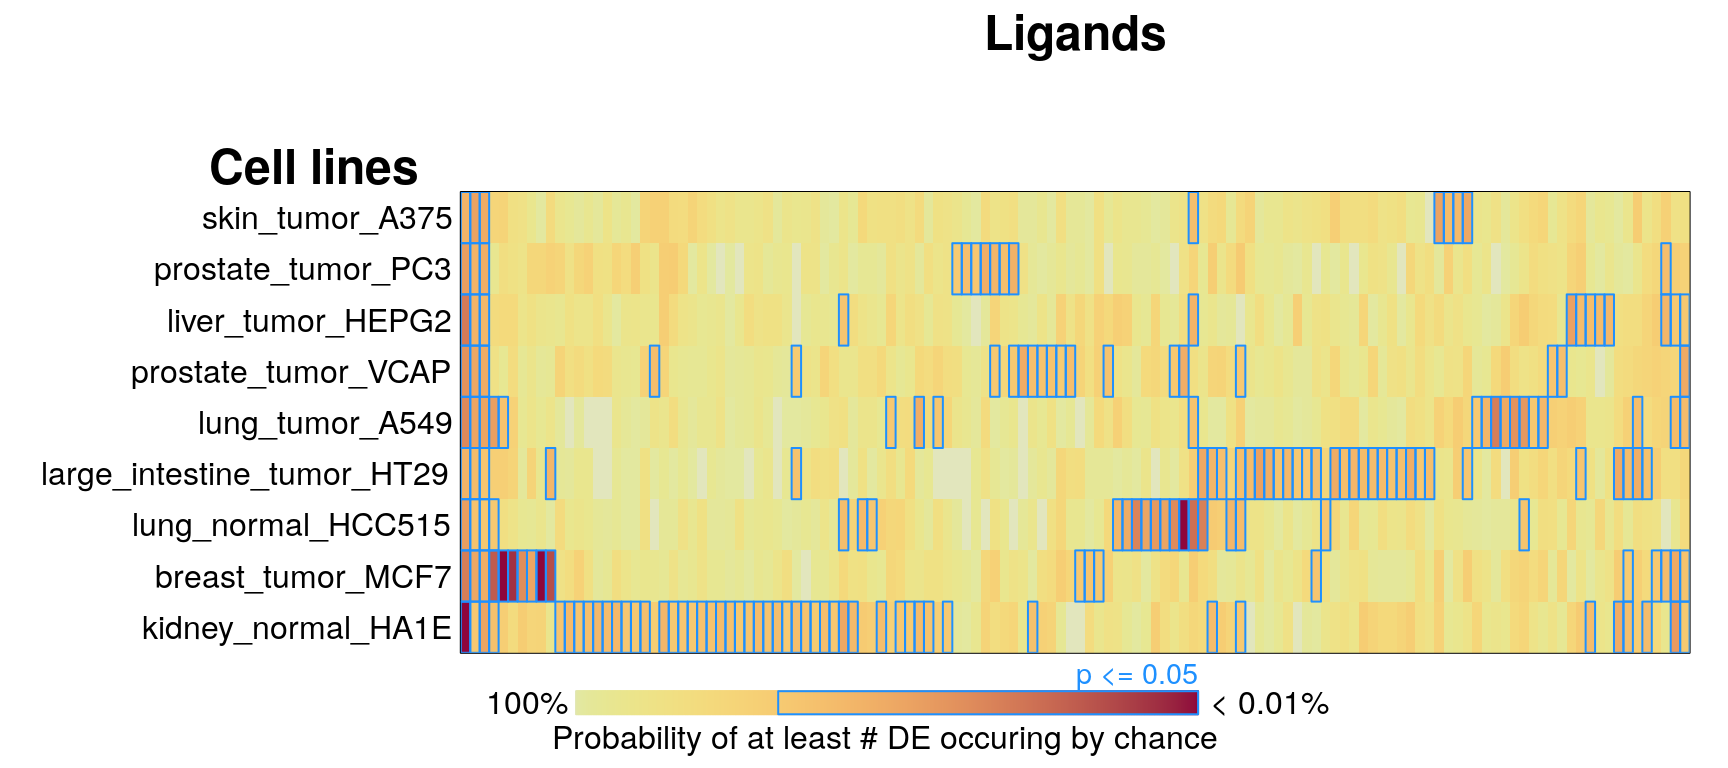
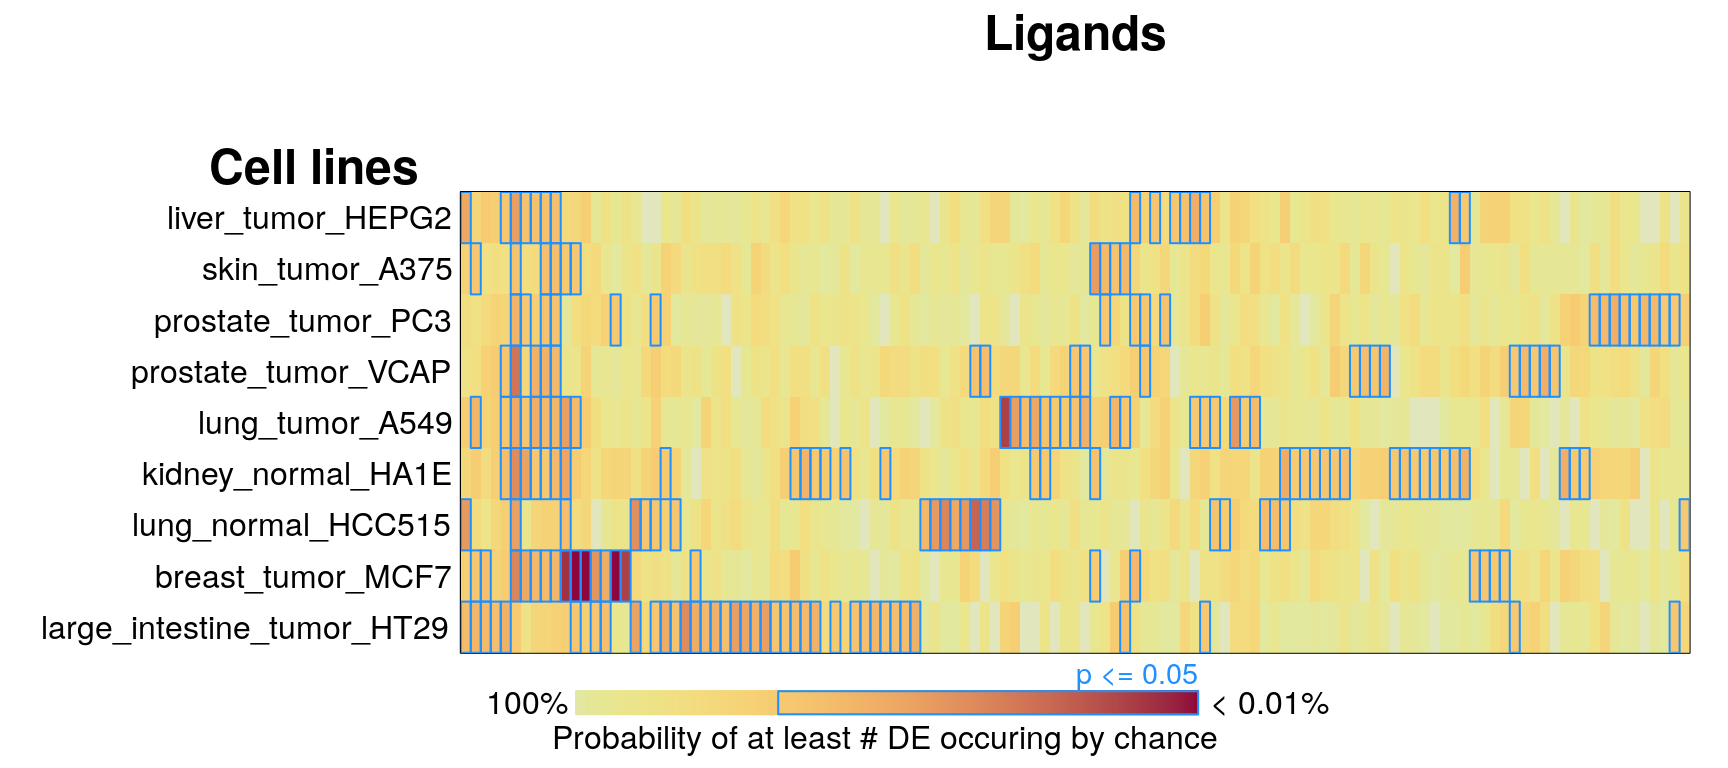
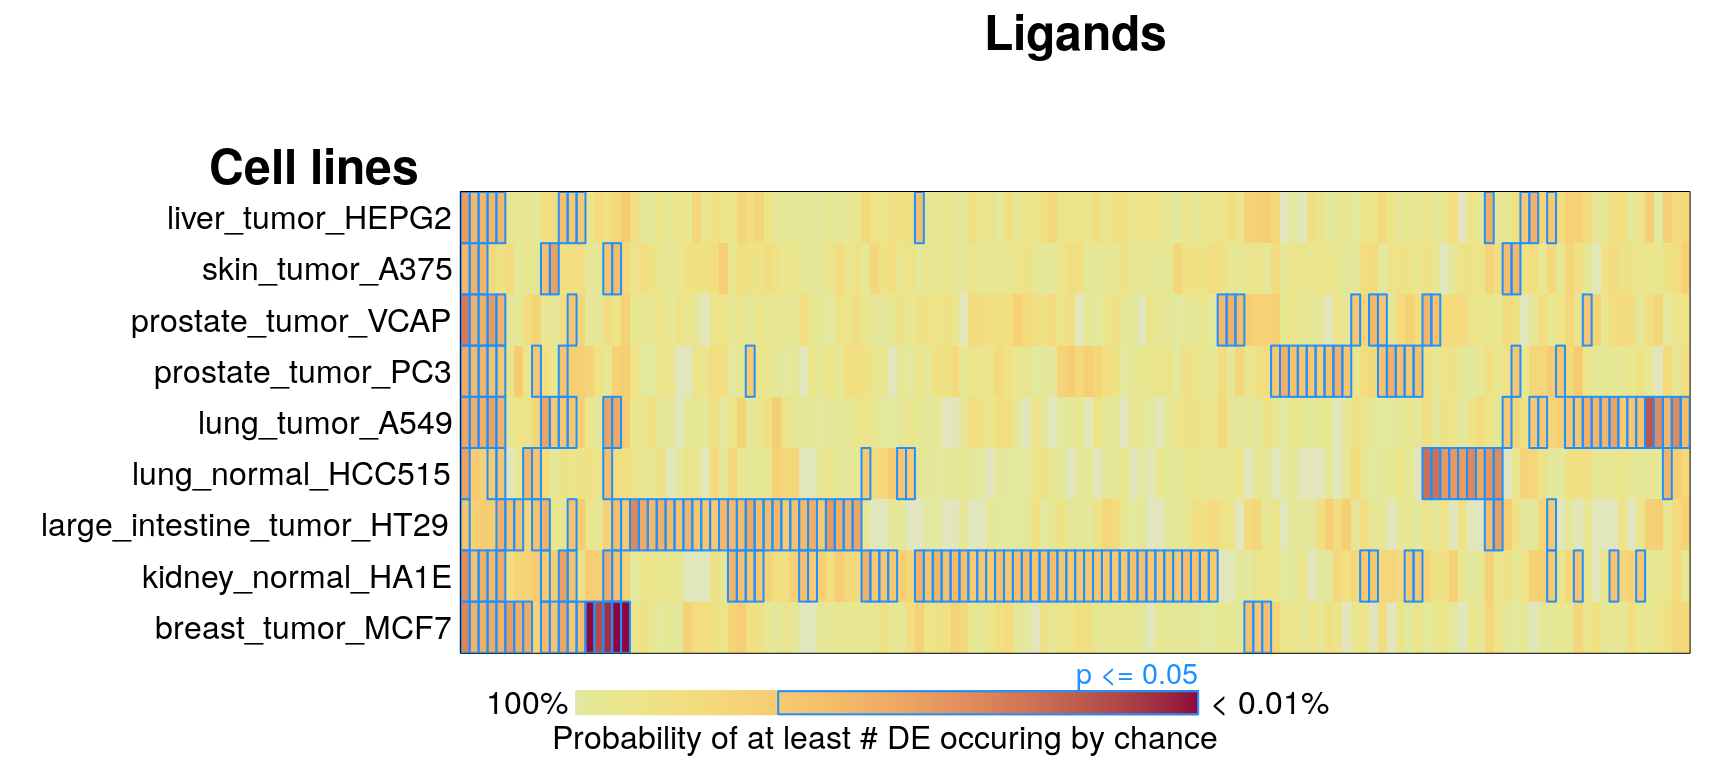
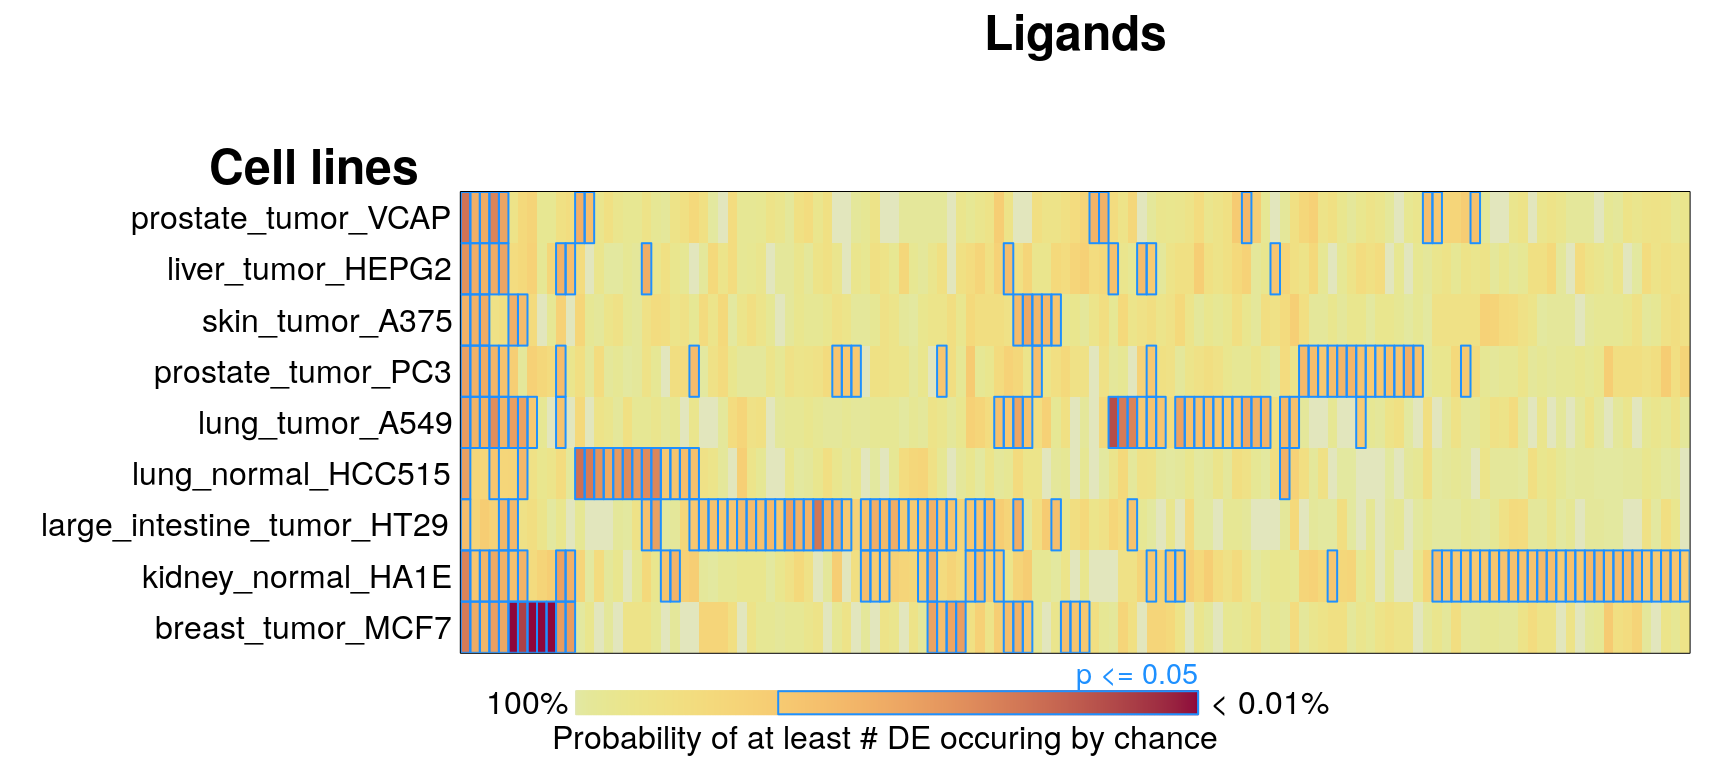
Averaging within each ligand per cell line
16 ligands, ‘landmark’ genes only
16 ligands, all genes (including inferred)
295 ligands, ‘landmark’ genes only
295 ligands, all genes (including inferred)
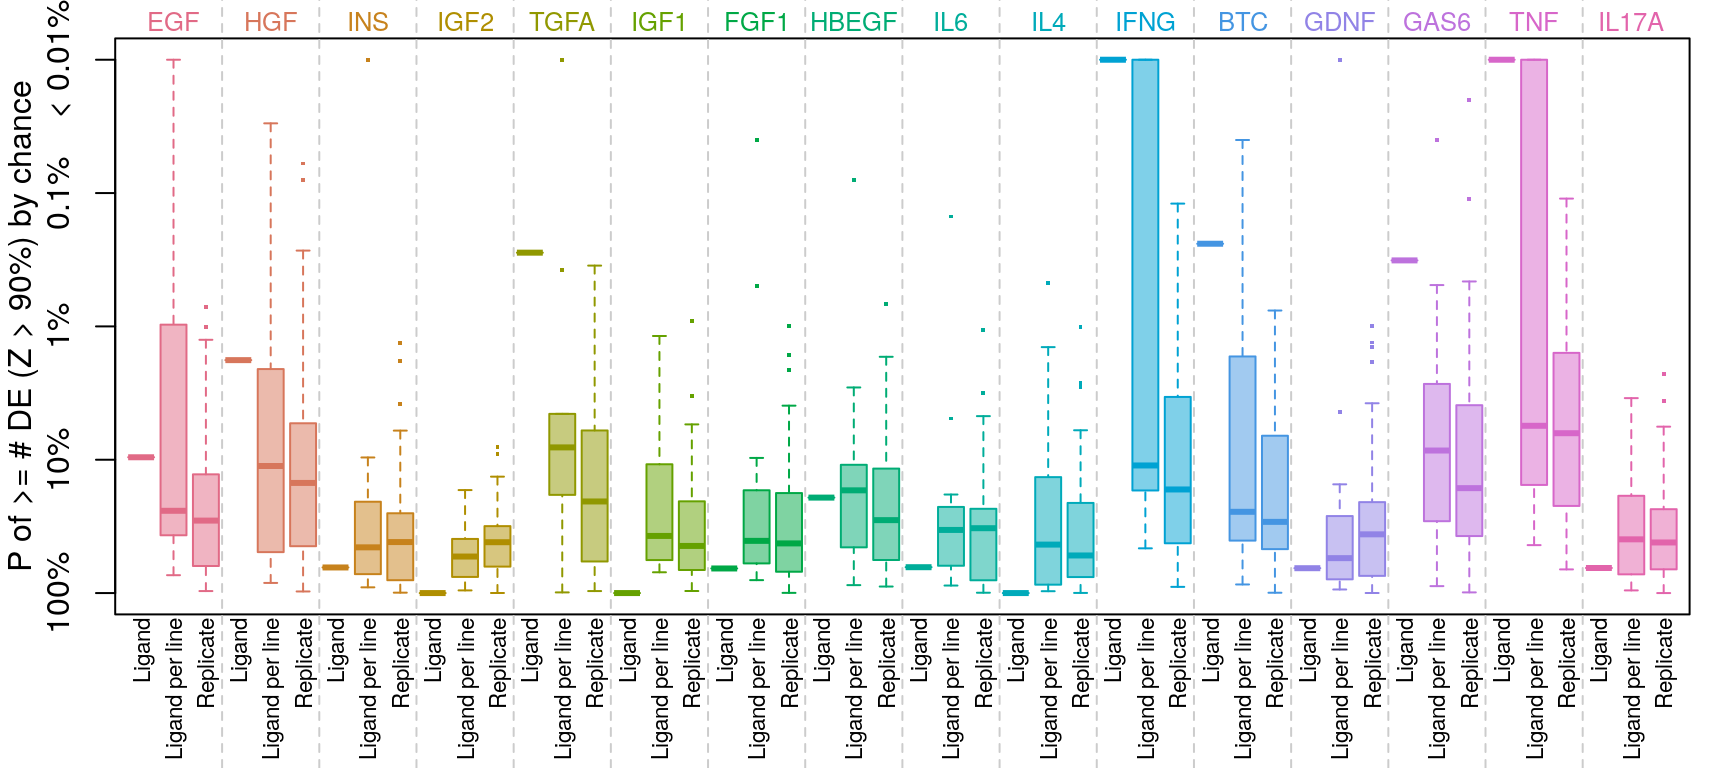
Comparing DE count distributions
16 ligands, ‘landmark’ genes only
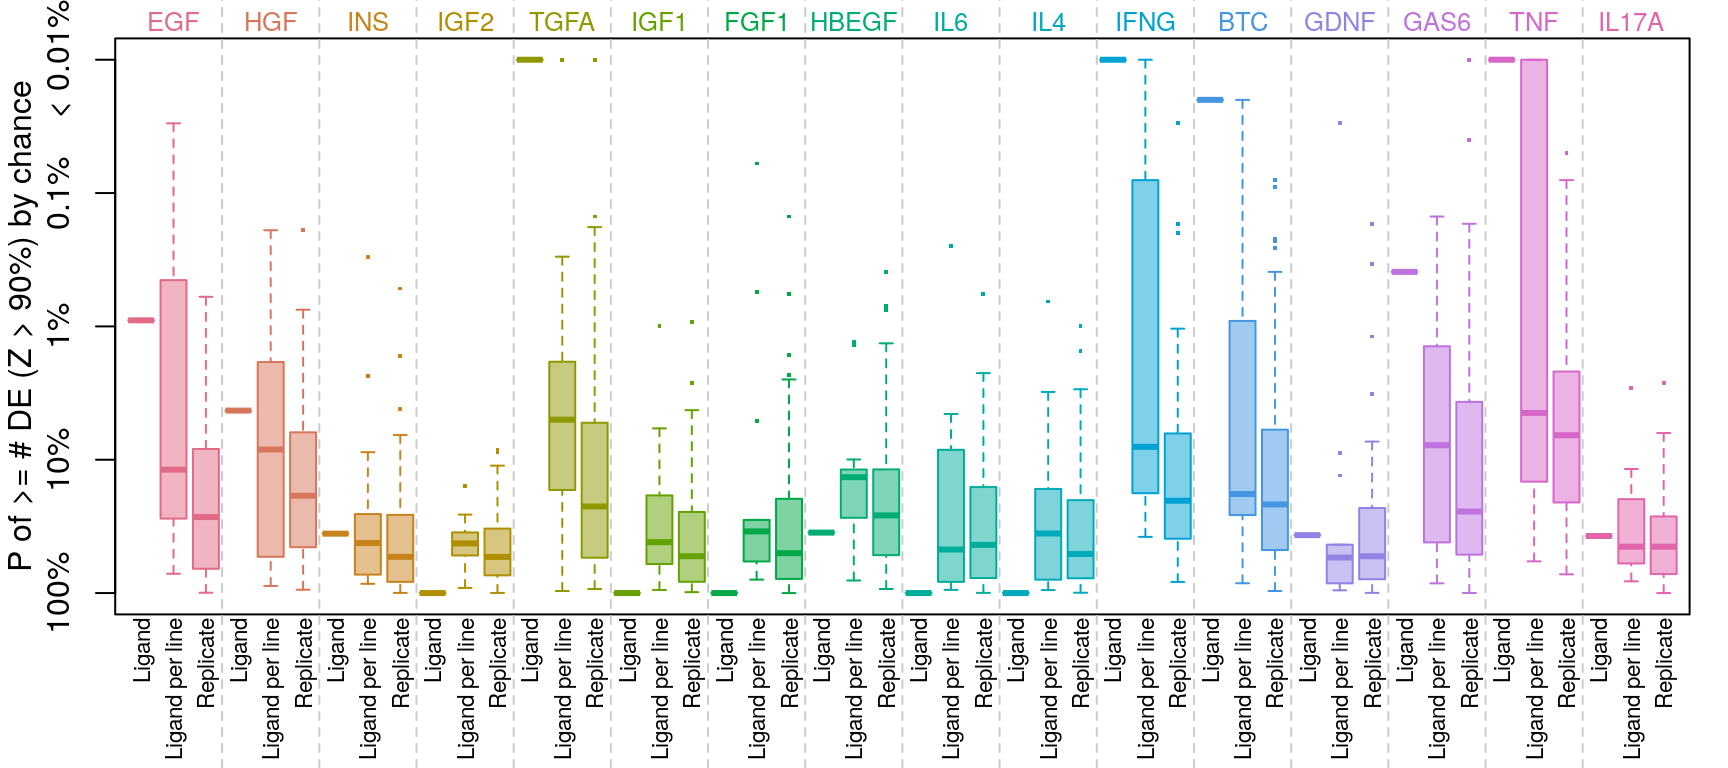
16 ligands, all genes (including inferred)
295 ligands, ‘landmark’ genes only
295 ligands, all genes (including inferred)