Re-analysis of NicheNet dataset
NicheNet calculation sanity check
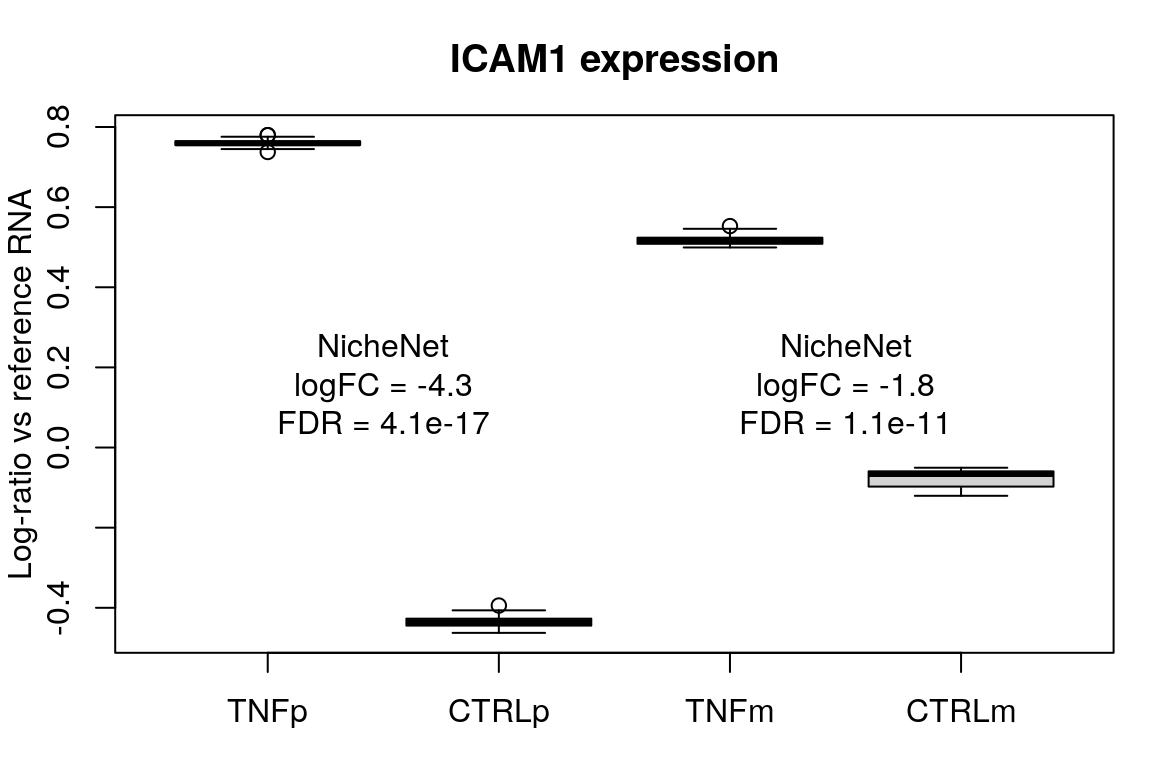
Looks like the sign of the logFC is flipped in the NicheNet calculations. Multiplying logFC values from the NicheNet dataset by -1 for the remainder of this analysis.
NicheNet data summary
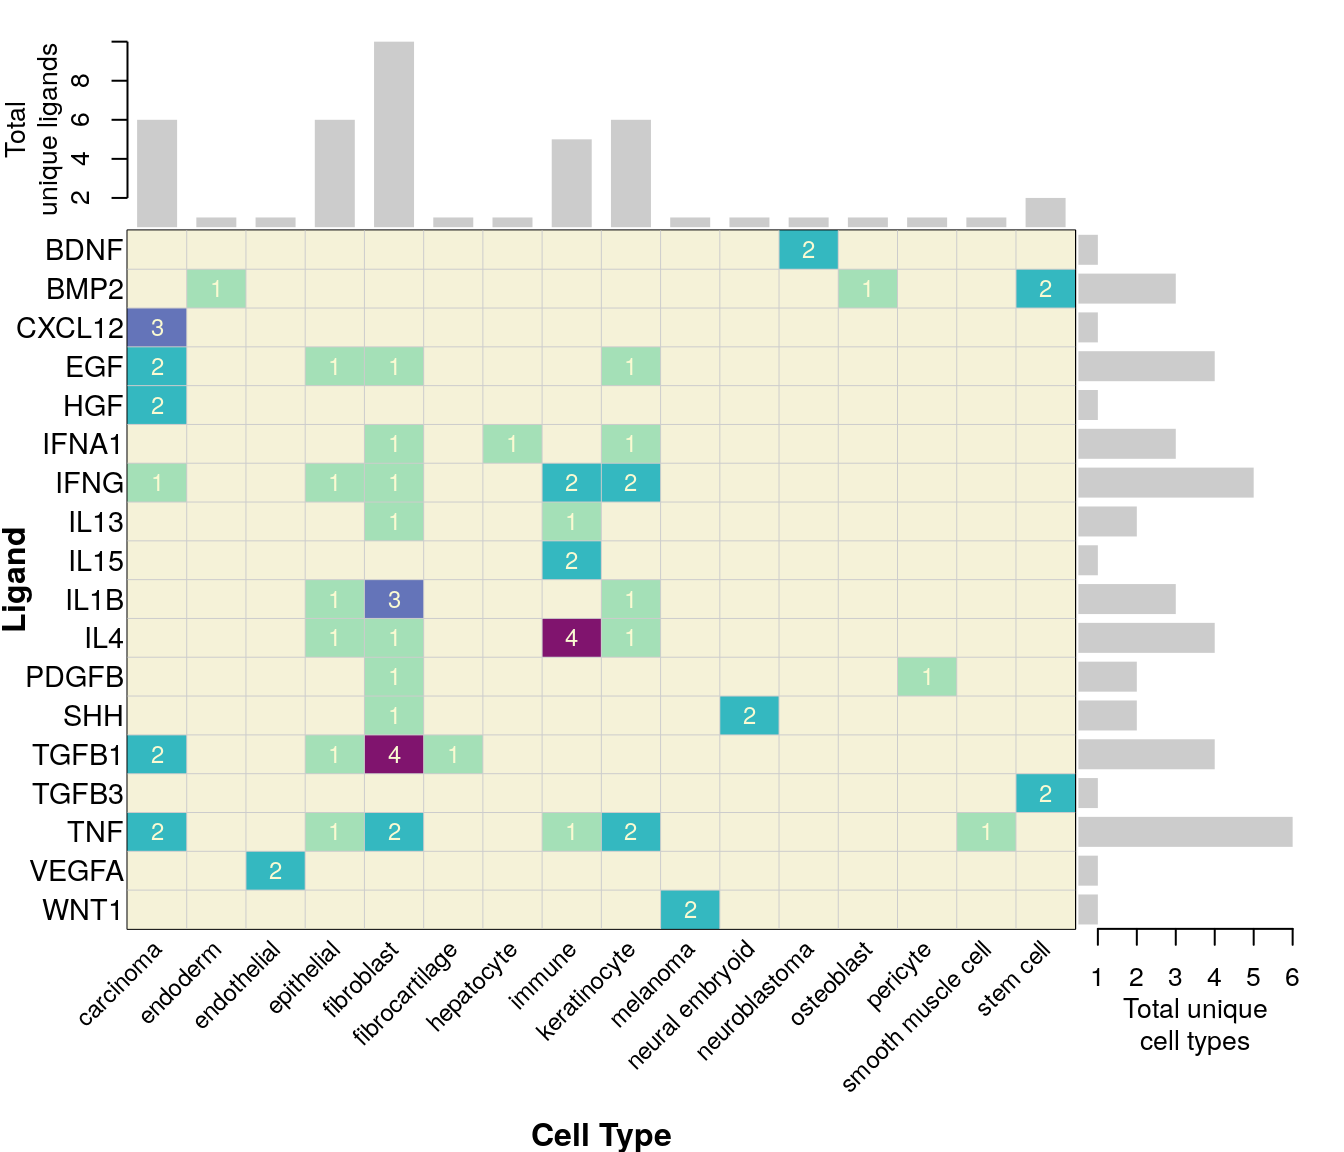
18 ligands were assayed in multiple datasets, 11 of which occurred across more than one cell type.
Comparing across vs within cell type per ligand treatment
Previous analysis (see below) included a “within lab” category that was unclear, so it has been removed.
All data (including time-series) is included in this analysis. NicheNet calculation of time-series data seems to result in all positive logFC values, so that makes some things a little screwy. In those cases, time-series data was only compared to other time-series data.
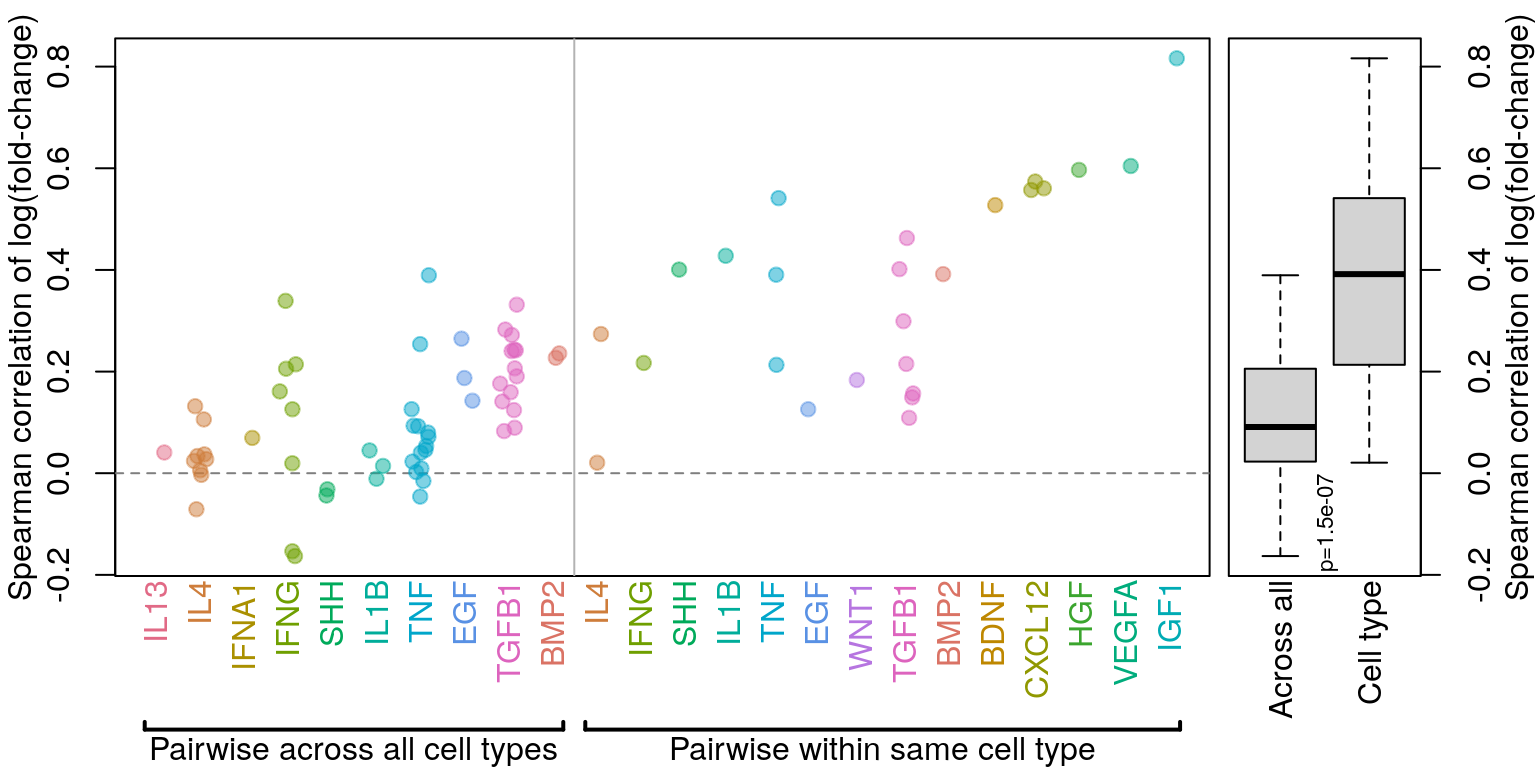
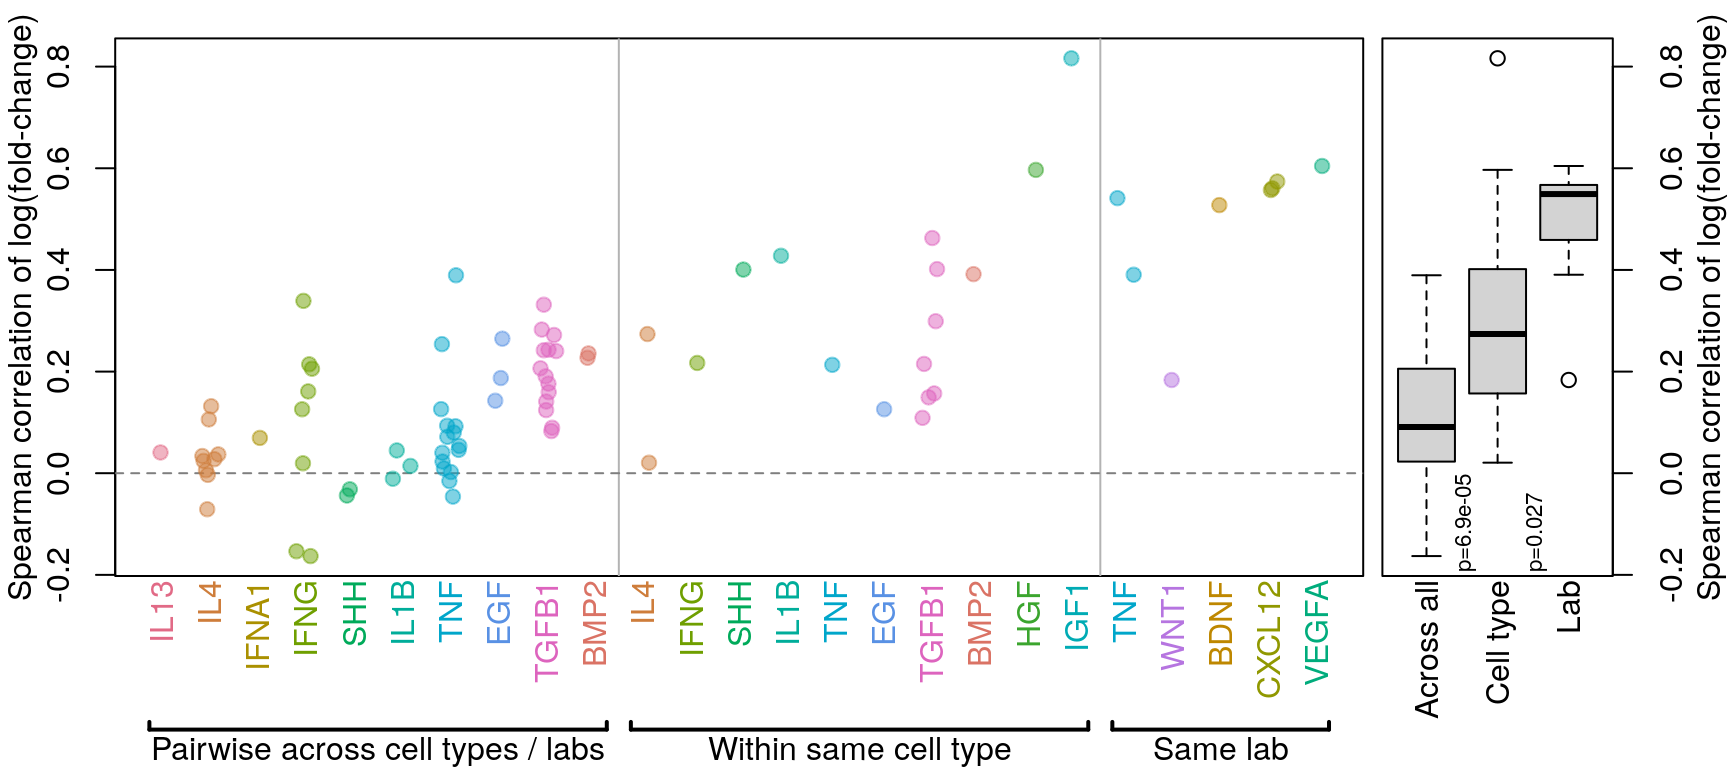
Correlation
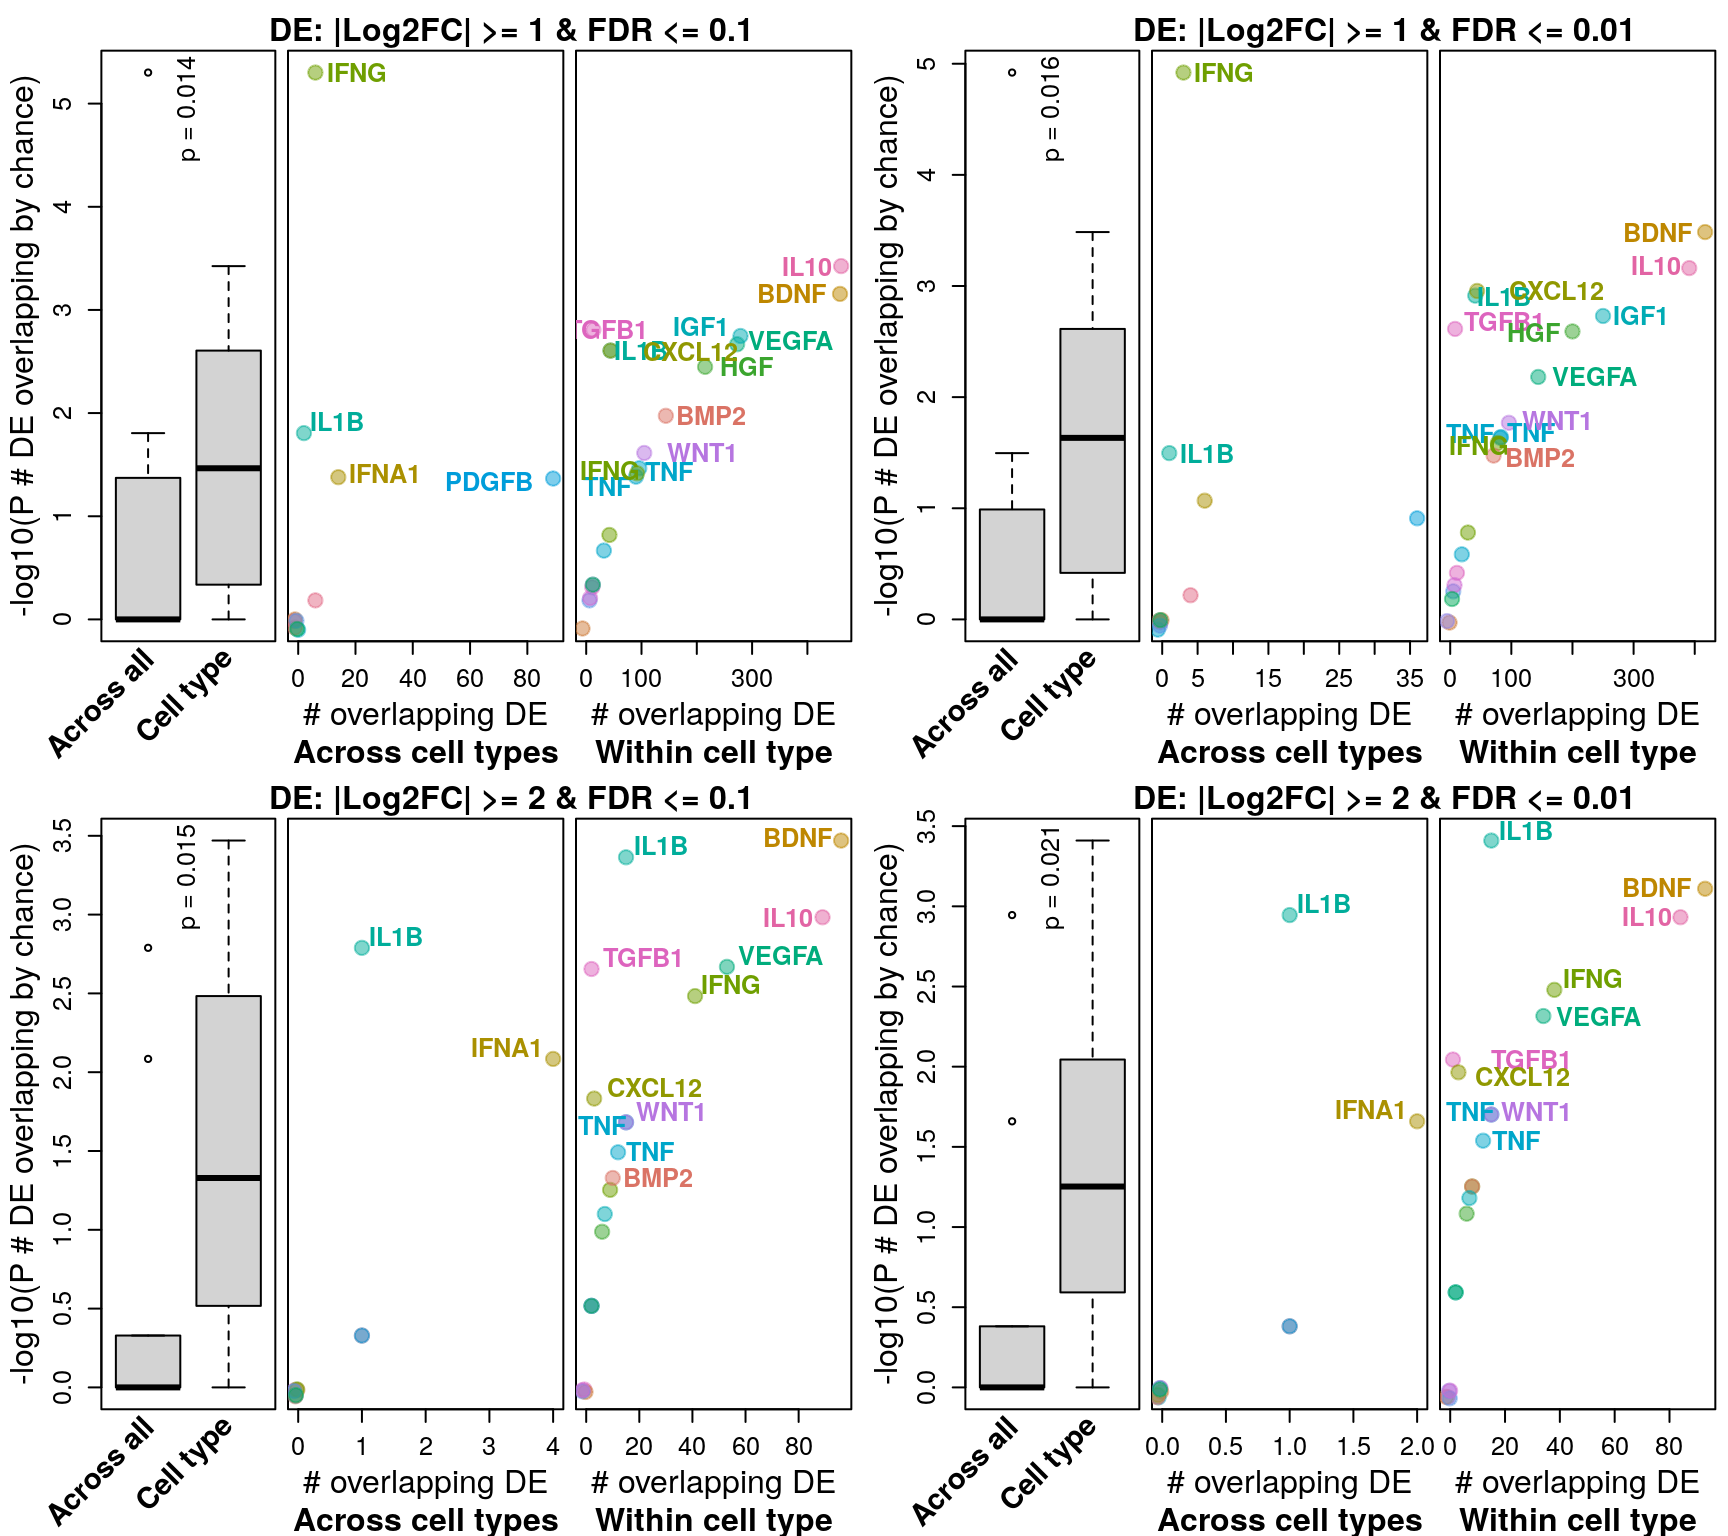
Differential gene expression
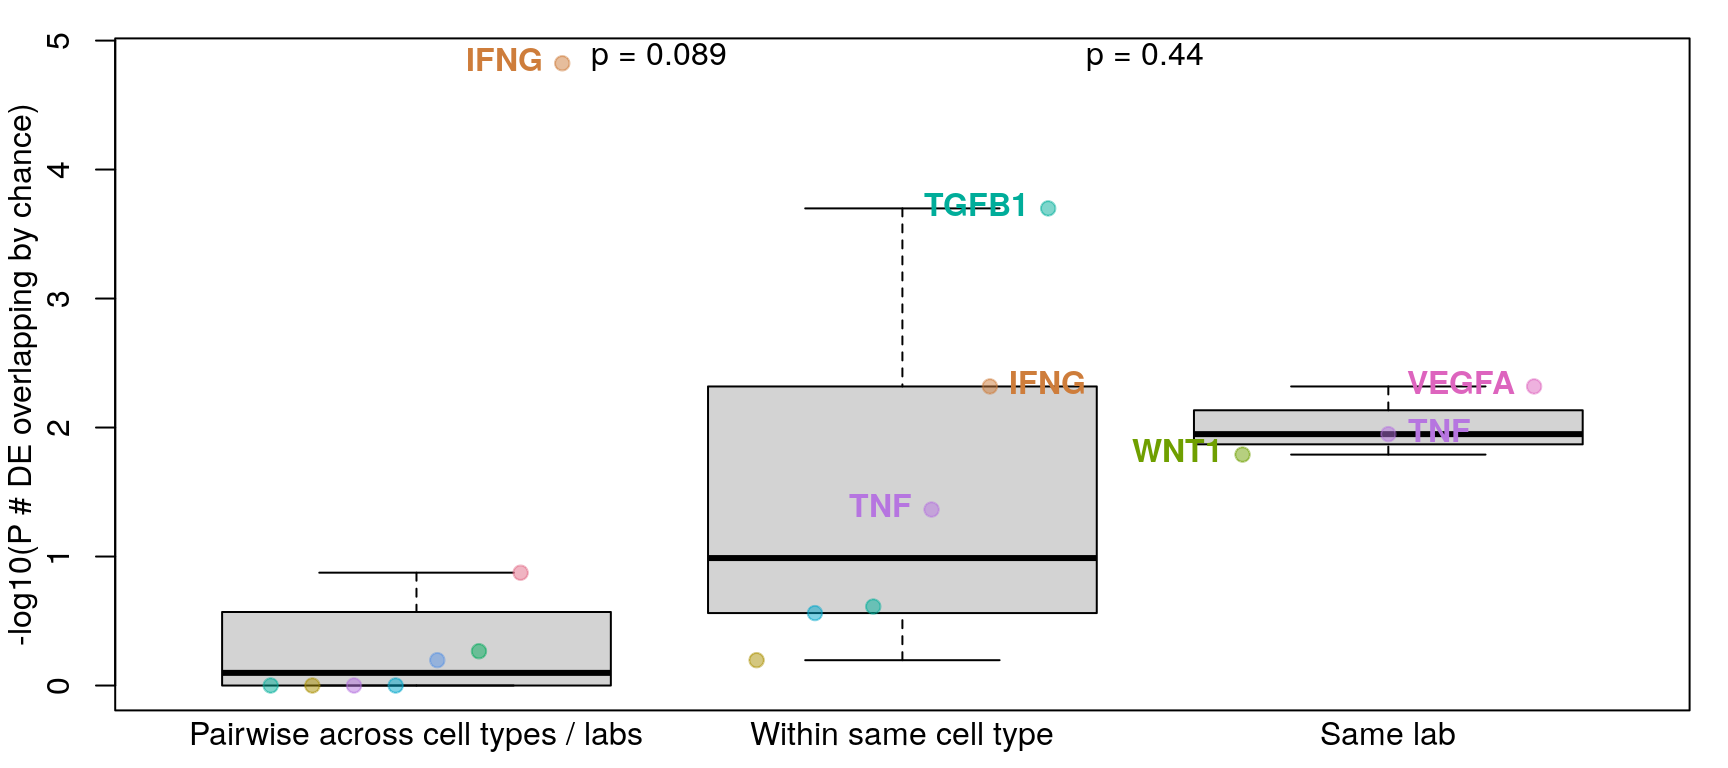
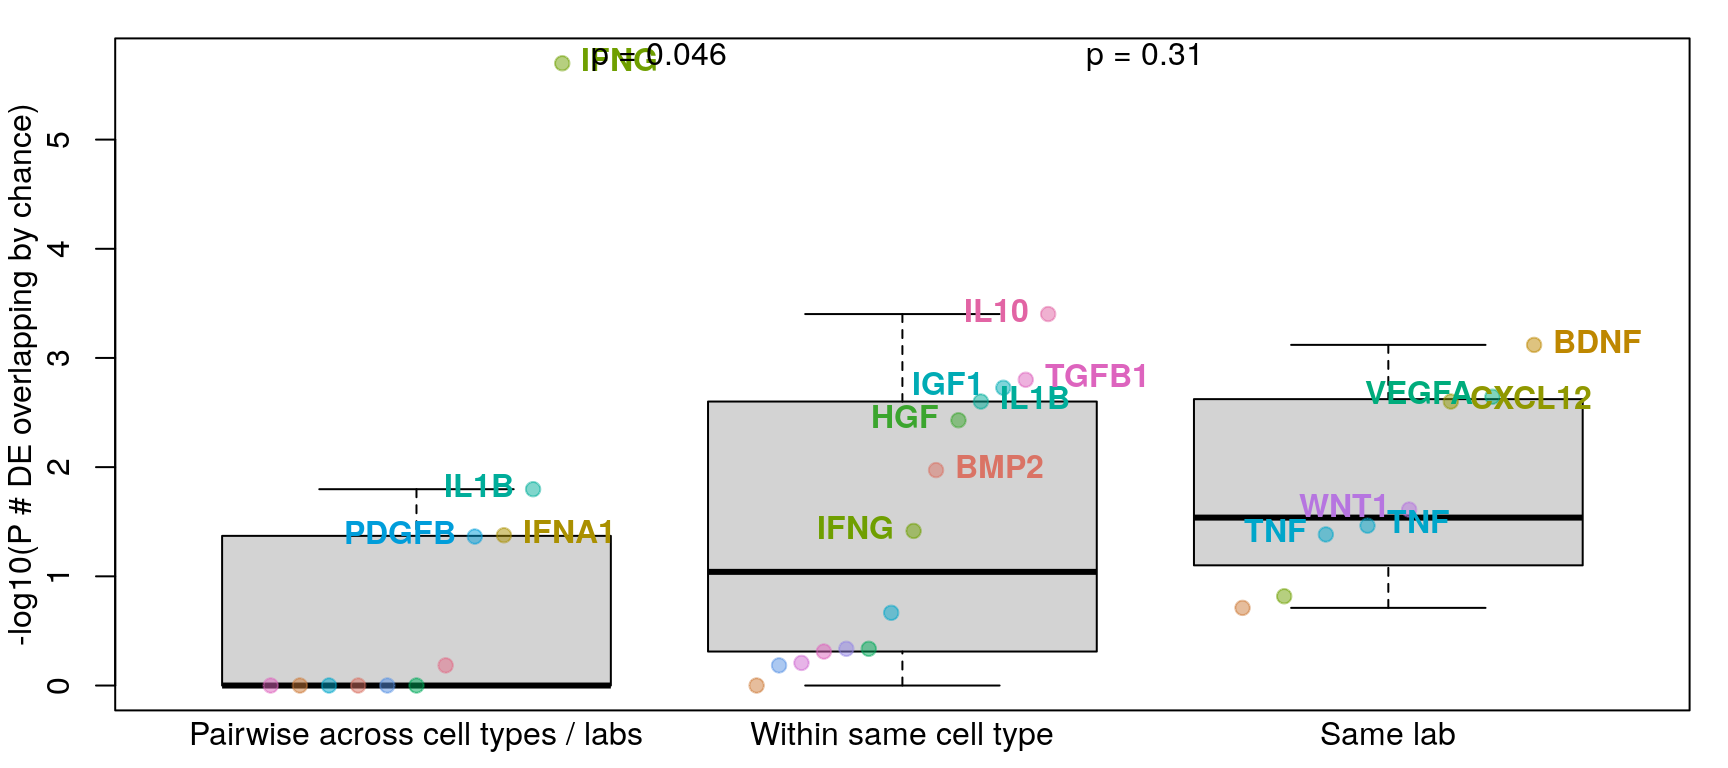
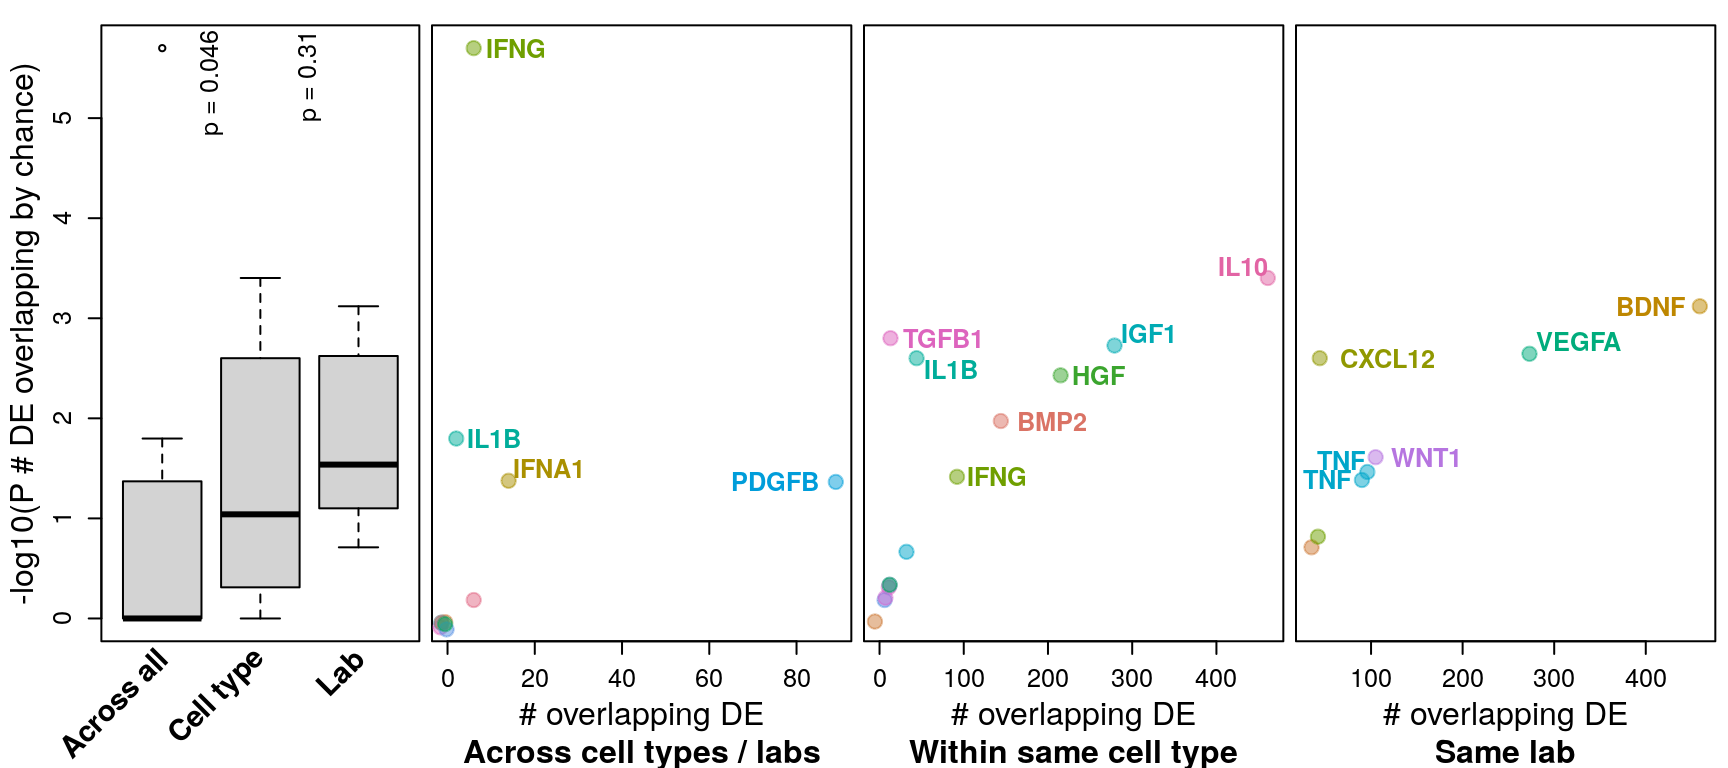
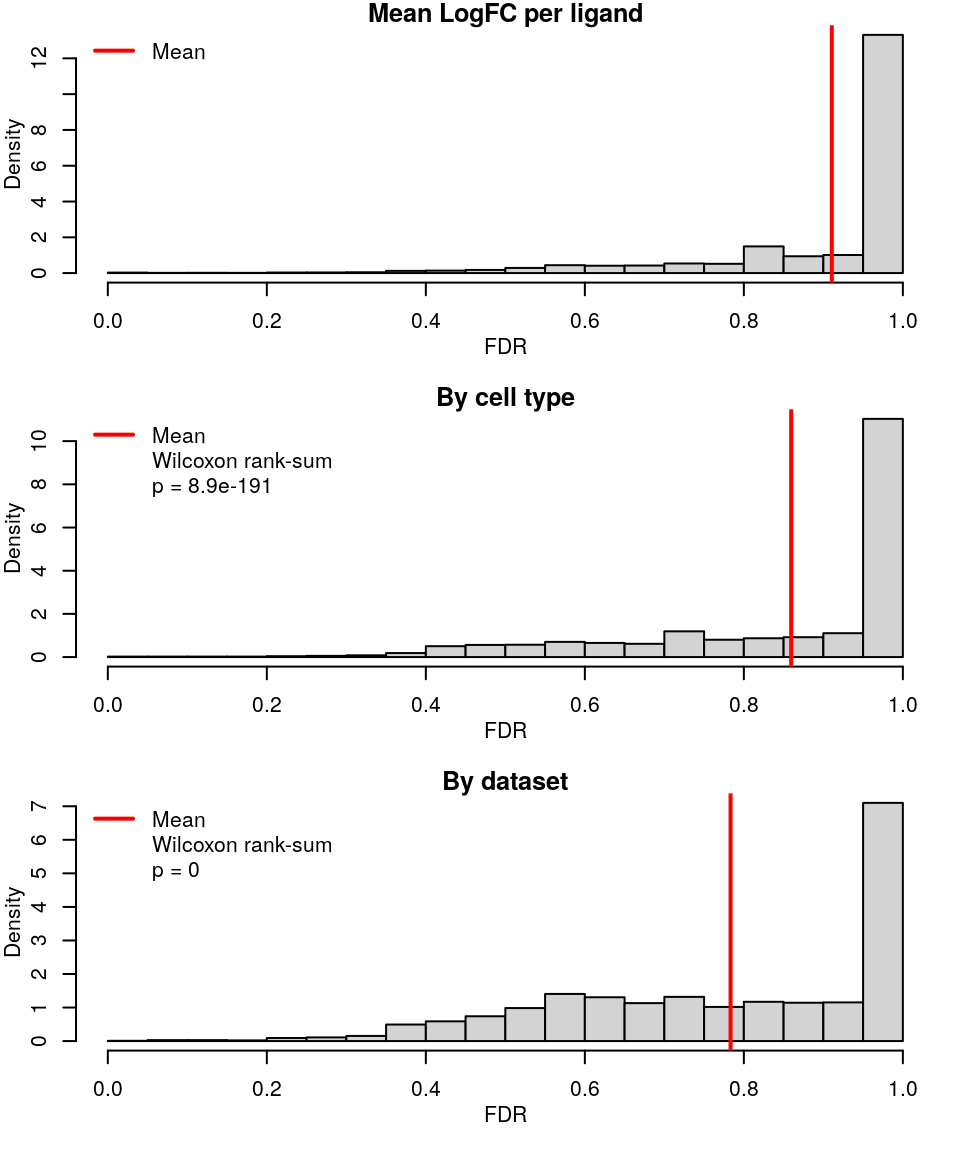
Differentially expressed genes were determined by |logFC| >= 1 and FDR <= 0.1 (similar to Browaeys et al., 2020). This figure shows number of DE genes overlapping across all datasets testing the same ligand vs. datasets testing the same ligand in the same cell type vs. datasets from the same accession number (and same ligand / cell type). P-values for overlap (y-axis) were determined after determining probability of overlapping DE genes by chance through bootstrapping.
Using all data (including time-series)
NicheNet calculation of time-series data seems to result in all positive logFC values, so that makes some things a little screwy. In those cases, time-series data was only compared to other time-series data.
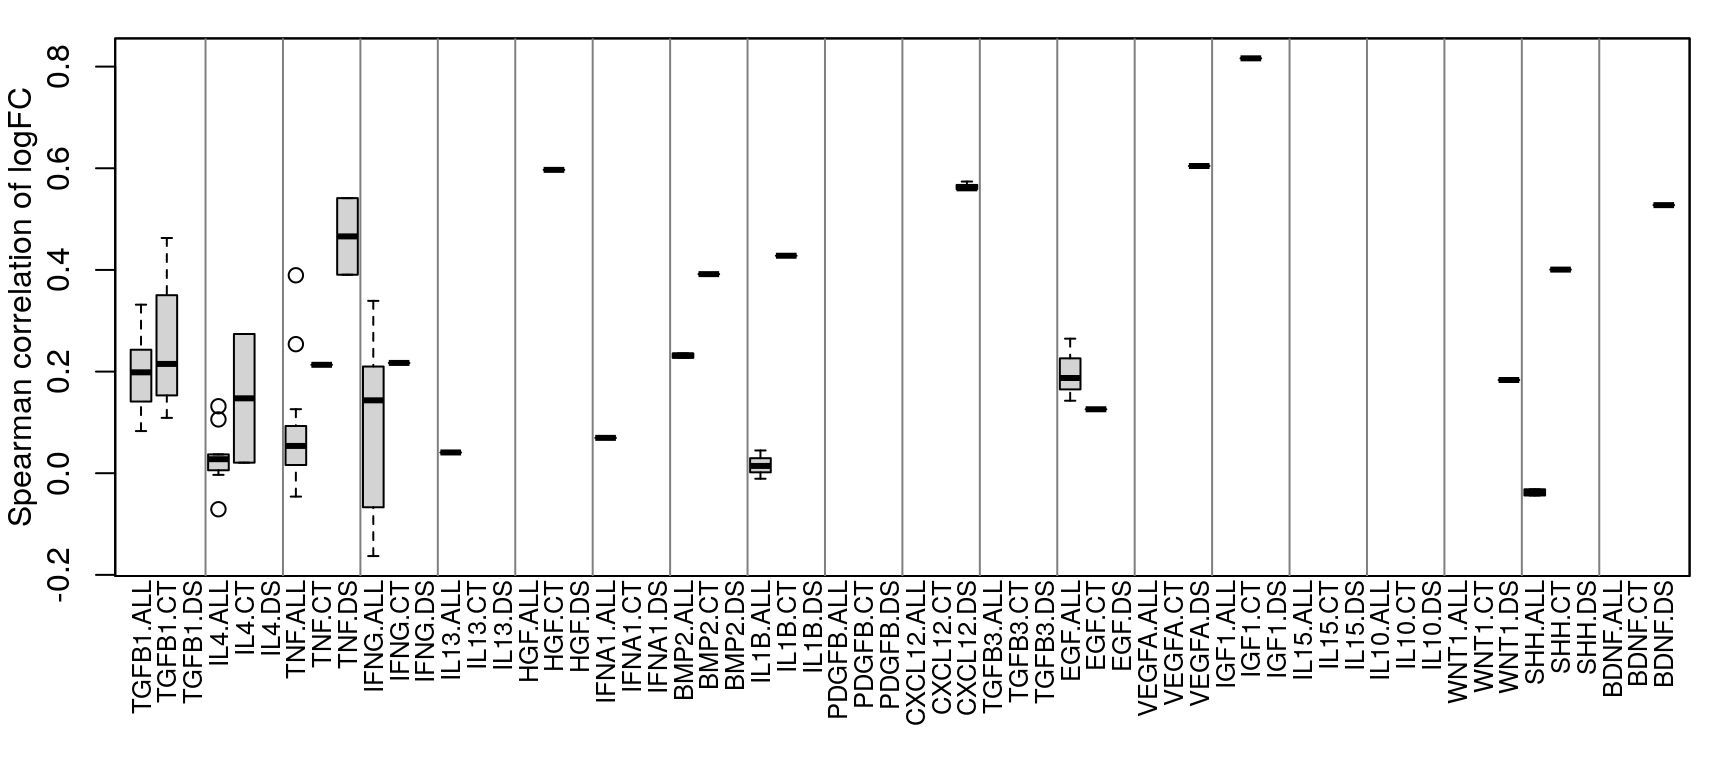
Correlation
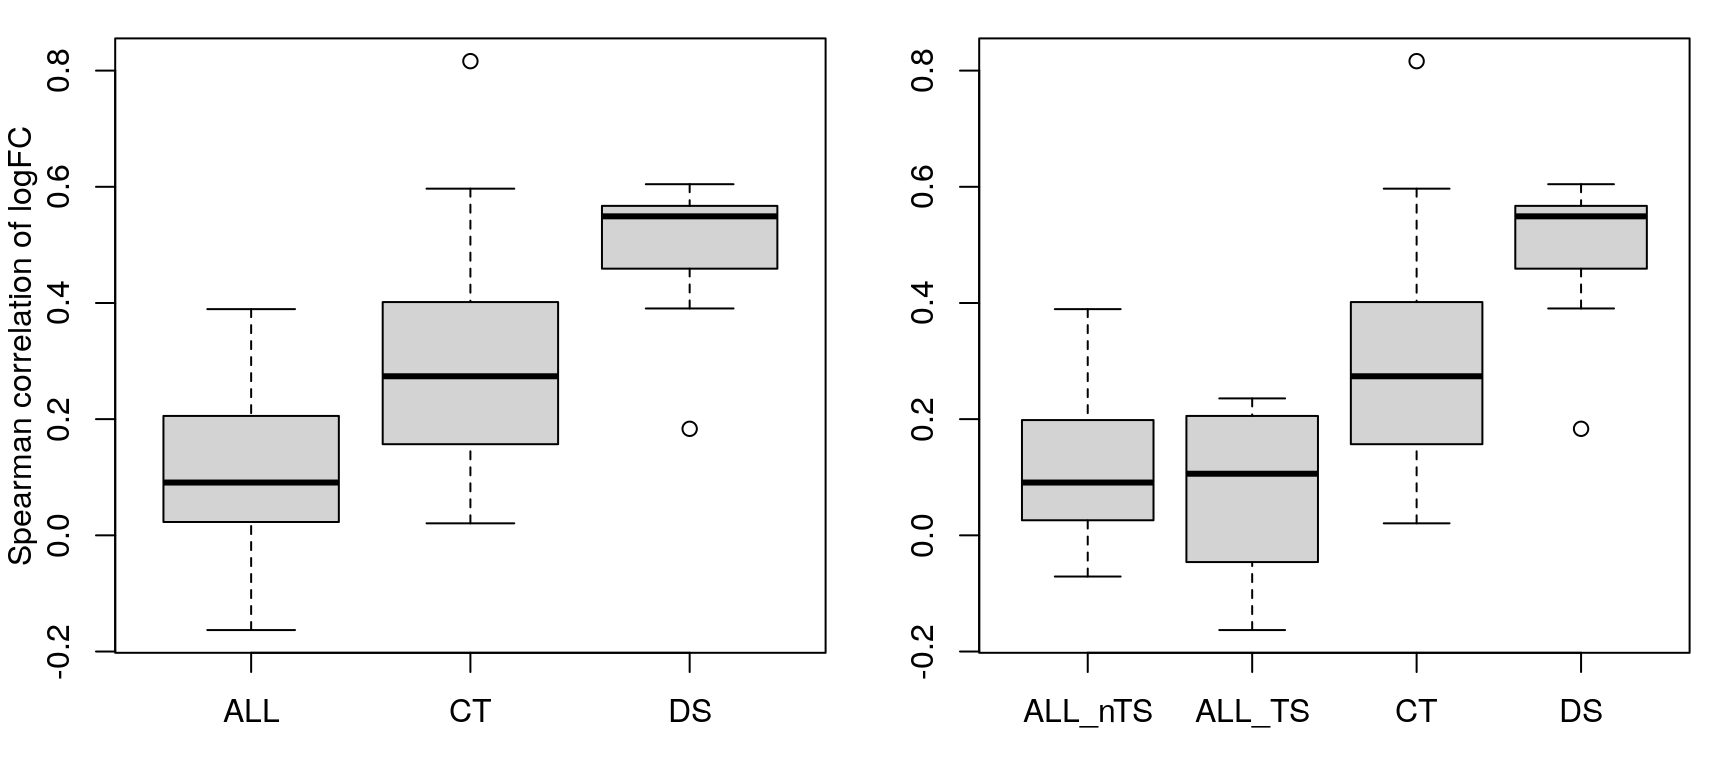 Despite the goofiness of the time-series logFC calculations (all are positive?), there’s no discernible difference in correlation of logFC within time-series experiments vs non-time-series.
Note that calculating correlation between time-series and non-TS logFC values is chaos, so those comparisons are skipped in the following figure.
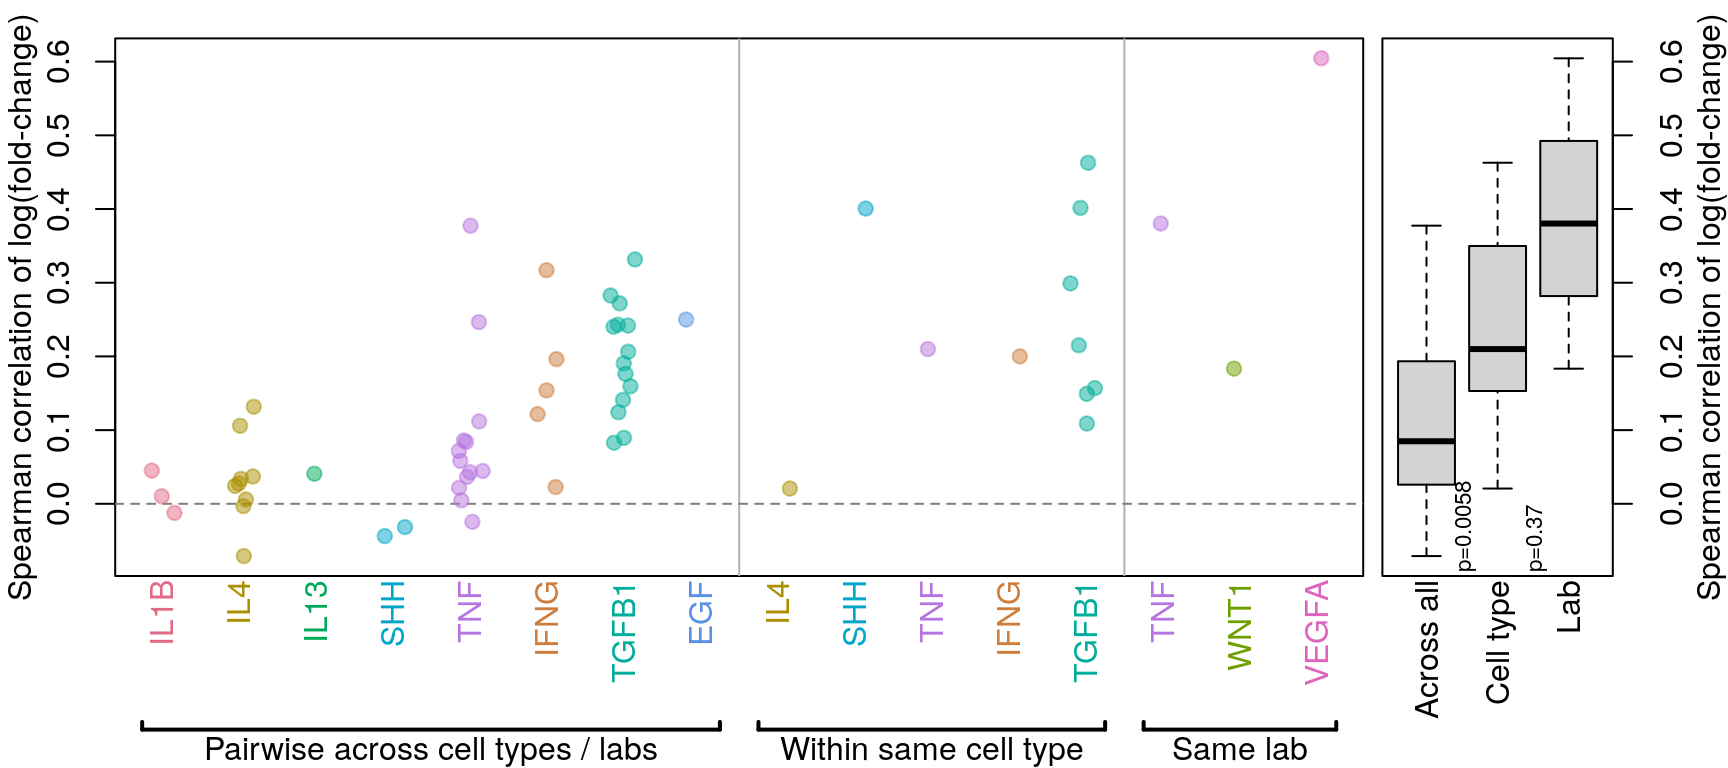
Final correlation figure
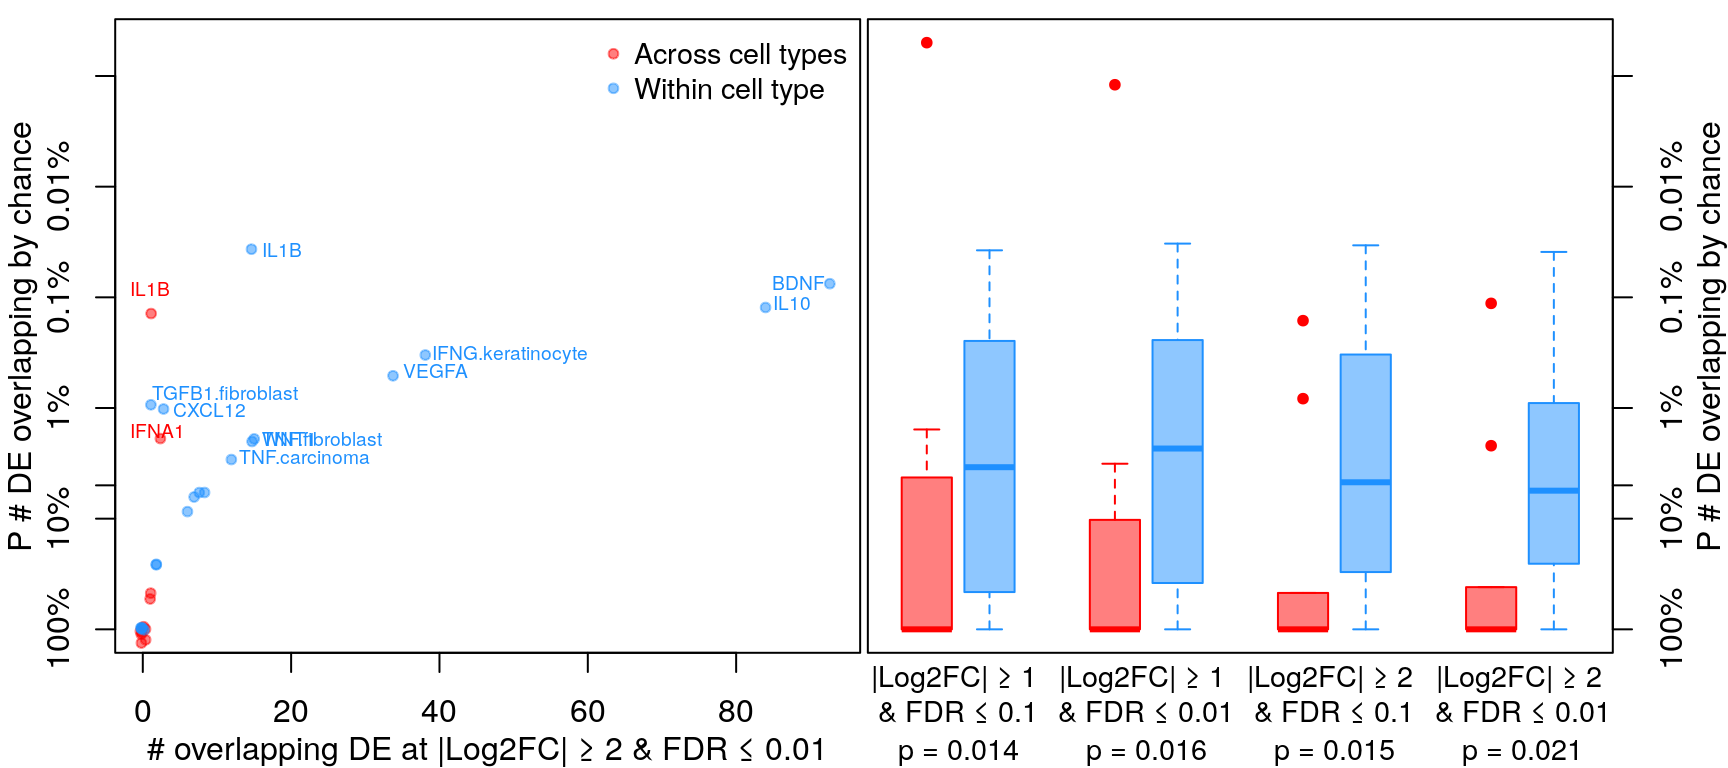
Differential gene expression
Overlap of DE genes
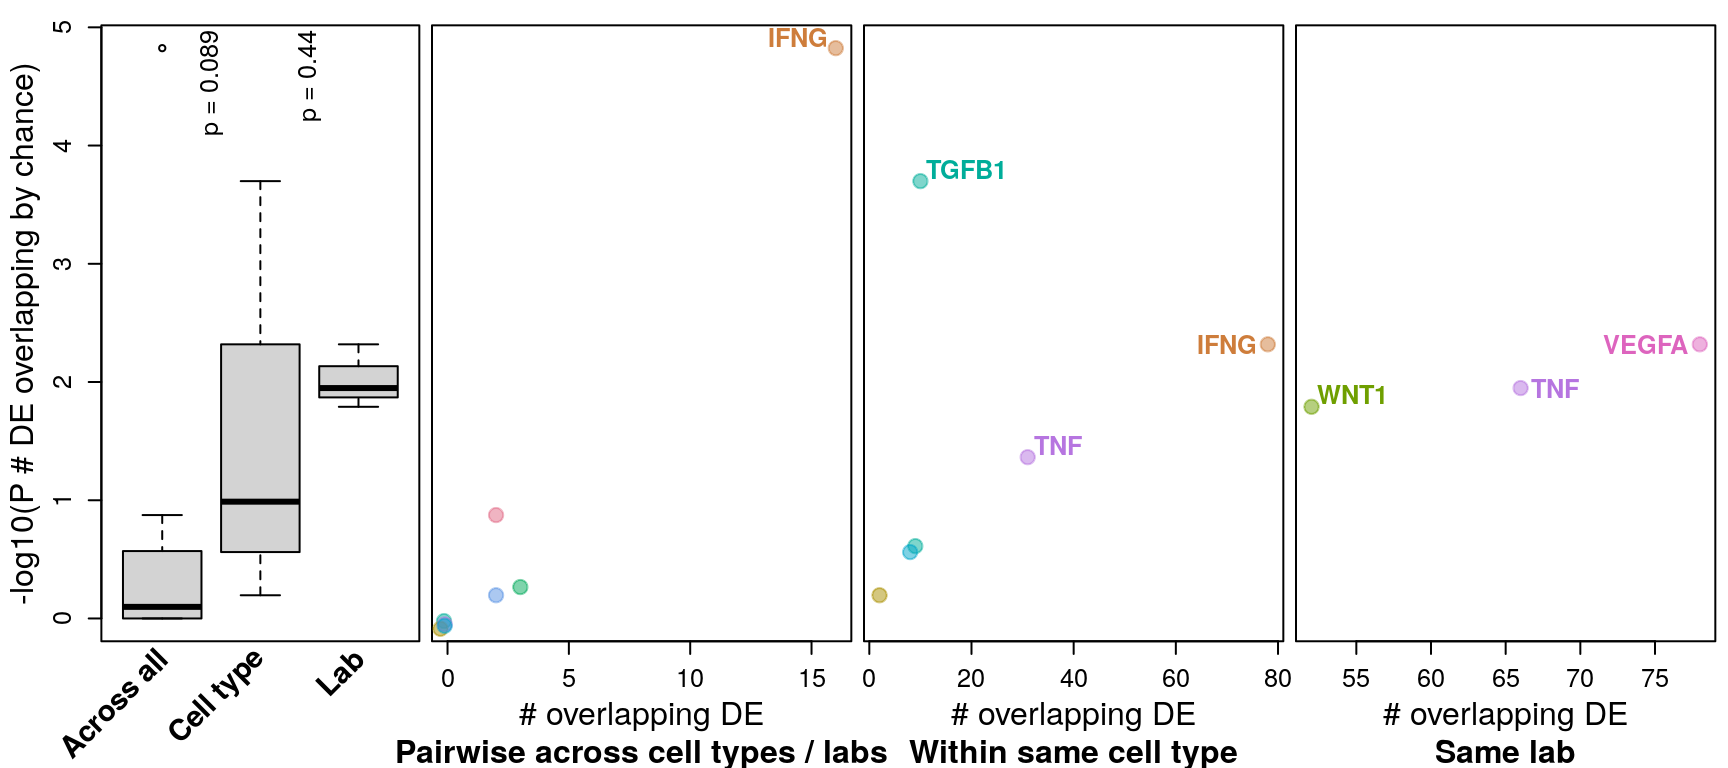
Differentially expressed genes were determined by logFC >= 1 and FDR <= 0.1 (as in Browaeys et al., 2020). This figure shows number of DE genes overlapping across all datasets testing the same ligand vs. datasets testing the same ligand in the same cell type vs. datasets from the same accession number (and same ligand / cell type). P-values for overlap (y-axis) were determined after determining probability of overlapping DE genes by chance through bootstrapping.
Averaged logFC per ligand
Similar to CMap analyses, took mean LogFC across all samples treated with the same ligand, or same ligand in the same cell line, or from the same accession number (and same ligand / cell line).
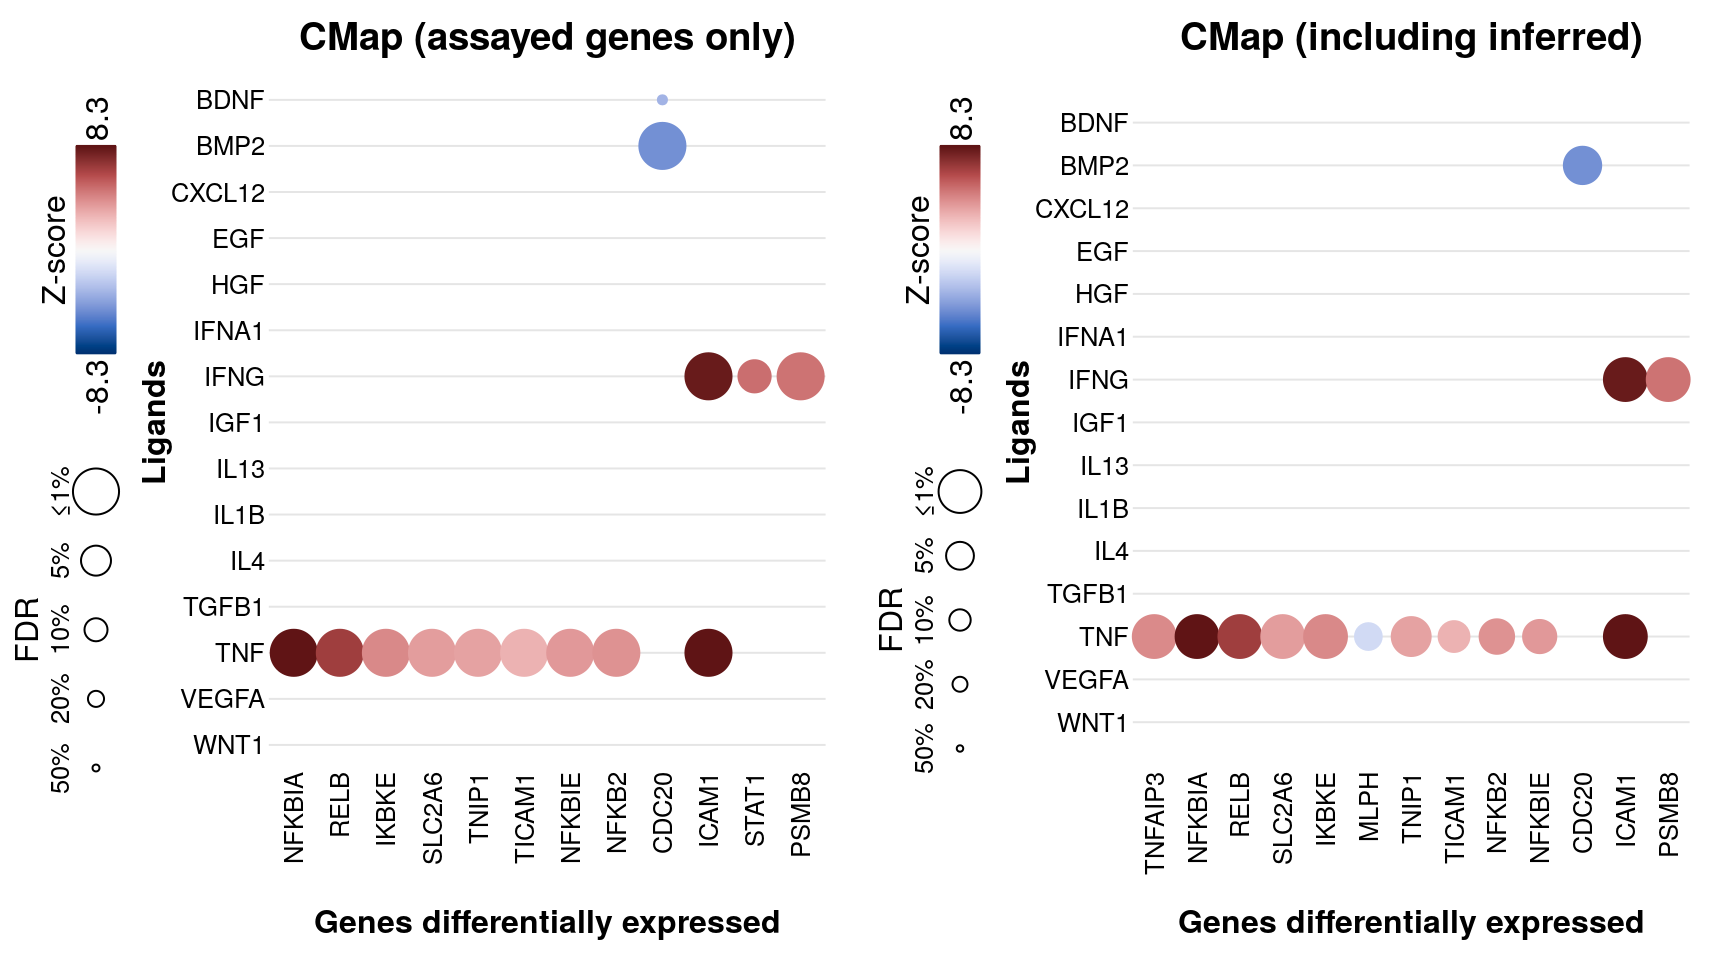
Averaged logFC per ligand compared to CMap
Connectivity Map data from the same set of ligands assayed in multiple experiments from the NicheNet datasets.
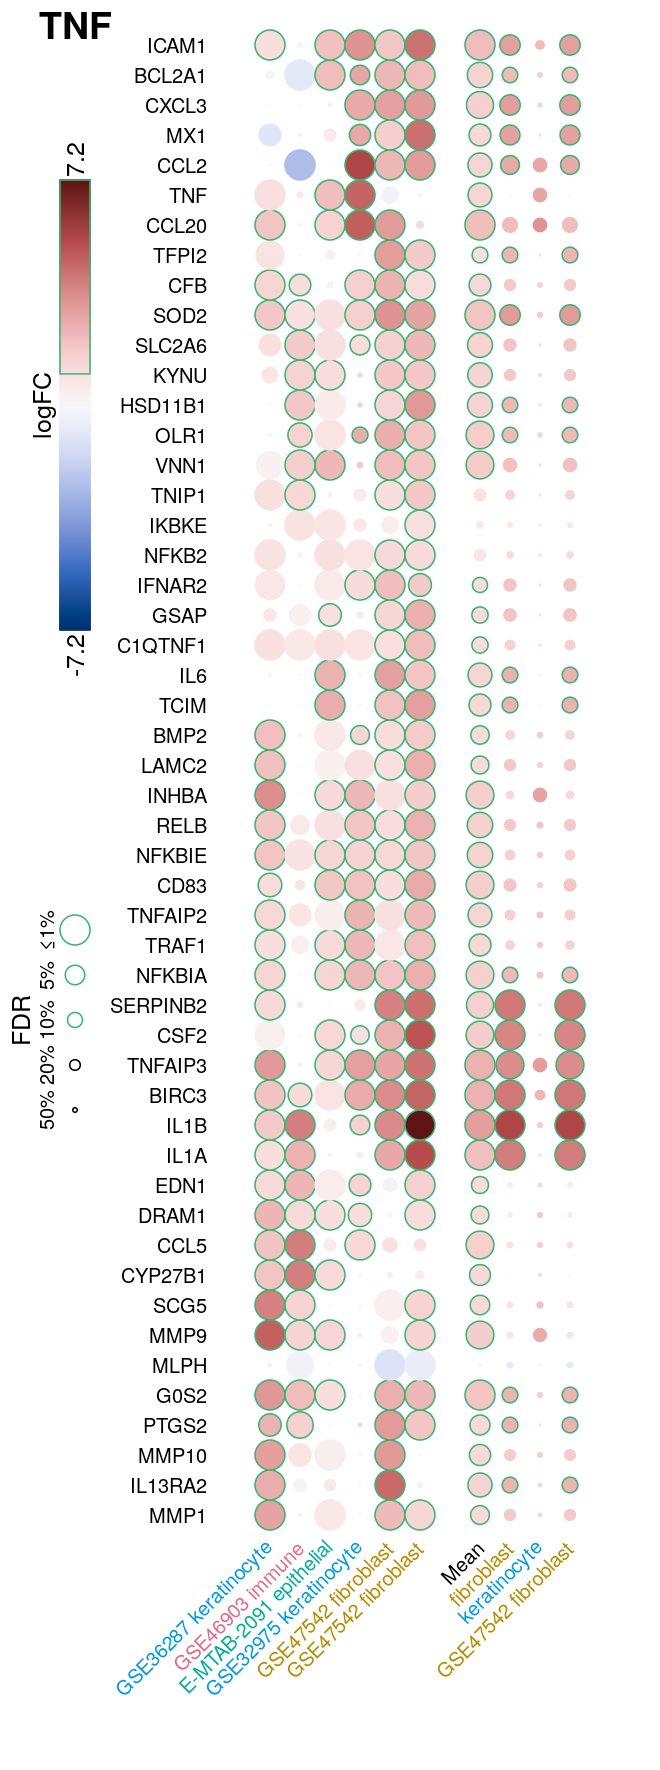
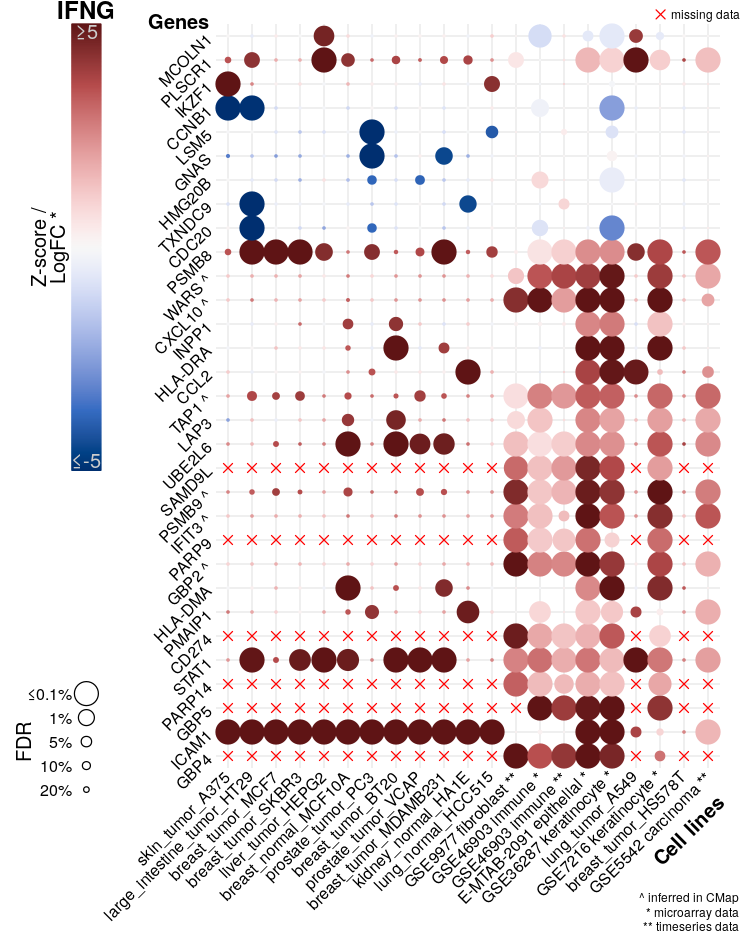
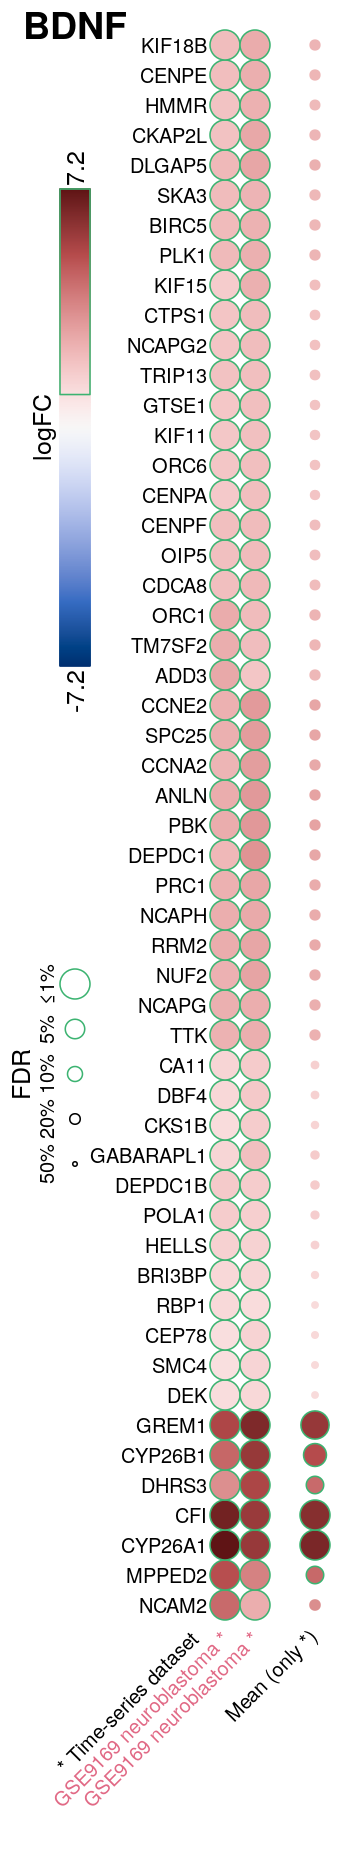
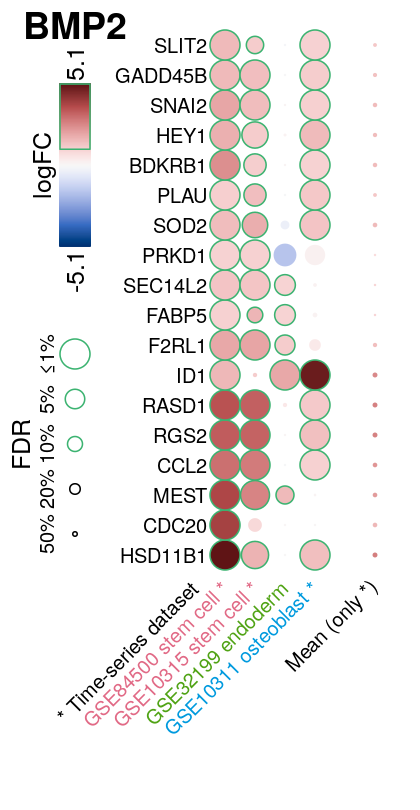
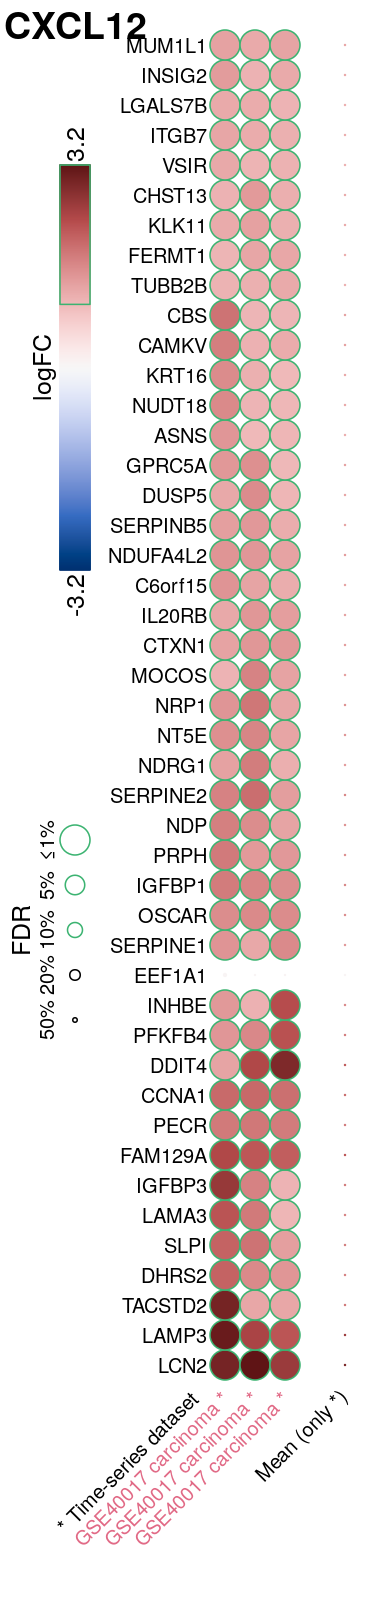
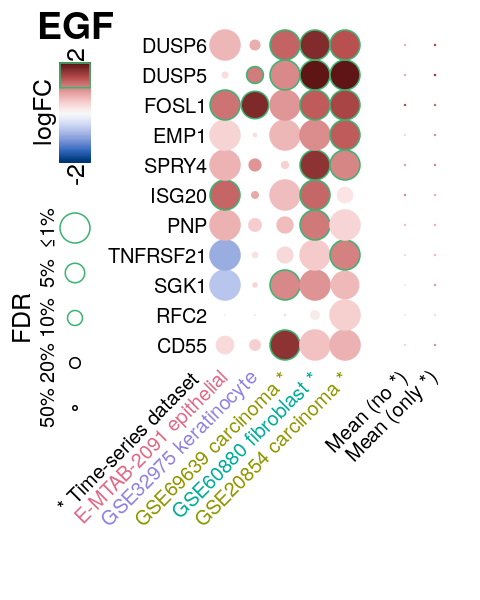
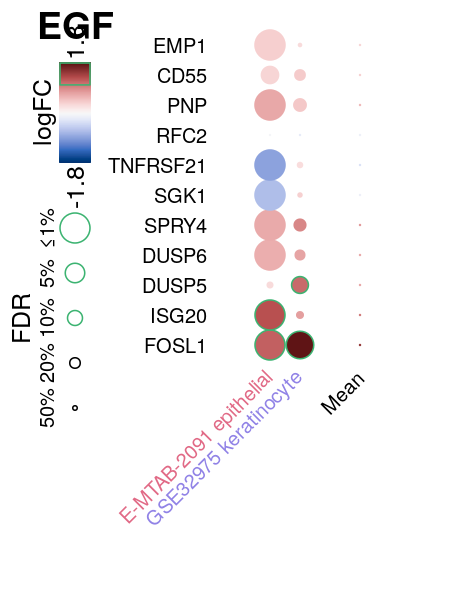
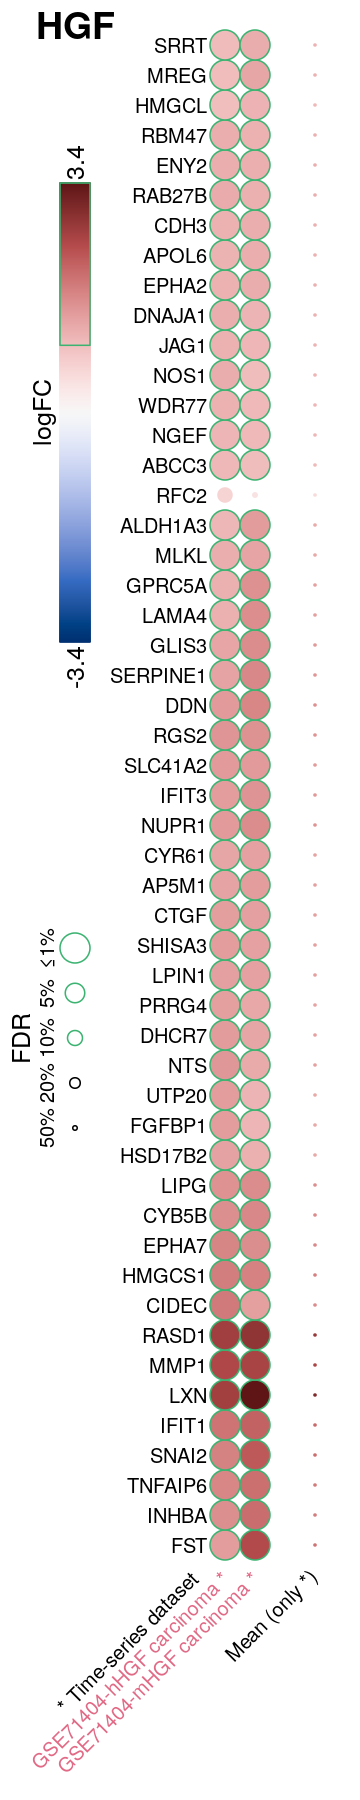
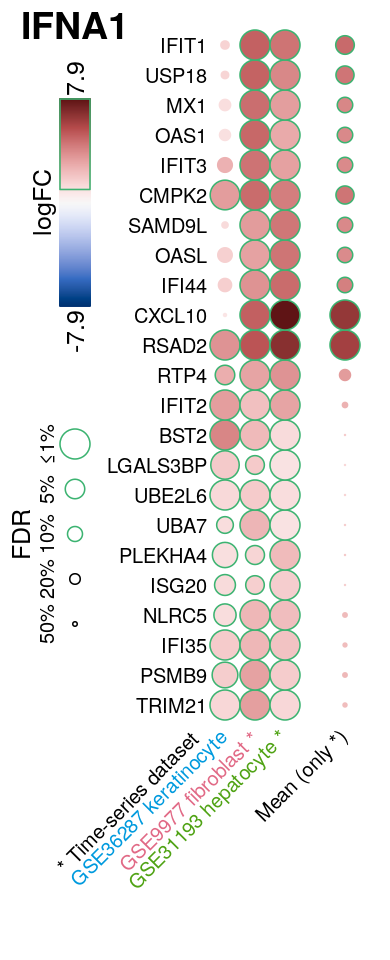
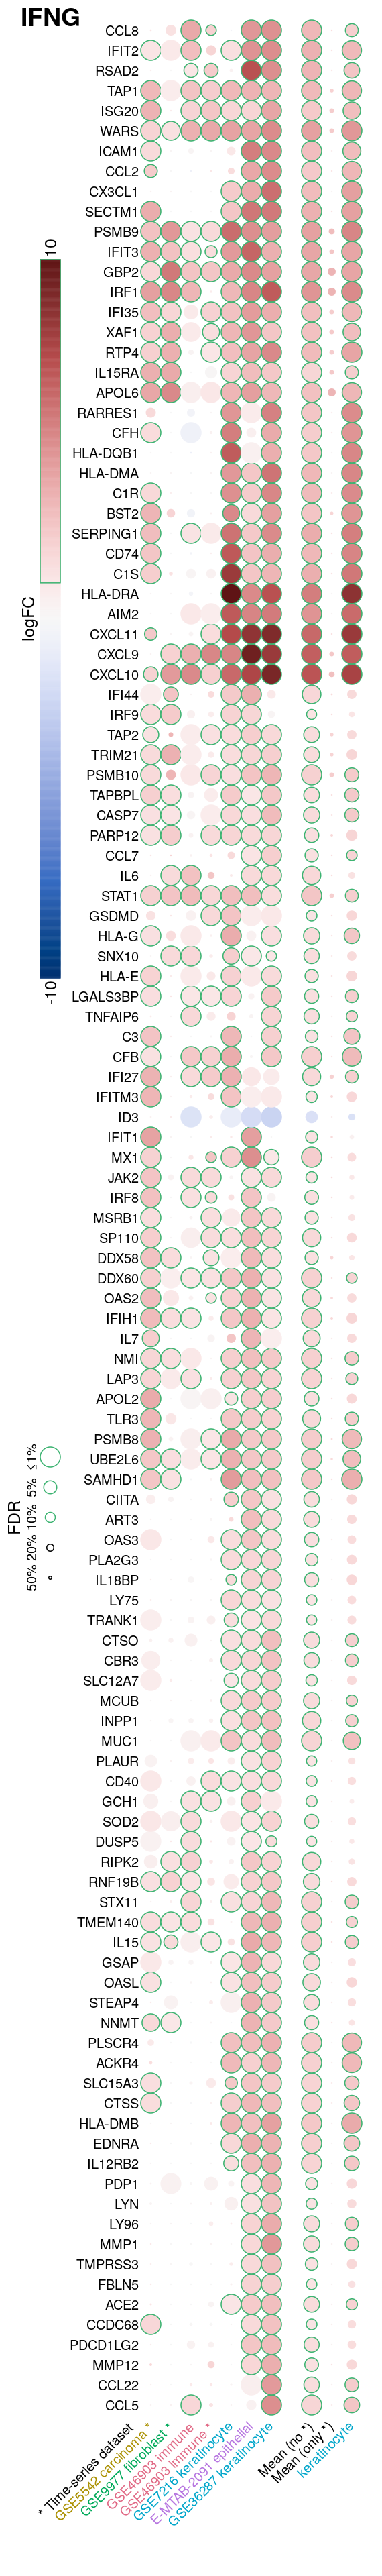
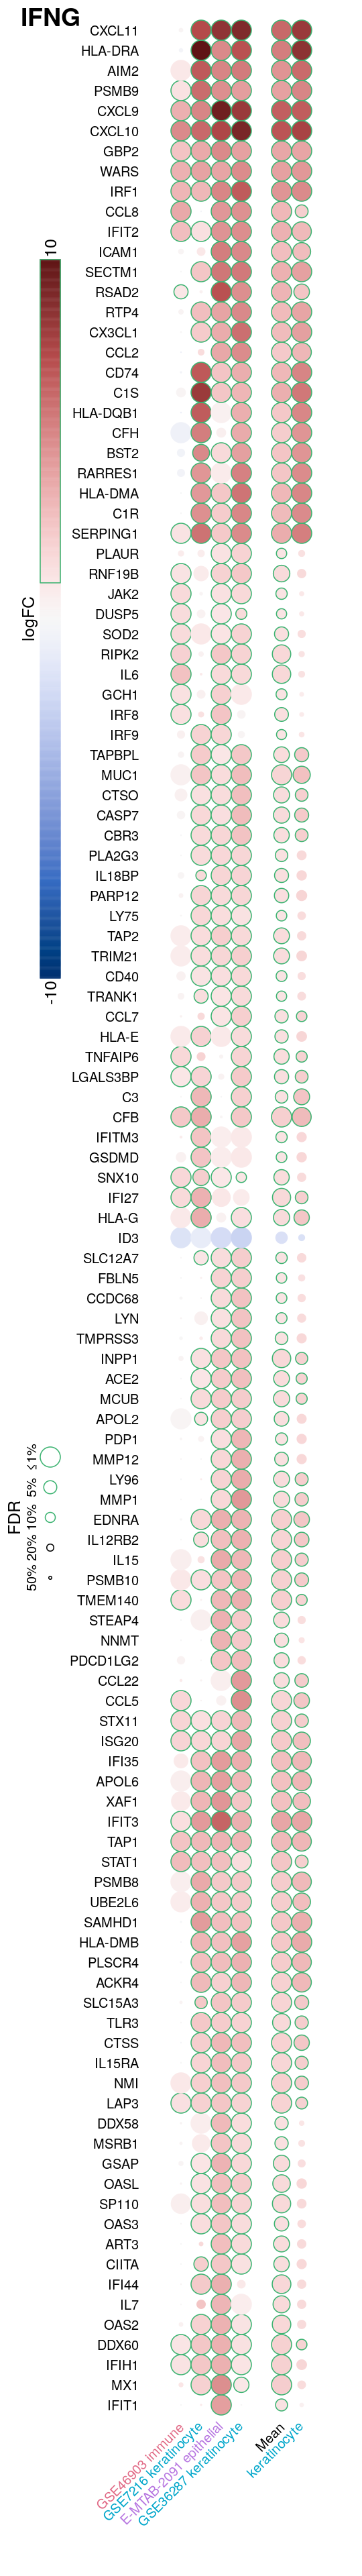
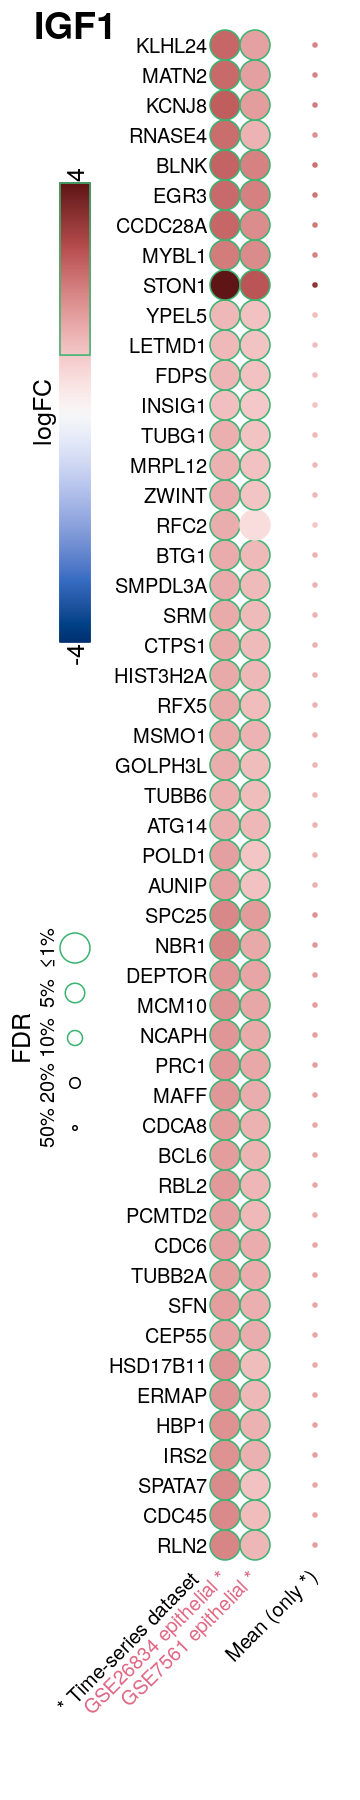
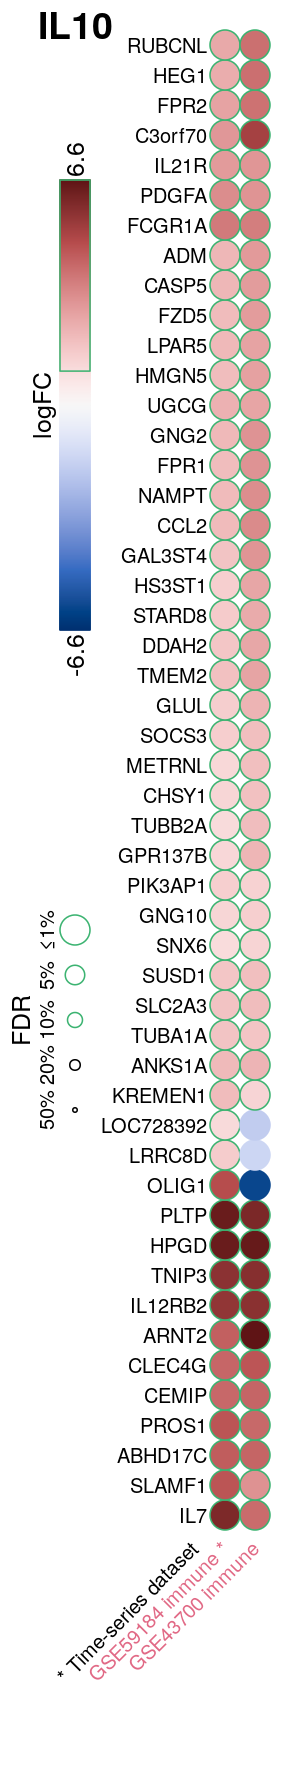
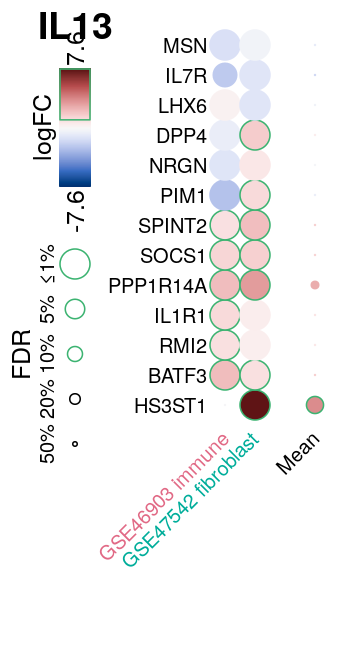
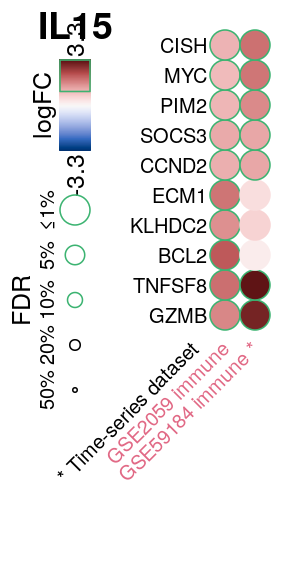
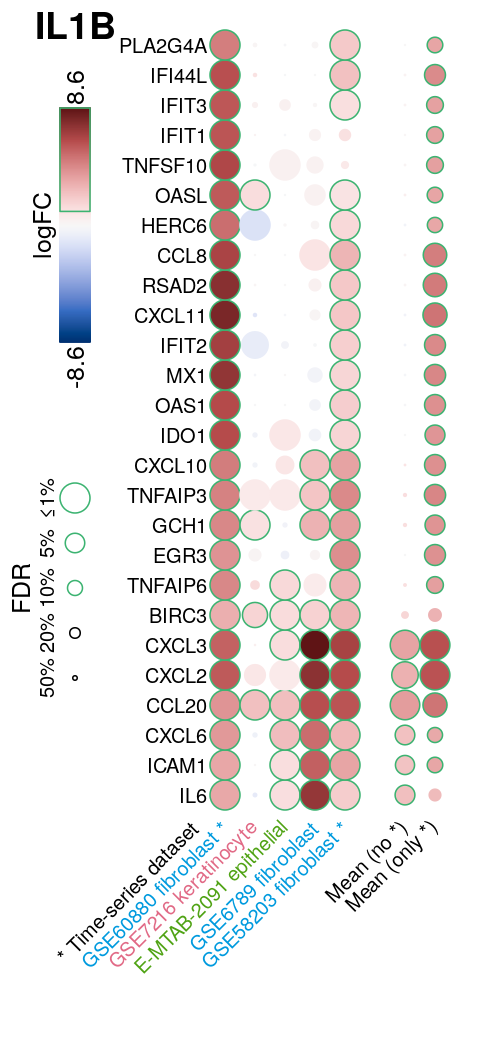
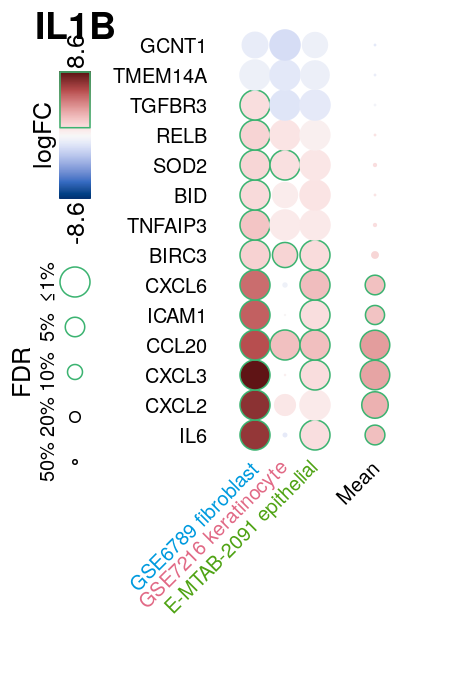
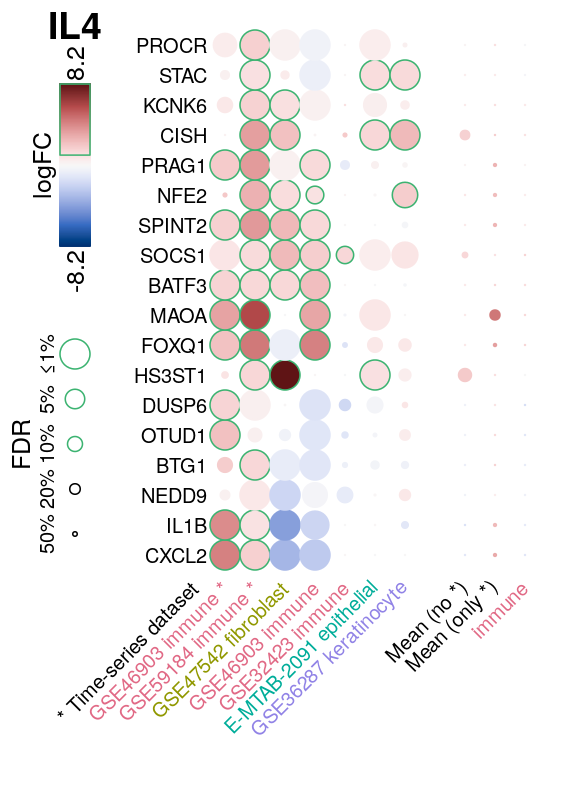
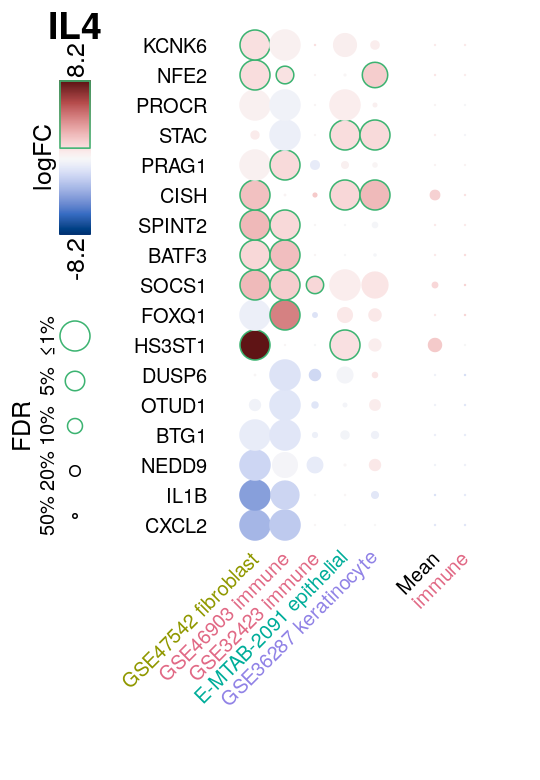
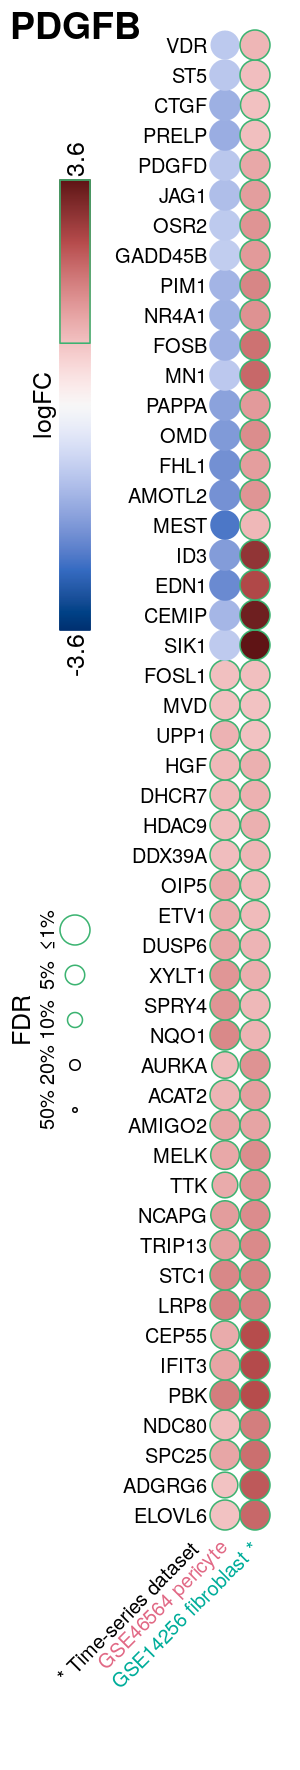
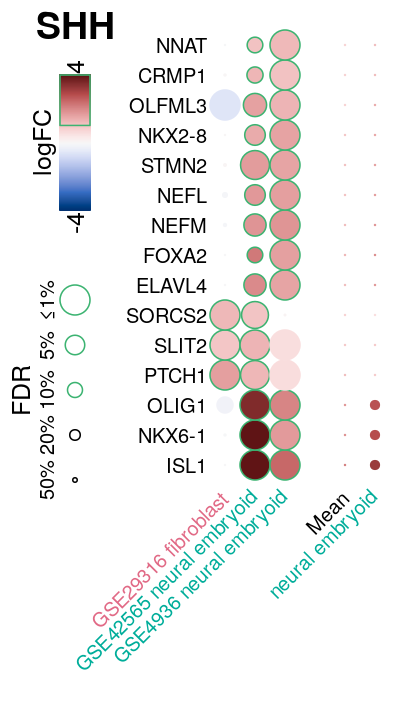
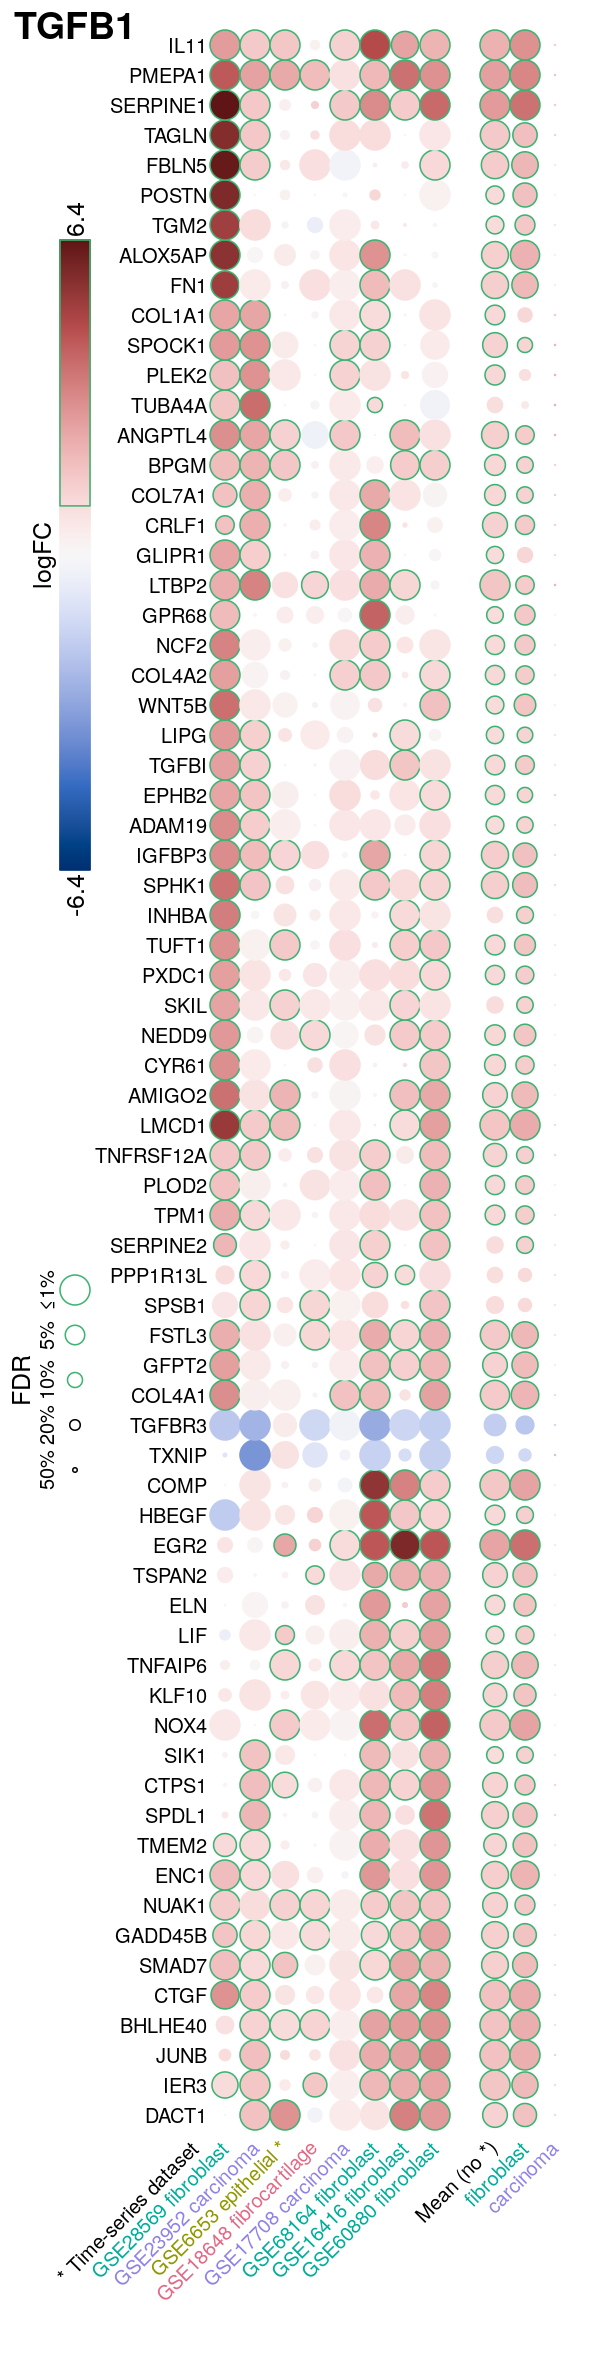
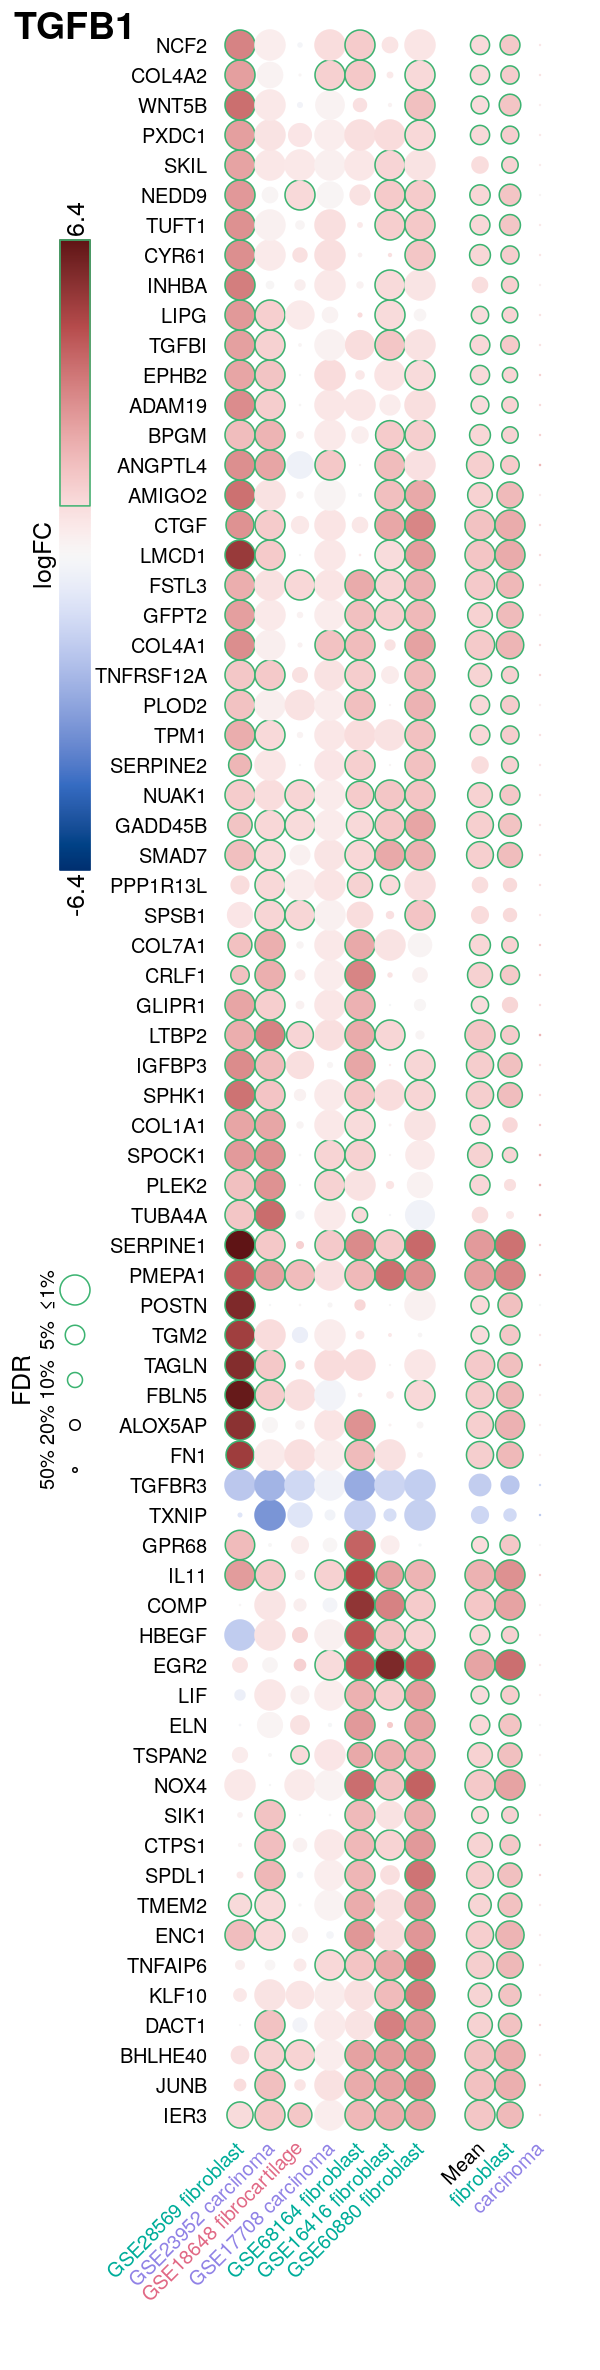
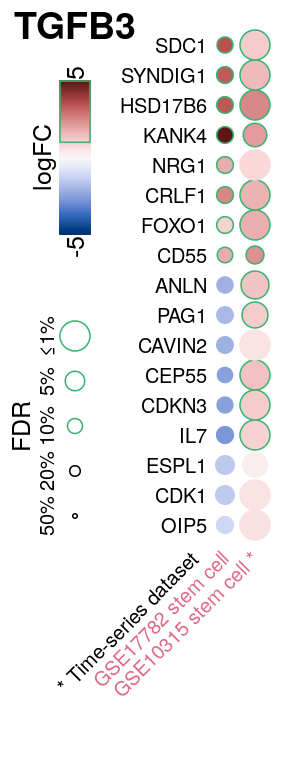
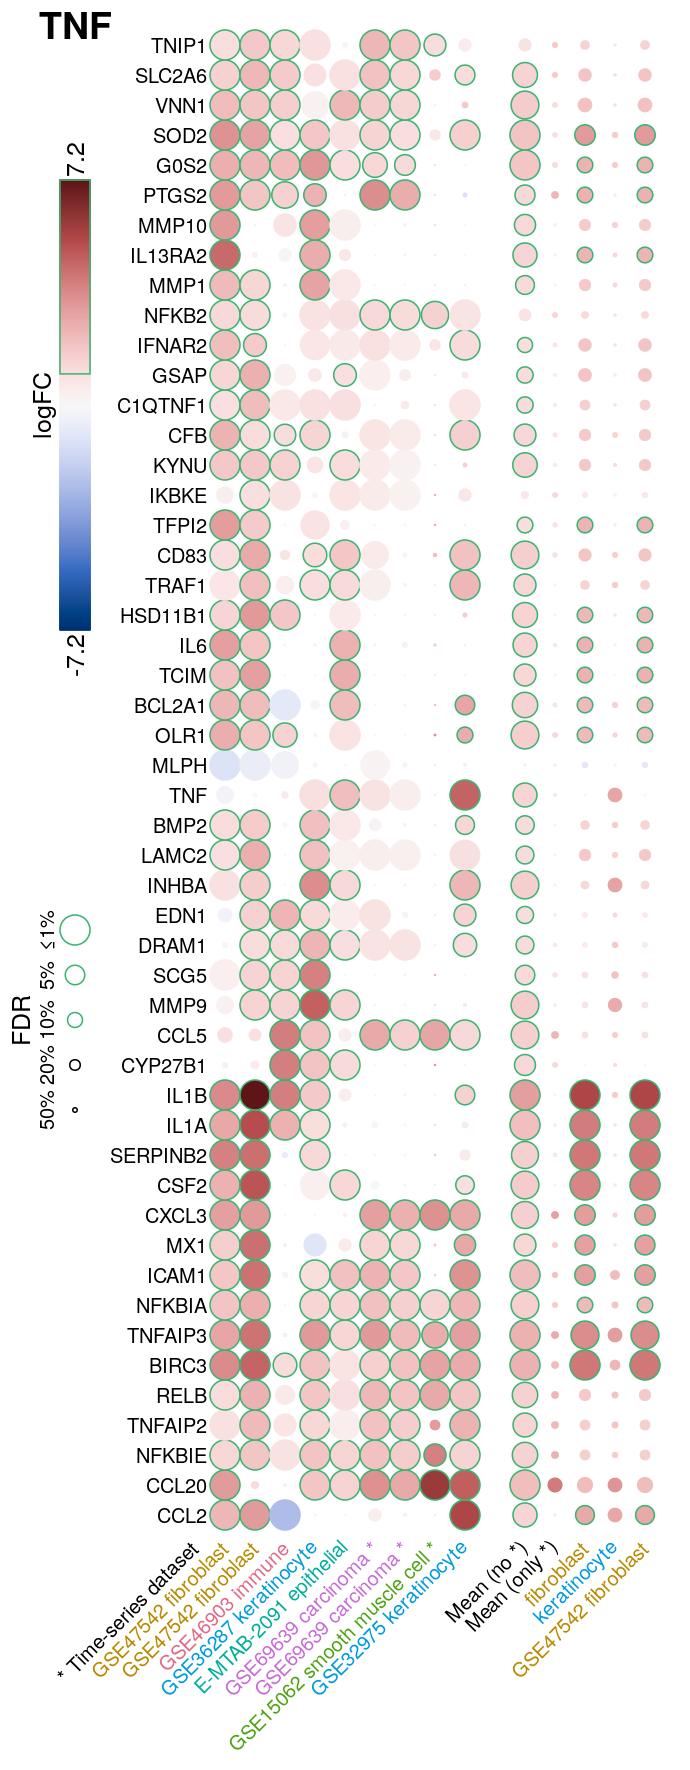
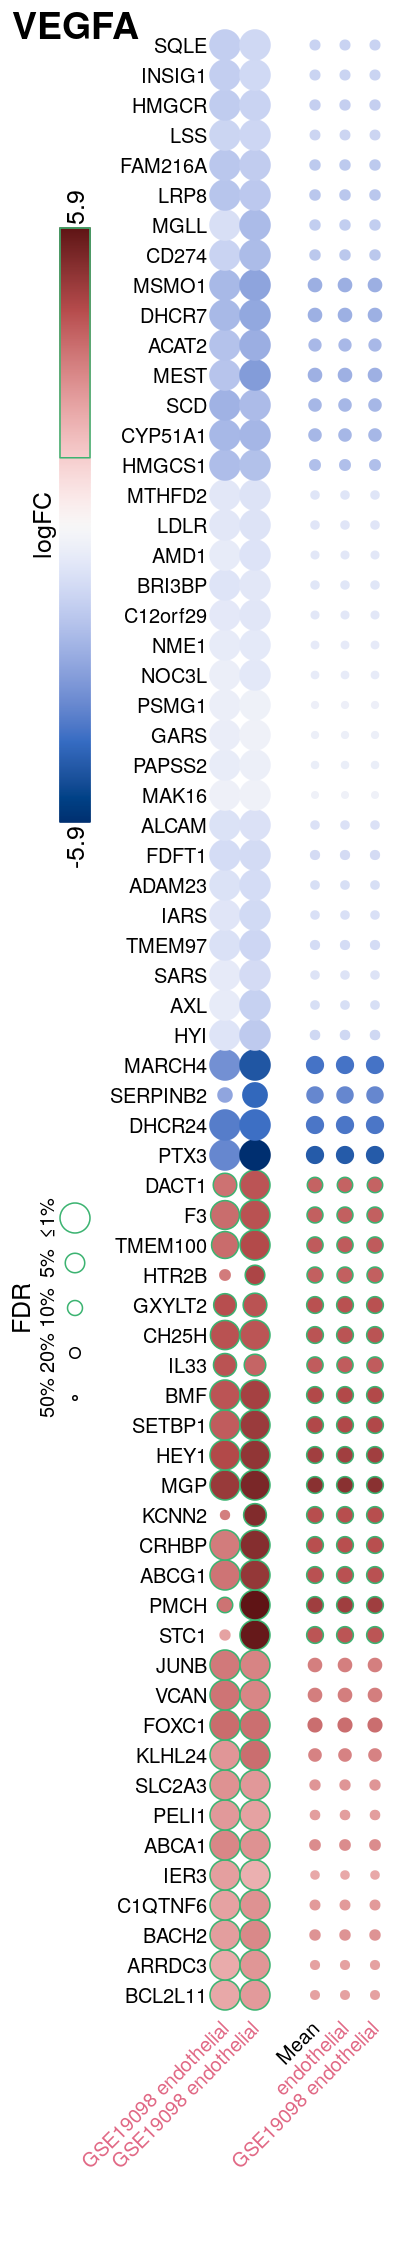
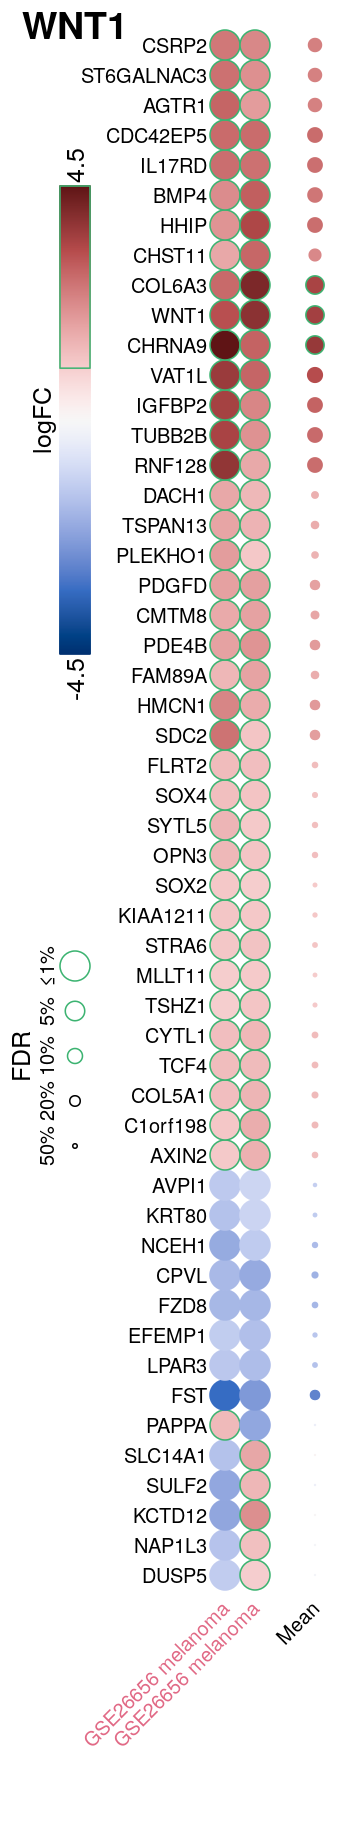
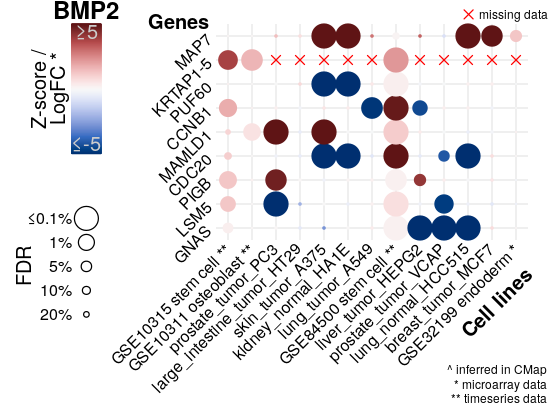
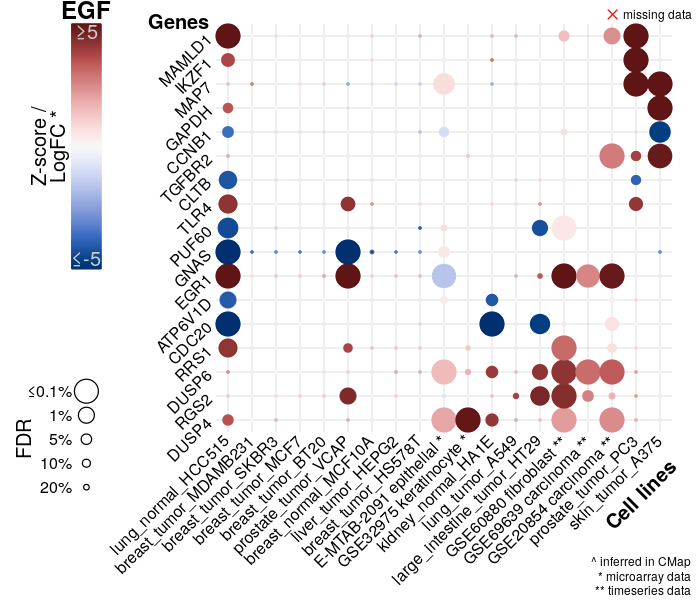
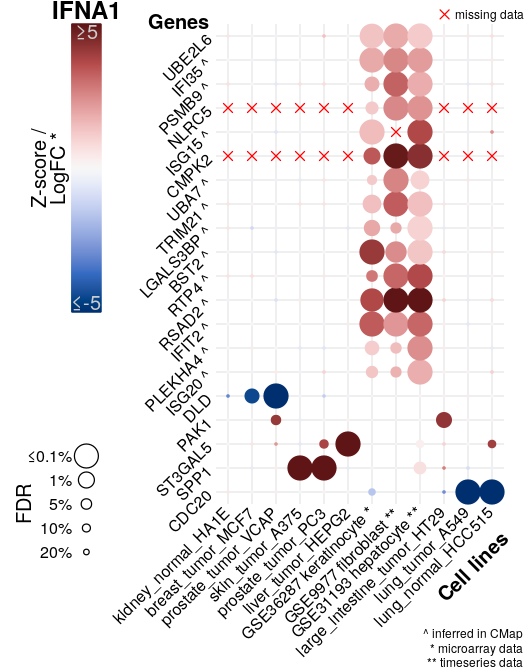
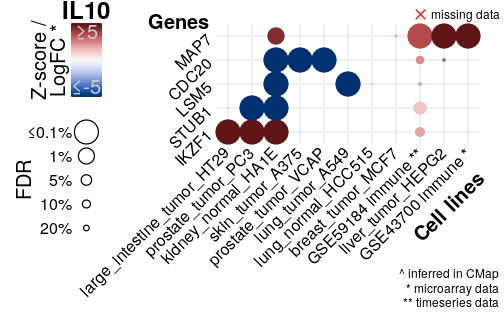
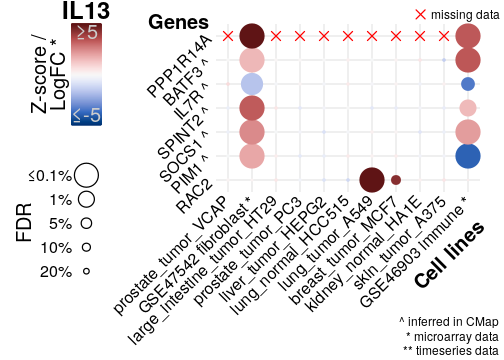
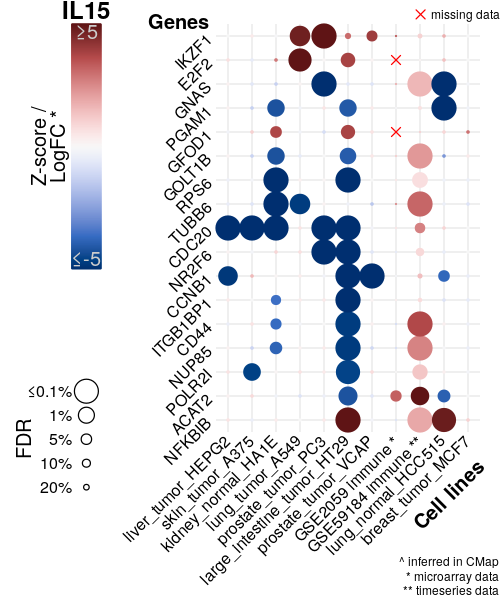
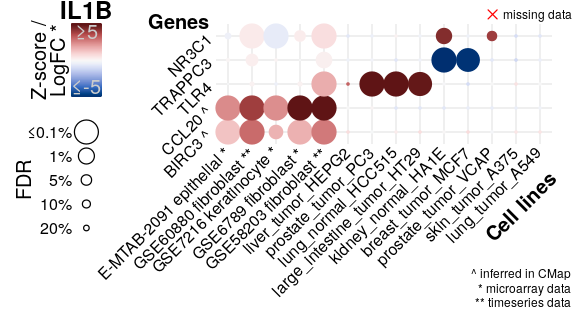
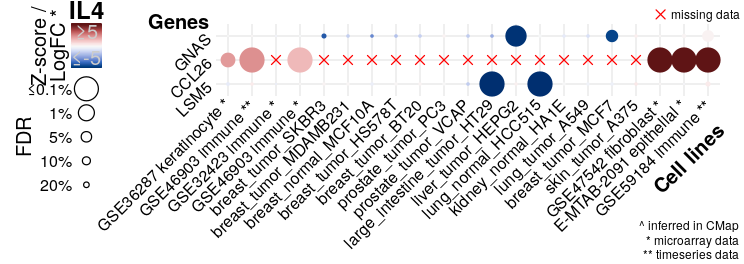
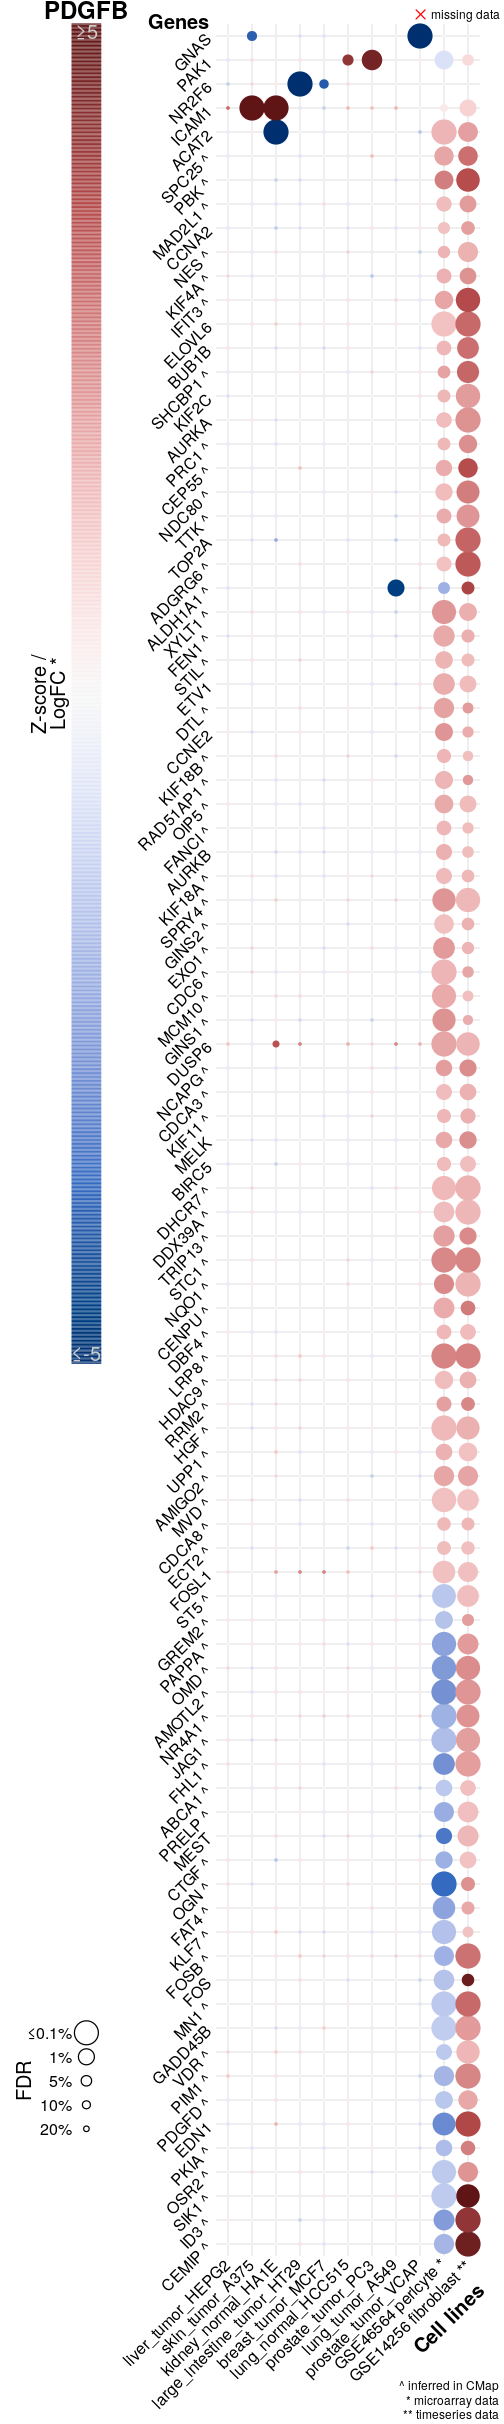
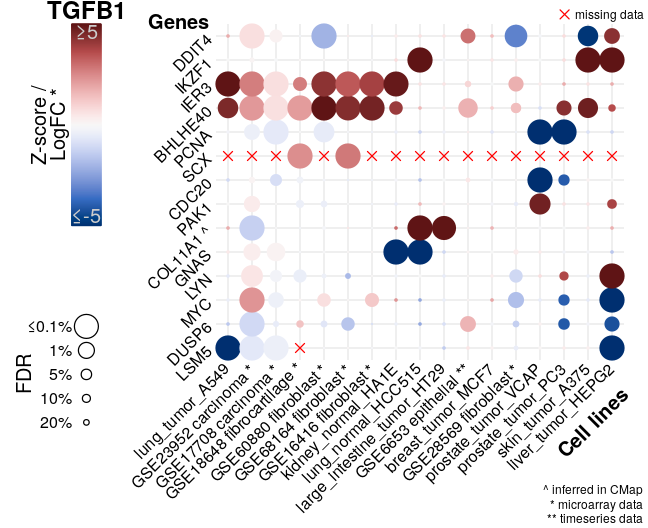
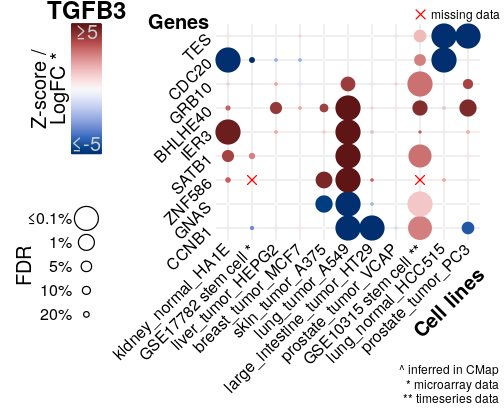
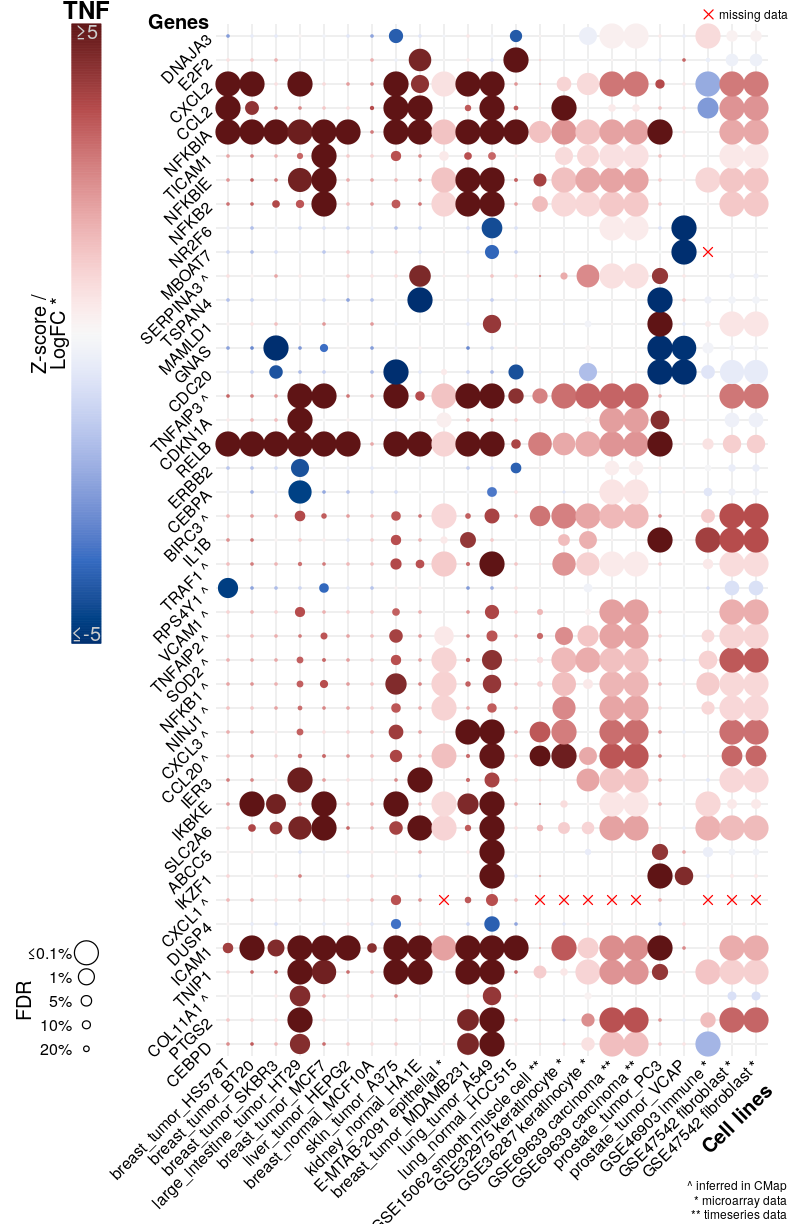
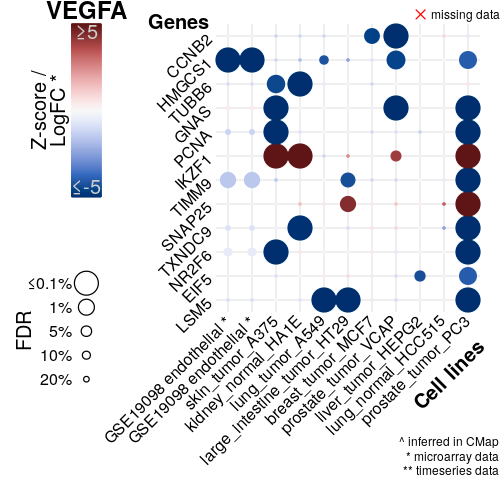
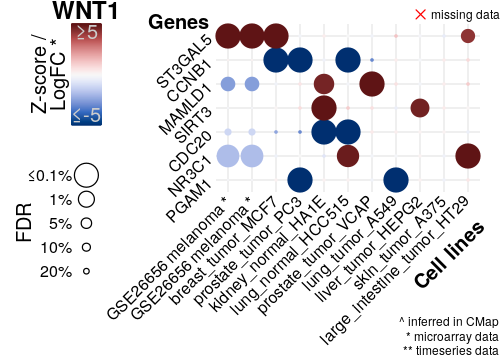
Modified heatmaps showing logFC and FDR for selected genes from each sample from the NicheNet gold standard, as well as averages across all samples, all cell types, and all datasets where available. The figure below is an example for TNF.
| BDNF | | BMP2 | | CXCL12 | | EGF(no time-series) |
| HGF | | IFNA1 | | IFNG(no time-series) | | IGF1 |
| IL10 | | IL13(no time-series) | | IL15 | | IL1B(no time-series) |
| IL4(no time-series) | | PDGFB | | SHH(no time-series) | | TGFB1(no time-series) |
| TGFB3 | | TNF(no time-series) | | VEGFA(no time-series) | | WNT1(no time-series) |
After removing time-series data
Correlation
Differential gene expression