Differential Gene Expression overlap
Calculating significantly differentially expressed genes by Z-score threshold (90th, 95th, and 99th percentile). No weighting during averaging (unlike Connectivity Map level 5 data, which weights correlated replicates higher).
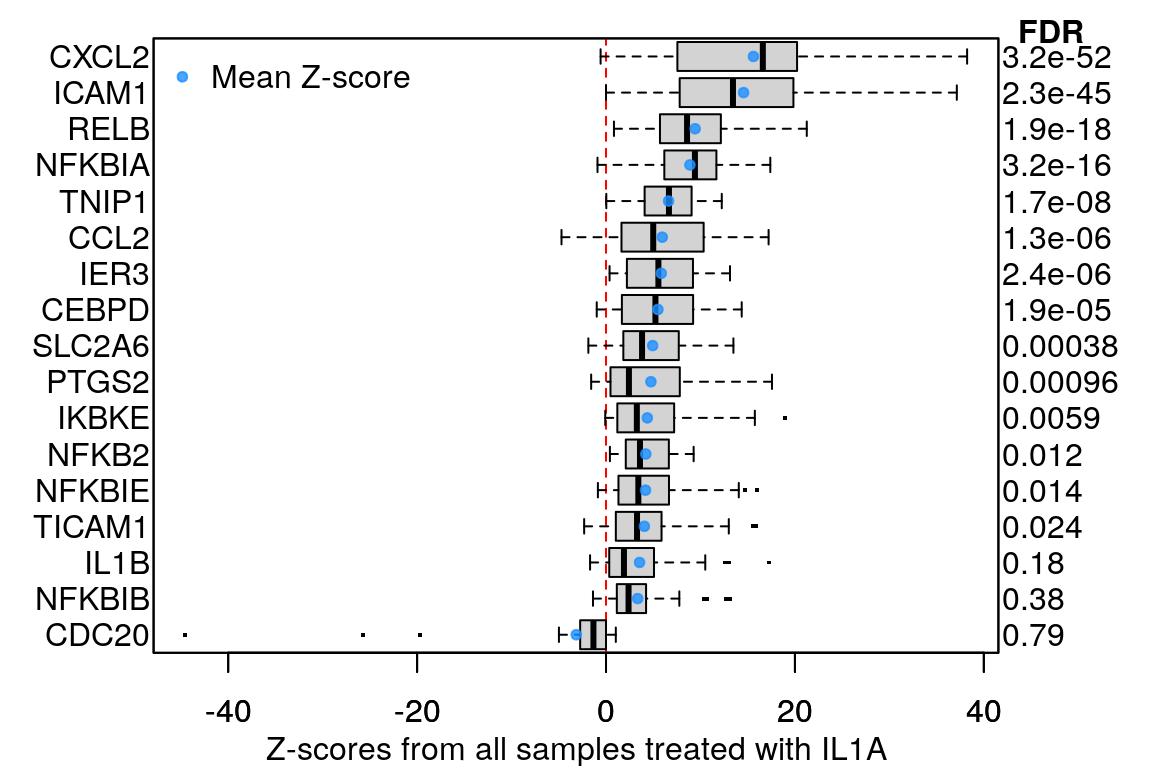
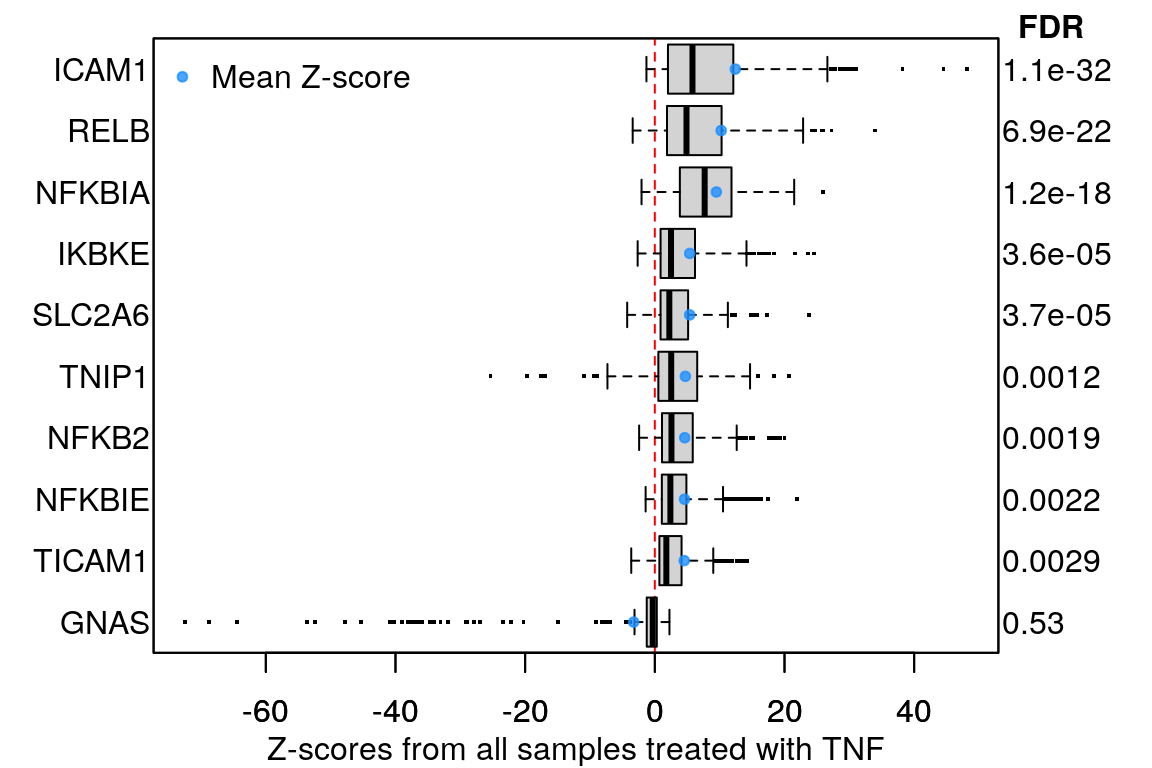
Averaging per ligand
16 ligands, ‘landmark’ genes only
295 ligands, ‘landmark’ genes only
Example plot to clarify what “averaging per ligand” means:
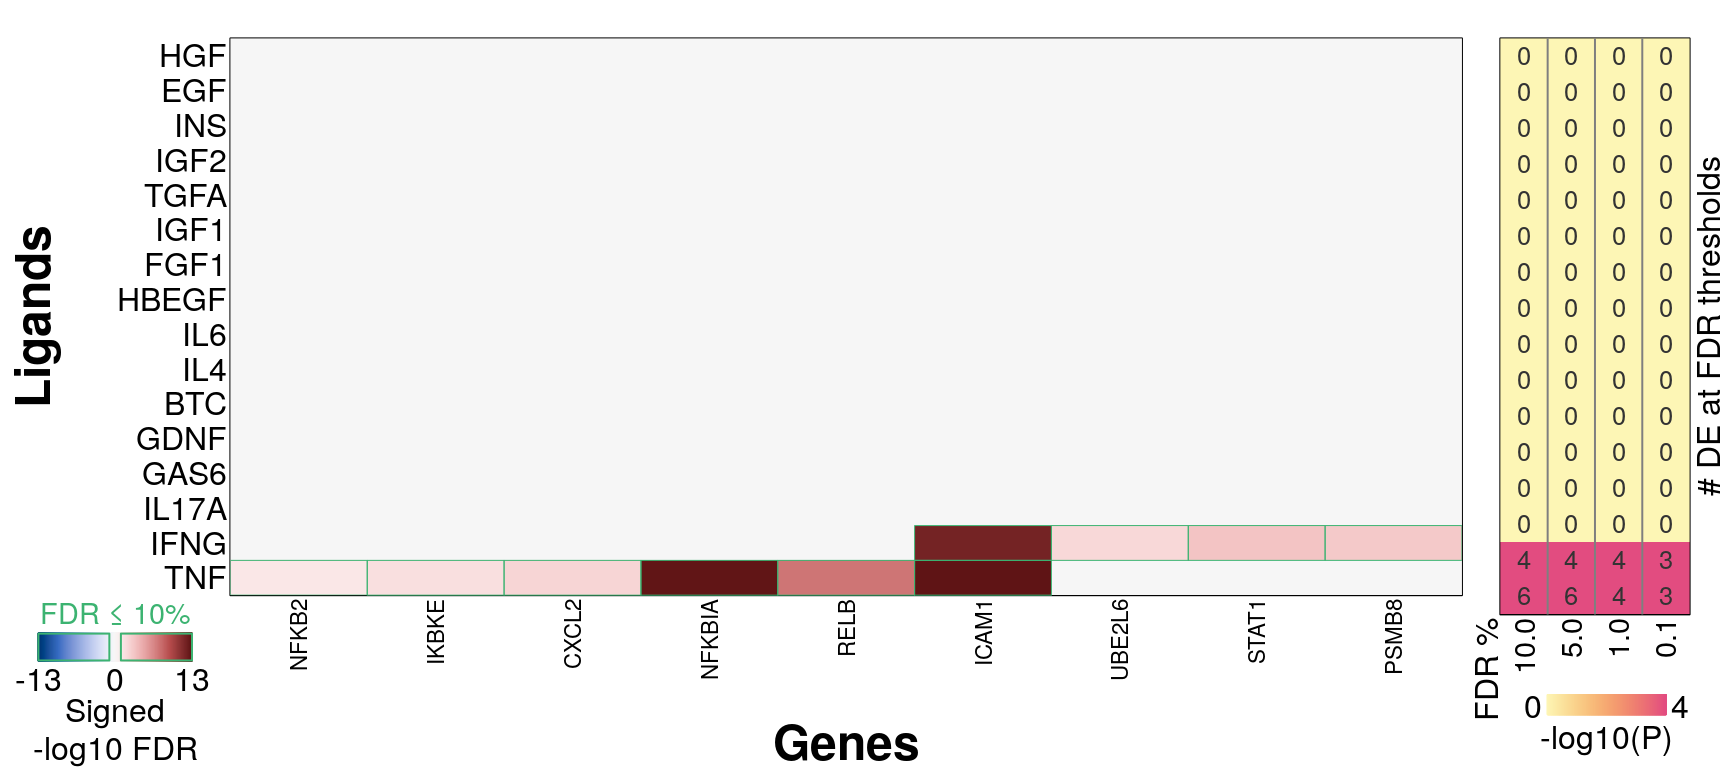
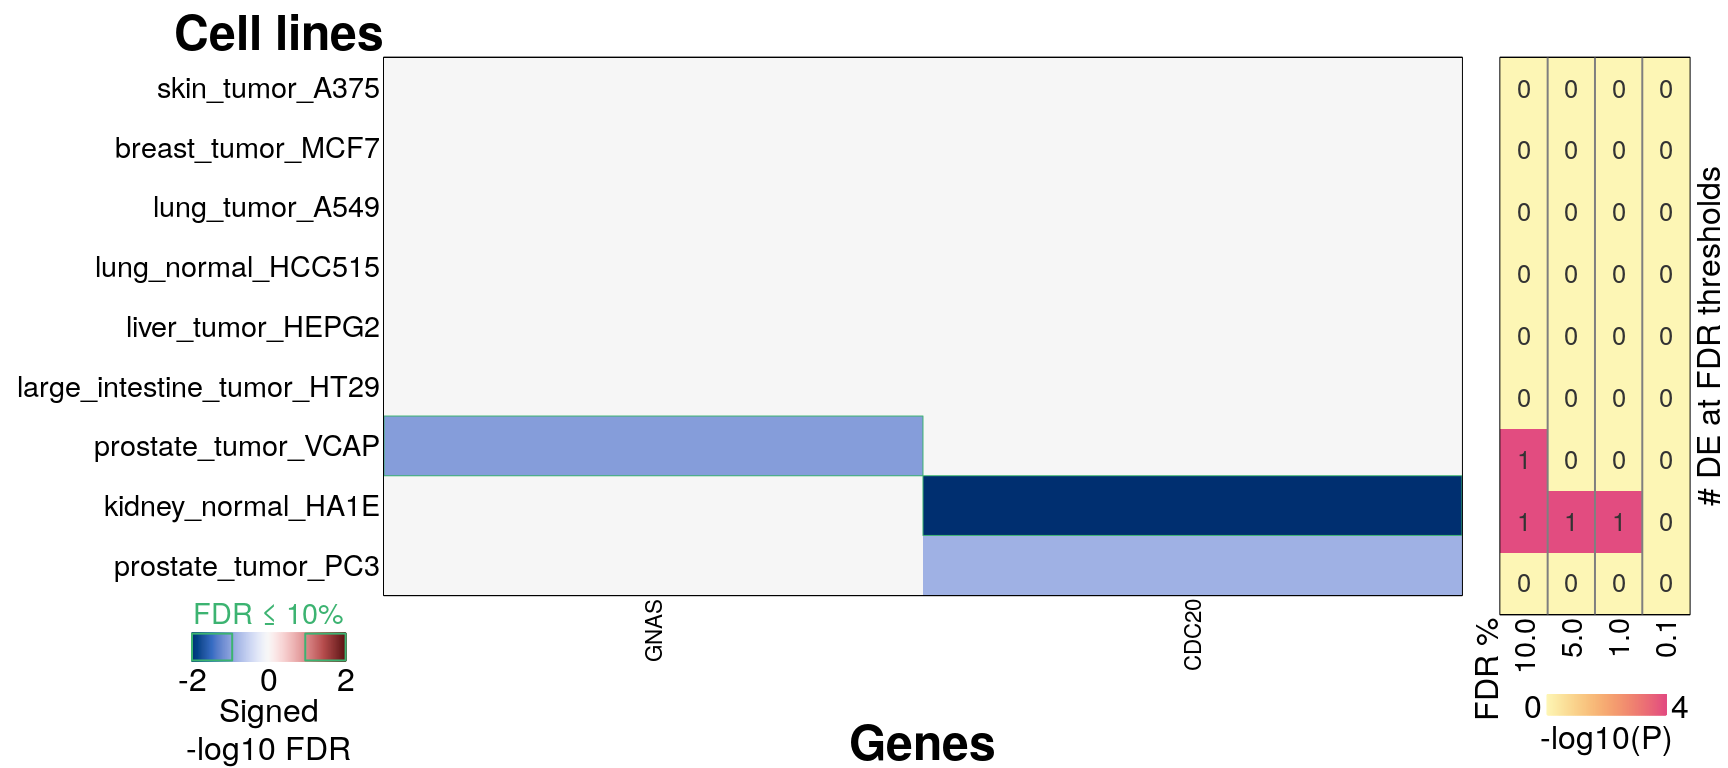
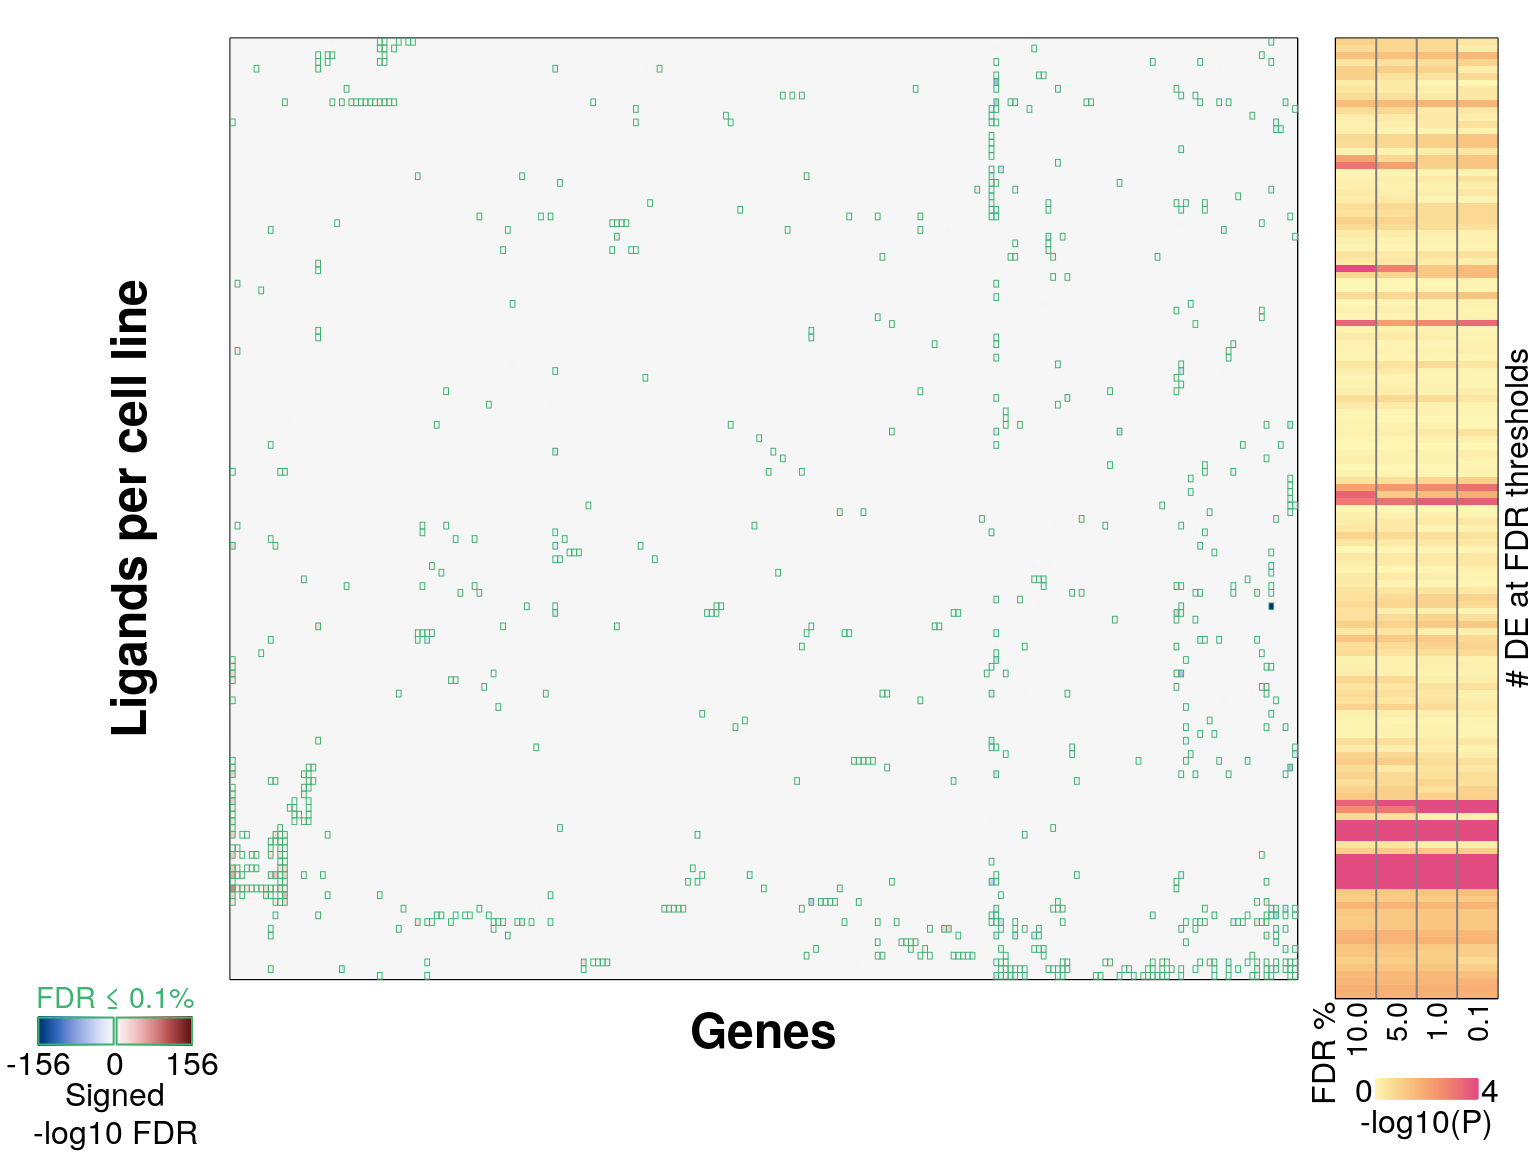
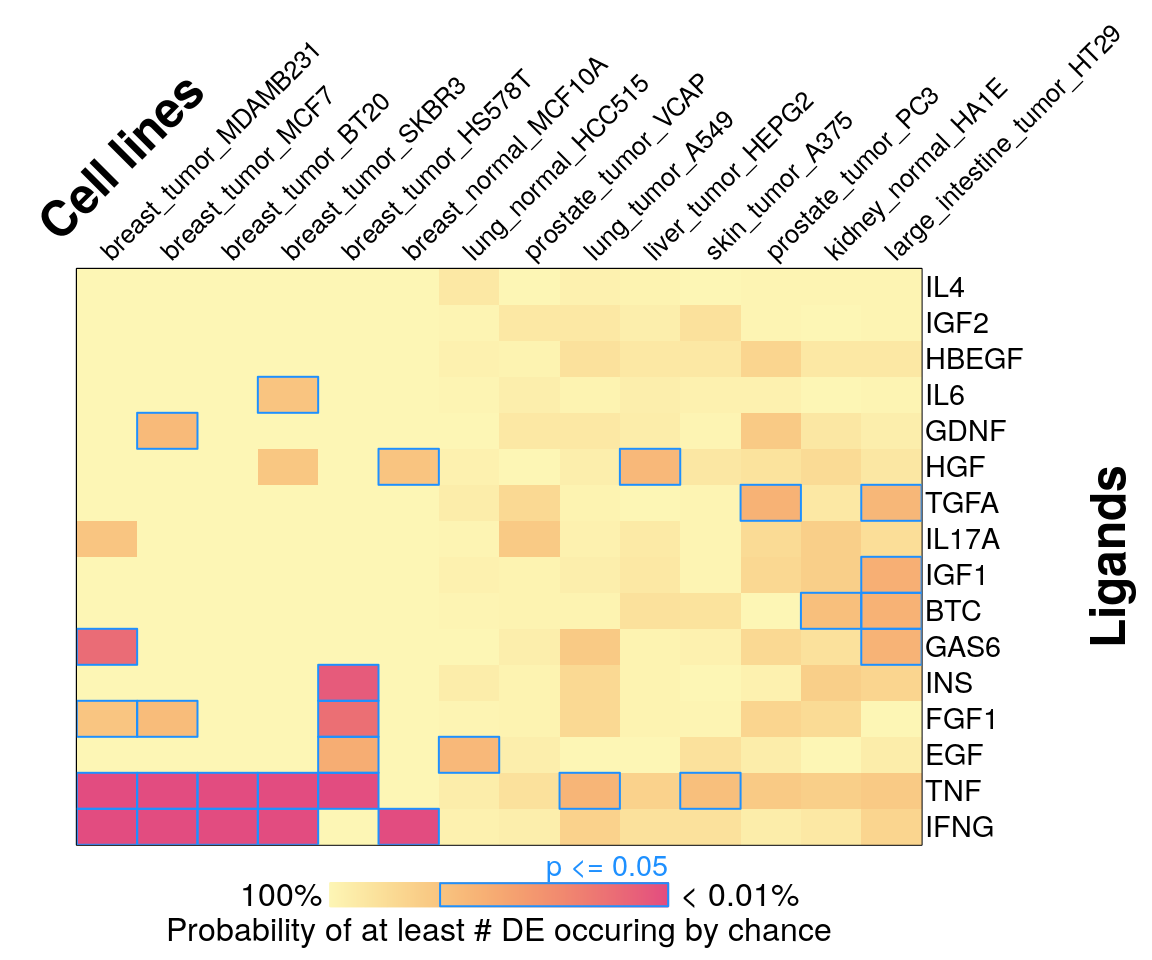
Averaging per cell line
16 ligands, ‘landmark’ genes only
## Error in DE_heatmap(meanZ_ct, FDR_ct, pDE_ct, "Cell lines", aCut = 0.1) :
##   Less than two samples reached FDR threshold of 10%
295 ligands, ‘landmark’ genes only
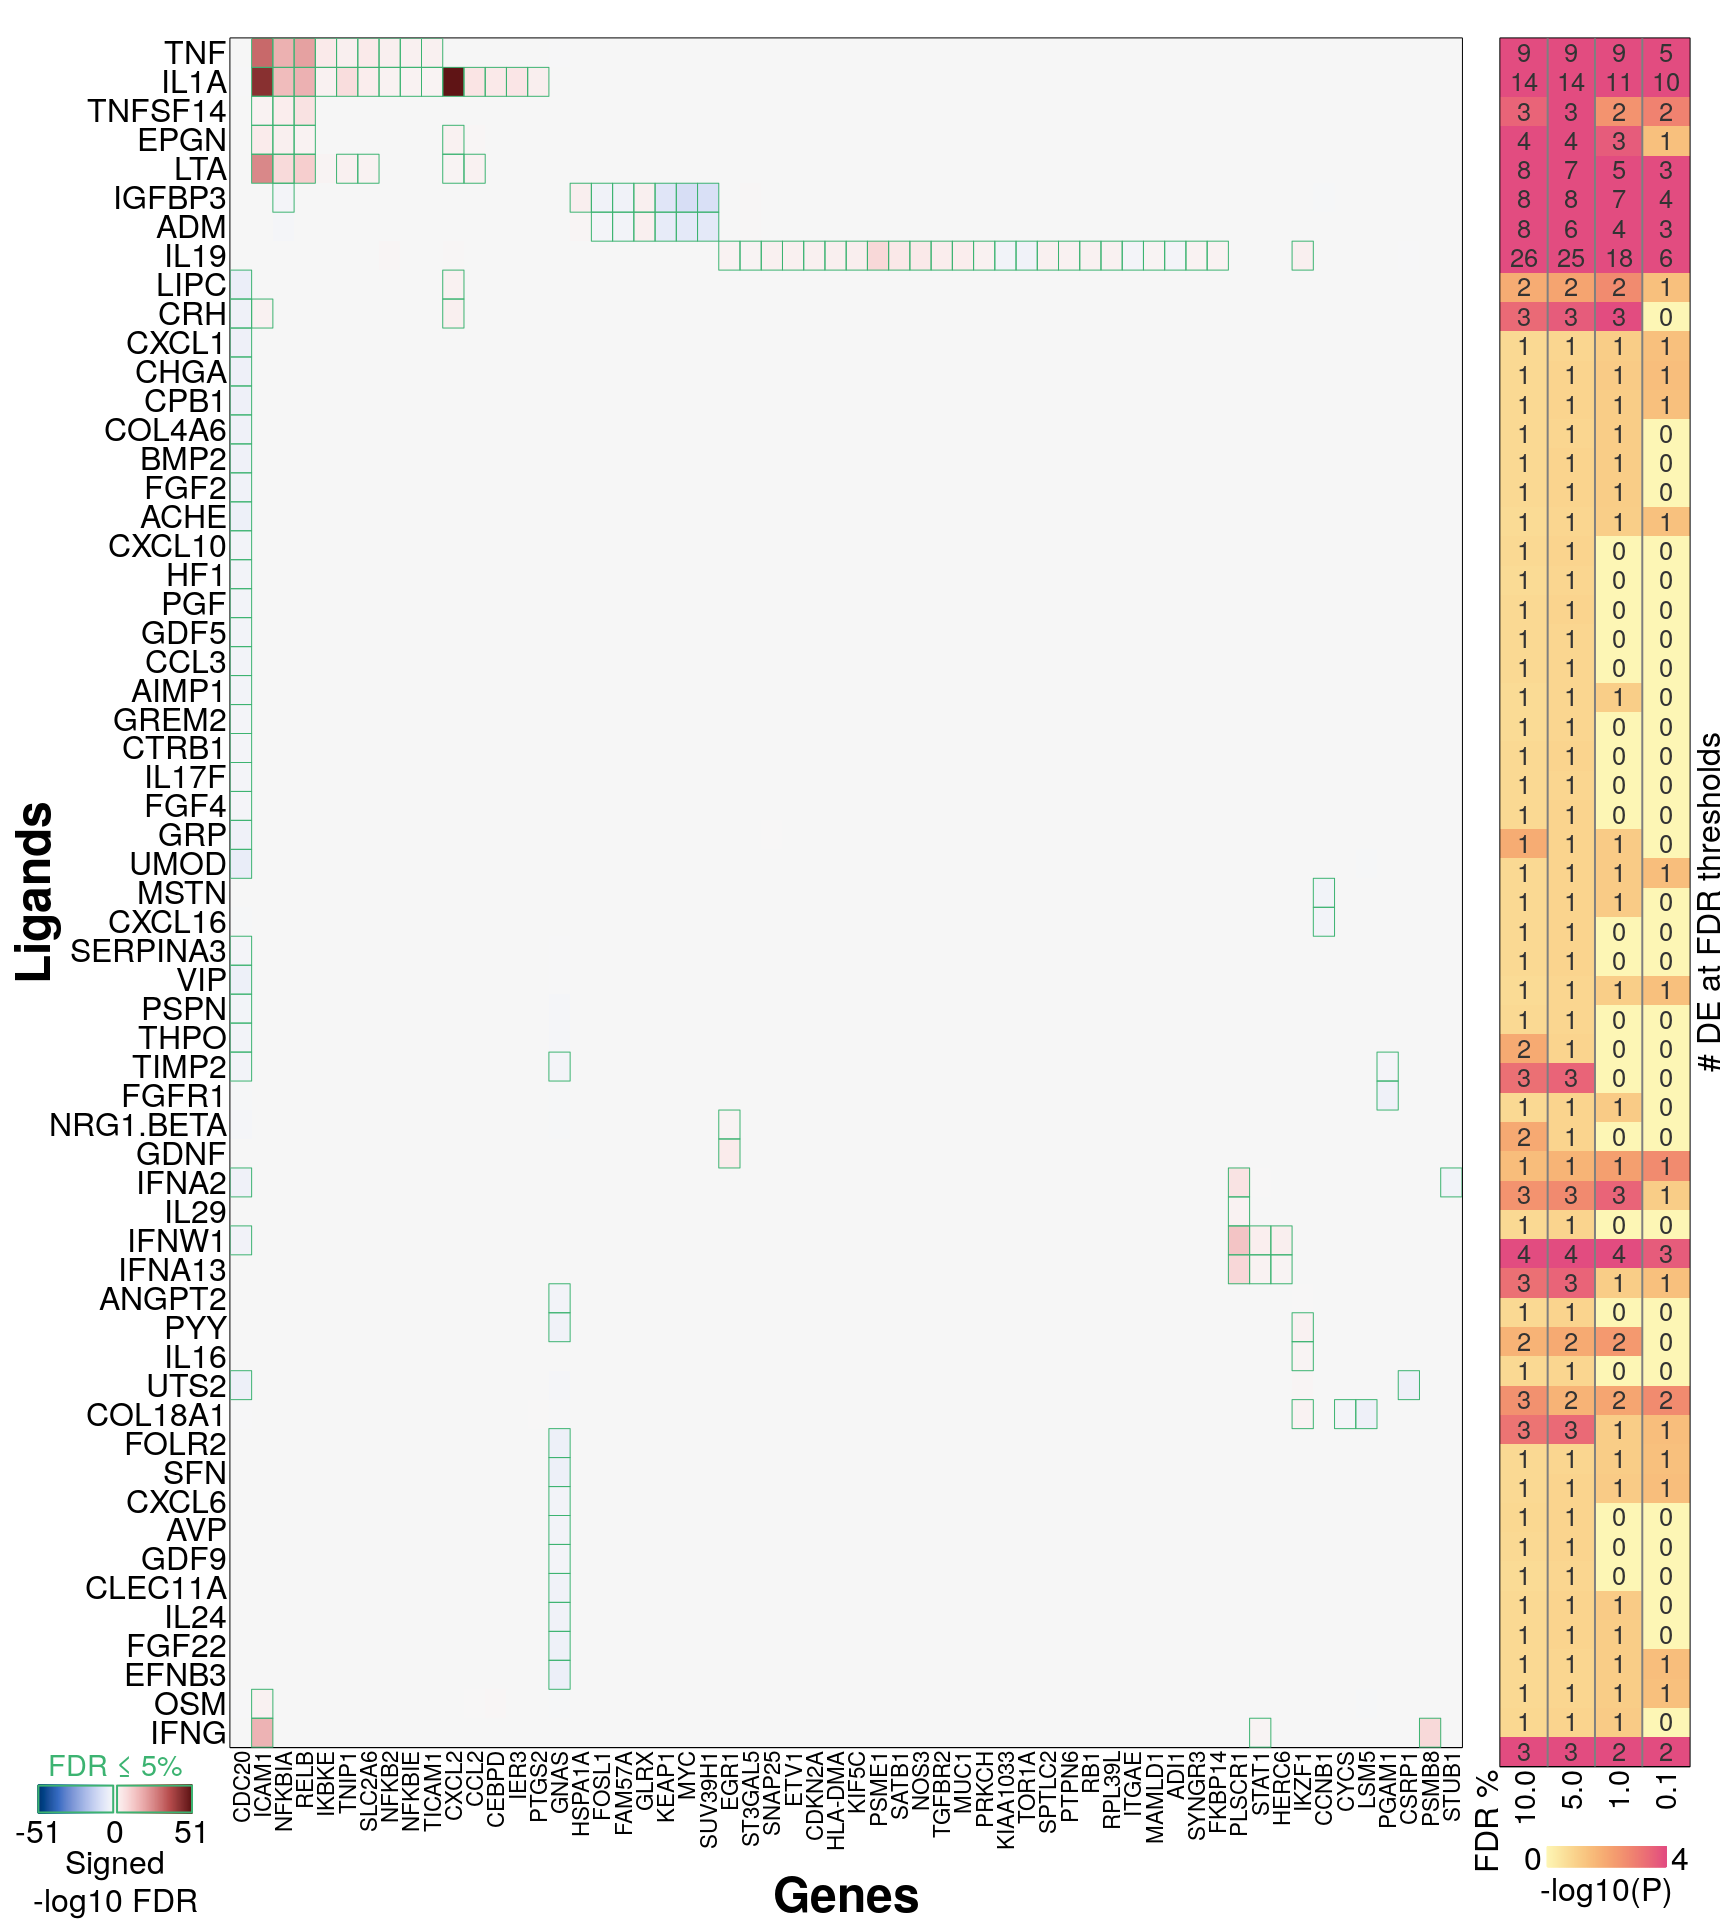
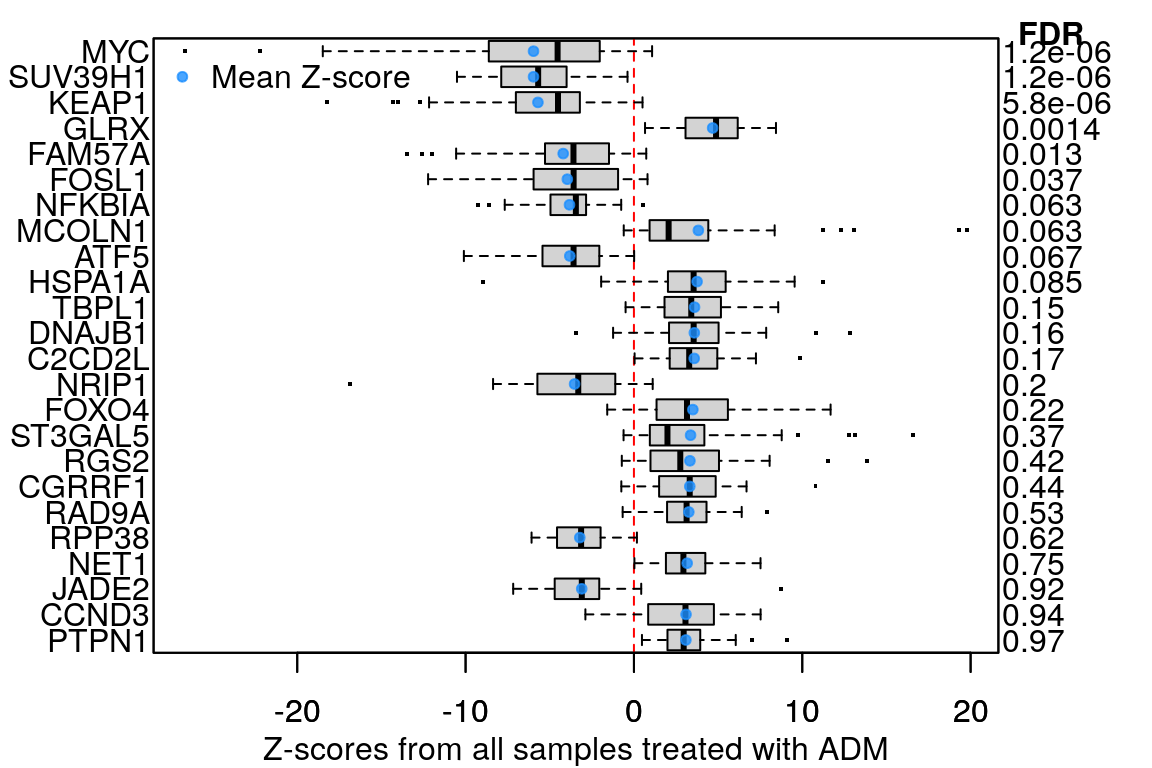
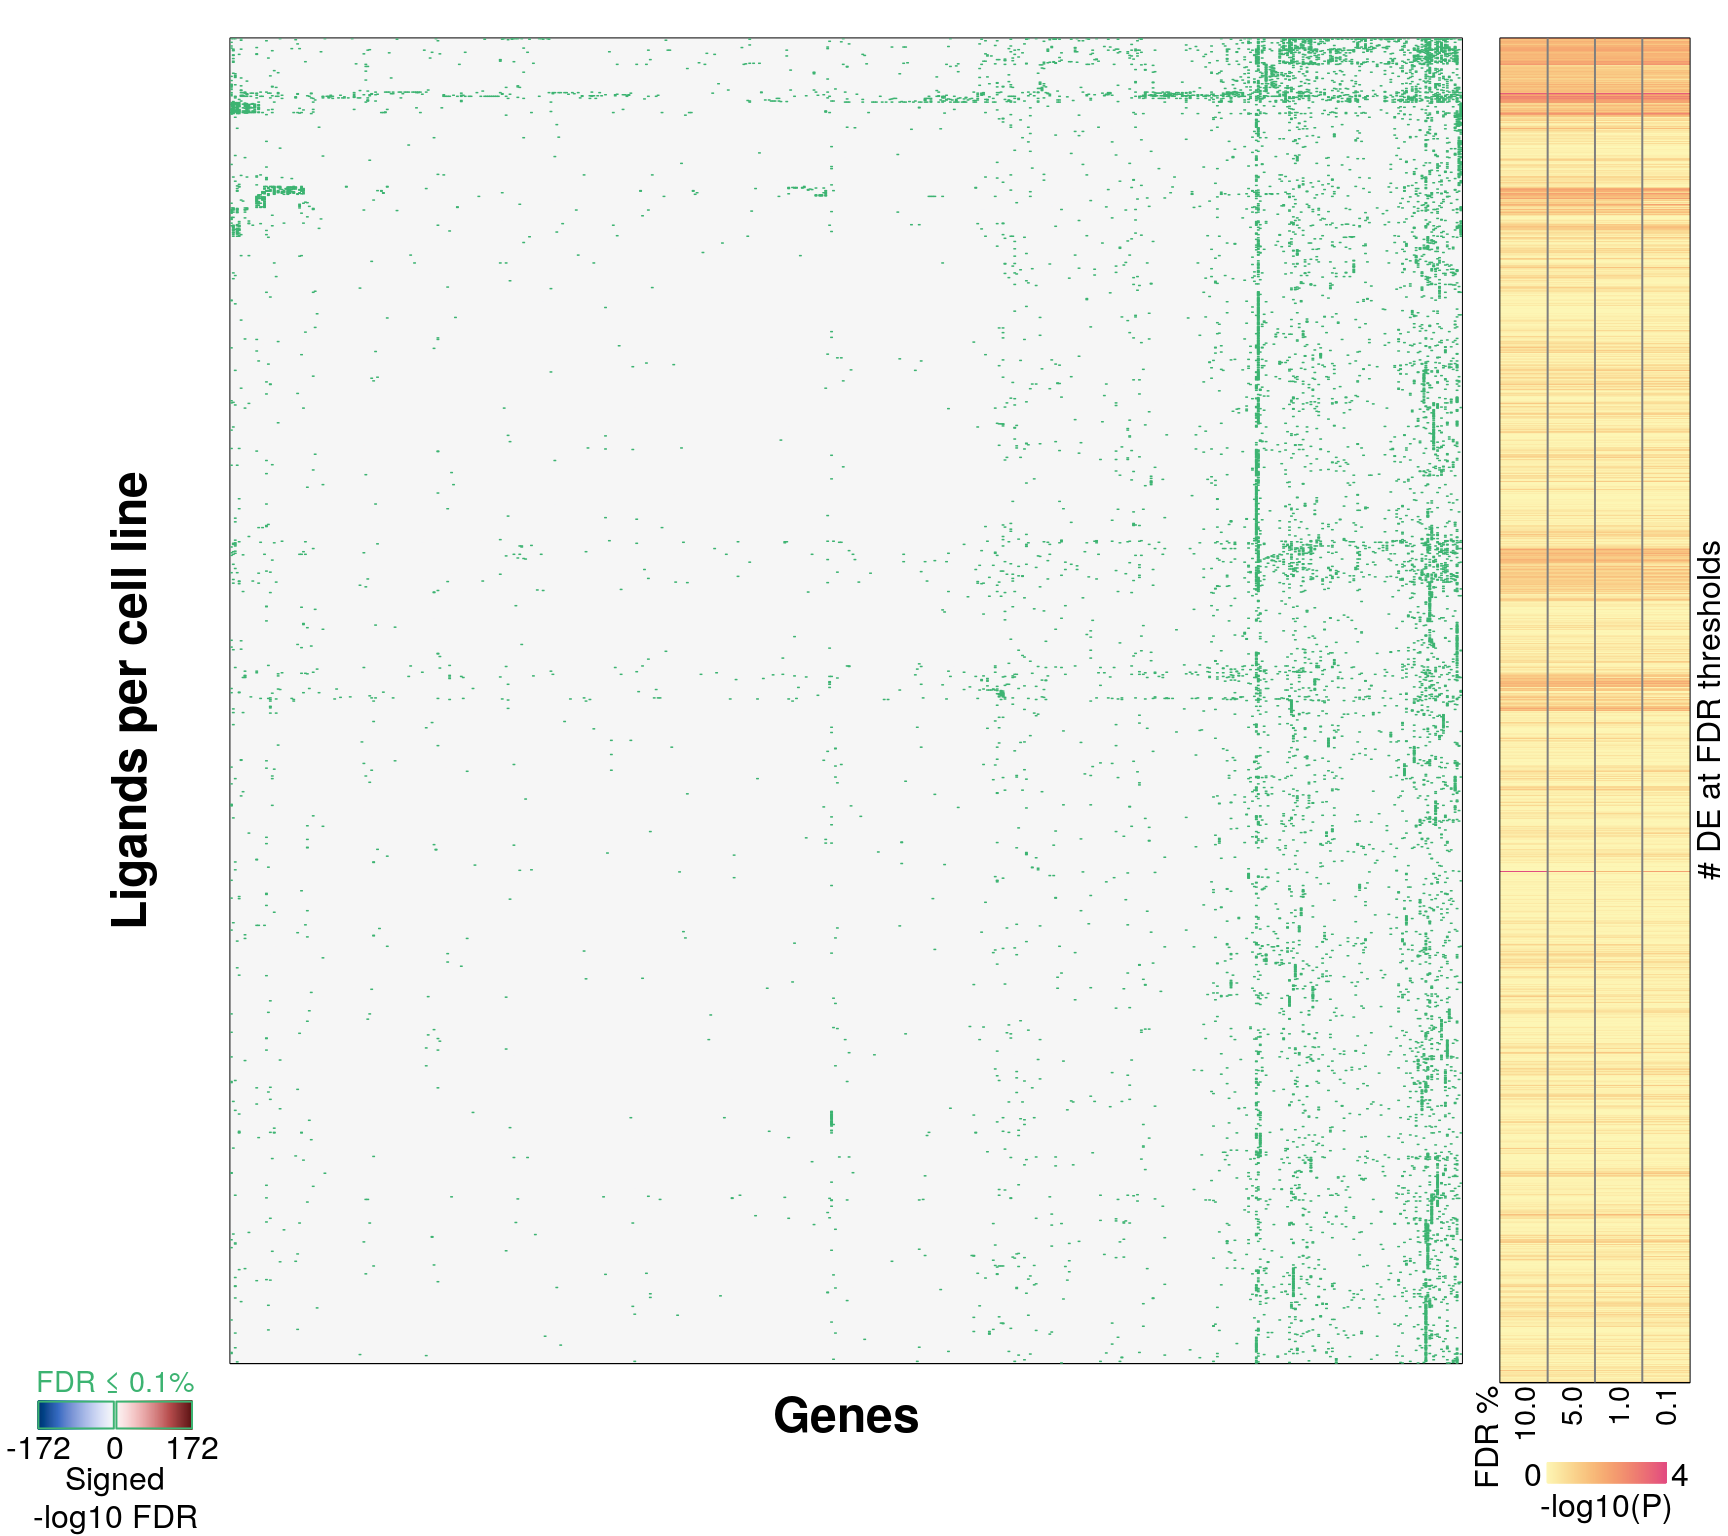
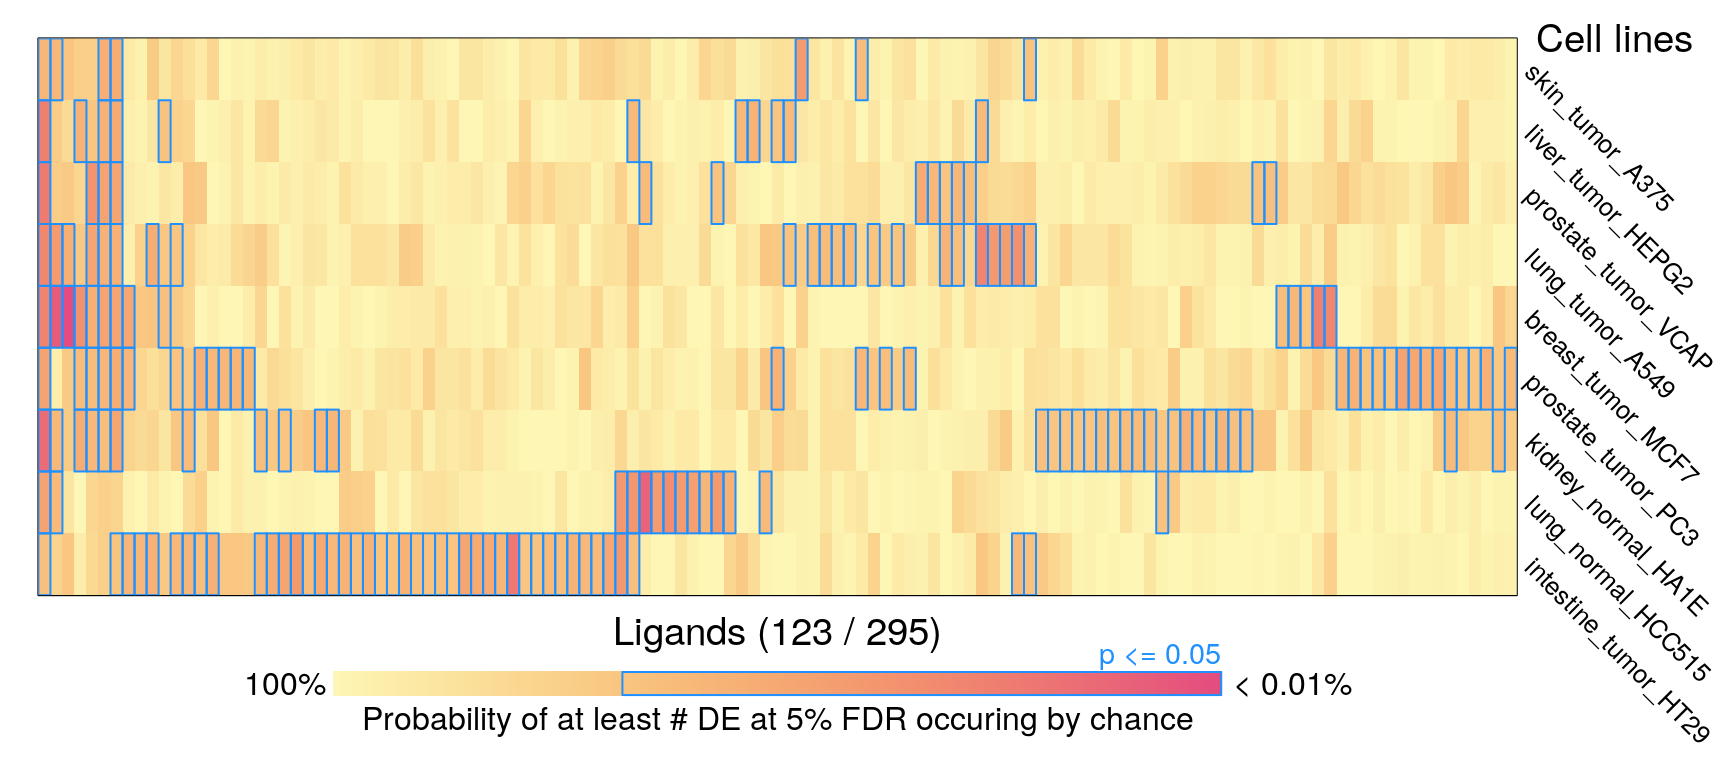
Averaging within each ligand per cell line
16 ligands, ‘landmark’ genes only
295 ligands, ‘landmark’ genes only
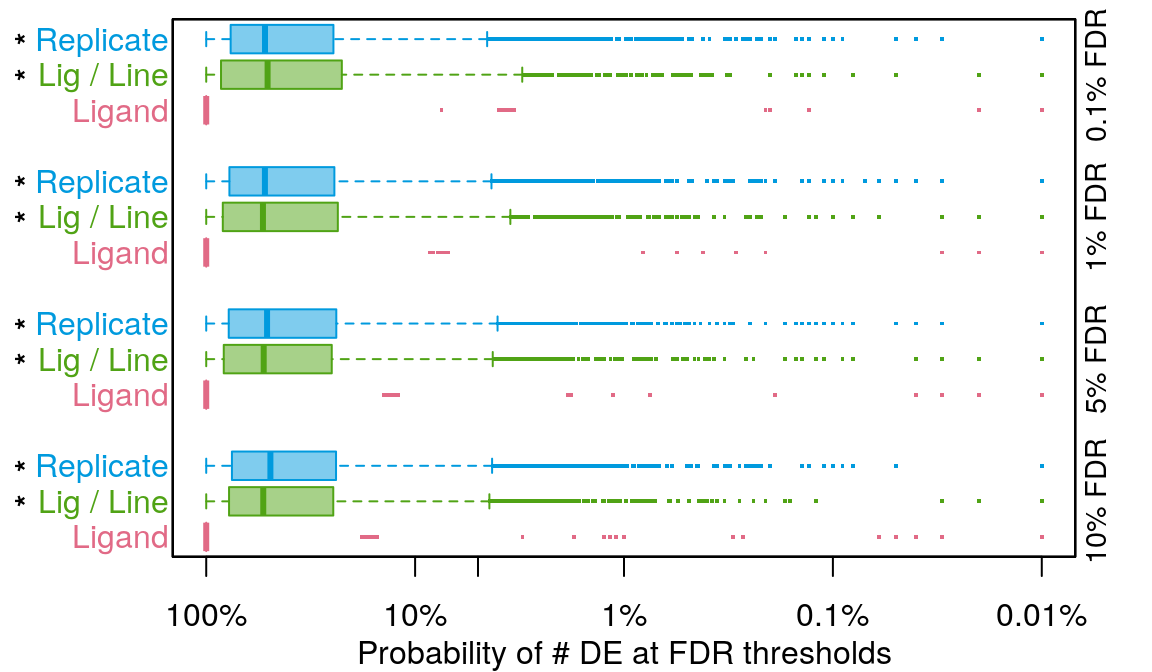
Comparing DE count distributions
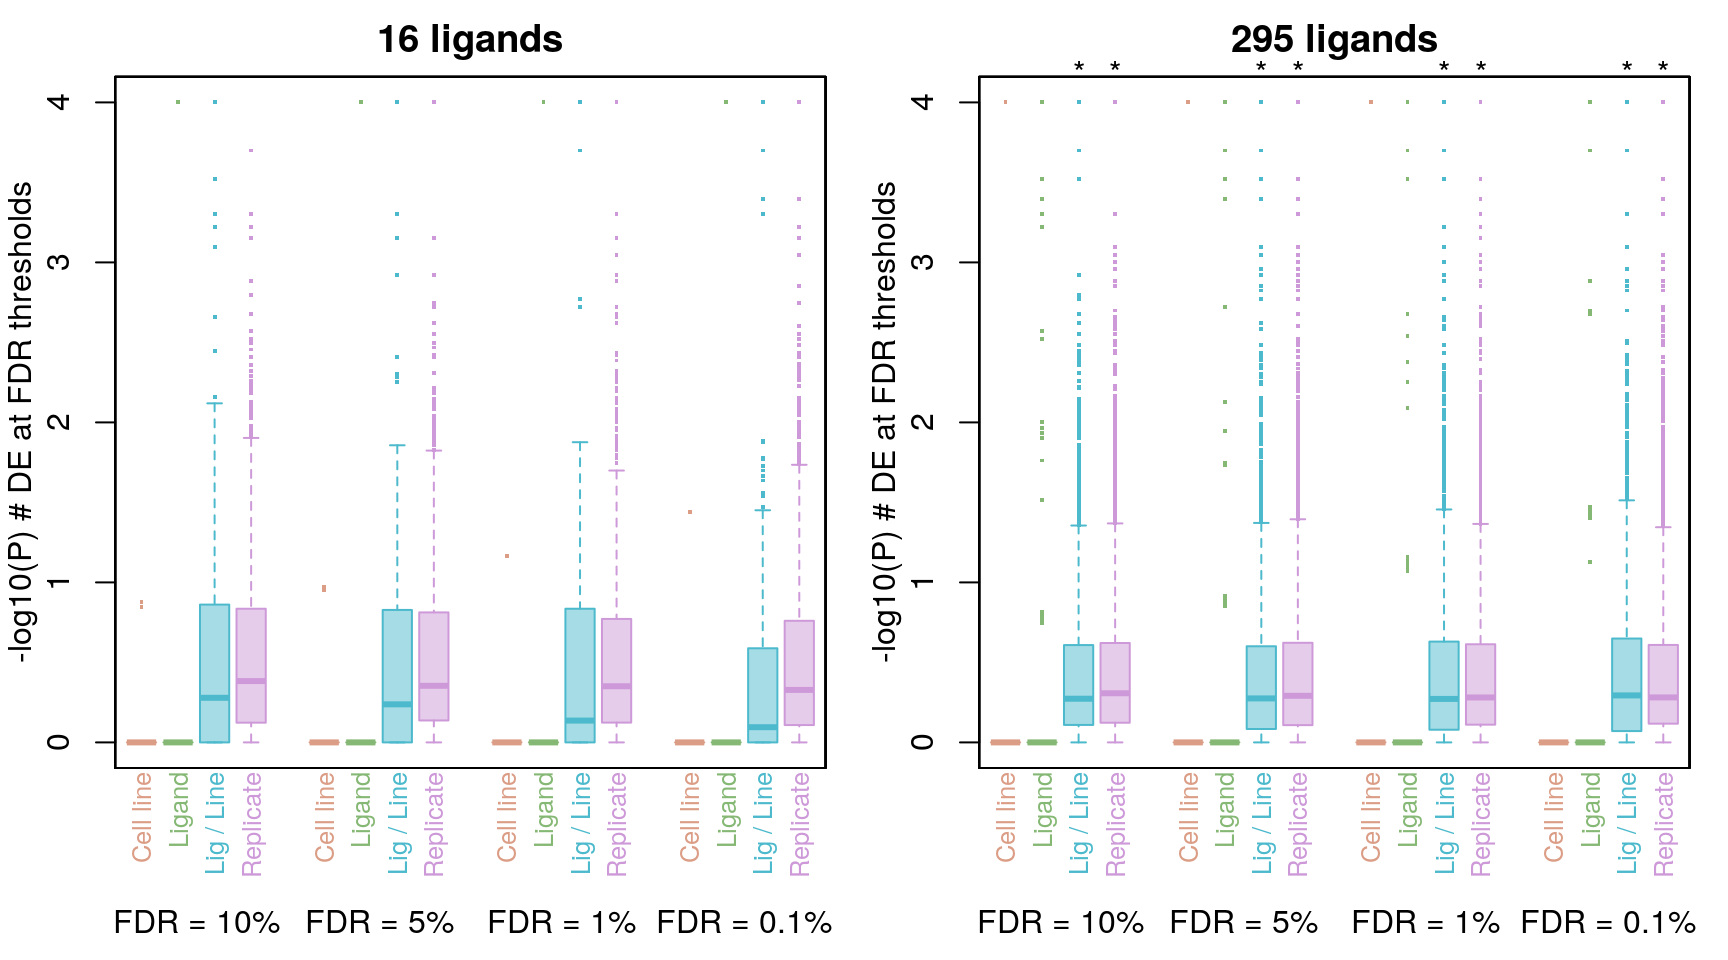
The * denotes p < 2.2e-16 from the Wilcoxon rank-sum test comparing to averaging by ligand.