Supp Fig 1: Connectivity Map ligand assay data summary
Quantile-normalized transcriptomes from control and ligand-treated cell lines (level 3 data)
Ligands / cell lines assayed
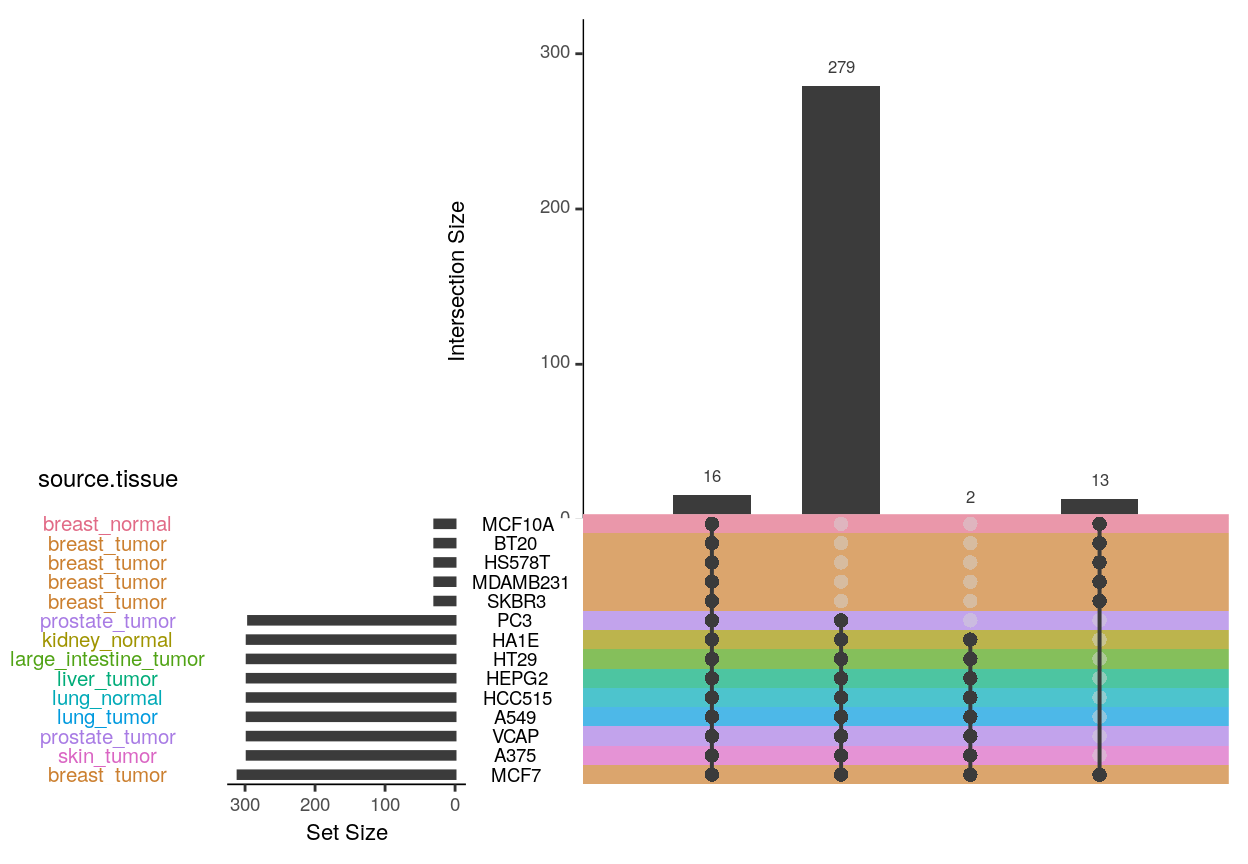
In the Connectivity Map data, there are 16 ligands assayed in all 14 cell lines, and 300 ligands assayed in 8 cell lines.
| EGF | HGF | INS | IGF2 | TGFA | IGF1 | FGF1 | HBEGF | IL6 | IL4 | IFNG | BTC | GDNF | GAS6 | TNF | IL17A | ctrl | min.ctrl.ratio | |
|---|---|---|---|---|---|---|---|---|---|---|---|---|---|---|---|---|---|---|
| breast_normal_MCF10A | 119 | 62 | 62 | 62 | 62 | 62 | 59 | 61 | 60 | 59 | 60 | 60 | 61 | 60 | 62 | 60 | 196 | 0.6071429 |
| breast_tumor_BT20 | 146 | 74 | 74 | 73 | 74 | 74 | 74 | 74 | 73 | 74 | 73 | 74 | 74 | 69 | 74 | 74 | 273 | 0.5347985 |
| breast_tumor_HS578T | 120 | 58 | 59 | 60 | 60 | 60 | 60 | 60 | 60 | 59 | 58 | 57 | 58 | 59 | 55 | 60 | 232 | 0.5172414 |
| breast_tumor_MCF7 | 153 | 83 | 80 | 80 | 80 | 80 | 80 | 80 | 78 | 78 | 78 | 80 | 79 | 76 | 75 | 75 | 4389 | 0.0348599 |
| breast_tumor_MDAMB231 | 120 | 58 | 60 | 60 | 60 | 60 | 60 | 60 | 60 | 60 | 59 | 58 | 59 | 59 | 56 | 60 | 251 | 0.4780876 |
| breast_tumor_SKBR3 | 123 | 57 | 62 | 62 | 62 | 62 | 62 | 62 | 62 | 62 | 61 | 60 | 58 | 62 | 57 | 62 | 265 | 0.4641509 |
| kidney_normal_HA1E | 5 | 10 | 5 | 5 | 5 | 5 | 5 | 5 | 5 | 5 | 5 | 5 | 5 | 5 | 5 | 3 | 1135 | 0.0088106 |
| large_intestine_tumor_HT29 | 5 | 10 | 5 | 5 | 4 | 4 | 5 | 4 | 5 | 4 | 5 | 4 | 4 | 4 | 5 | 3 | 2059 | 0.0048567 |
| liver_tumor_HEPG2 | 6 | 12 | 6 | 6 | 6 | 6 | 6 | 6 | 6 | 6 | 6 | 6 | 5 | 6 | 6 | 3 | 780 | 0.0153846 |
| lung_normal_HCC515 | 5 | 10 | 5 | 5 | 5 | 5 | 5 | 5 | 5 | 5 | 5 | 5 | 5 | 5 | 5 | 3 | 957 | 0.0104493 |
| lung_tumor_A549 | 6 | 12 | 6 | 6 | 6 | 6 | 6 | 5 | 6 | 5 | 6 | 6 | 6 | 6 | 6 | 3 | 2847 | 0.0042150 |
| prostate_tumor_PC3 | 5 | 7 | 5 | 5 | 4 | 4 | 5 | 5 | 4 | 5 | 5 | 5 | 3 | 4 | 5 | 5 | 4060 | 0.0017241 |
| prostate_tumor_VCAP | 6 | 12 | 6 | 6 | 6 | 6 | 6 | 6 | 6 | 6 | 6 | 6 | 6 | 6 | 6 | 4 | 5071 | 0.0023664 |
| skin_tumor_A375 | 5 | 10 | 5 | 5 | 5 | 5 | 5 | 5 | 5 | 5 | 5 | 5 | 5 | 5 | 5 | 3 | 2264 | 0.0044170 |
| Totals | 824 | 475 | 440 | 440 | 439 | 439 | 438 | 438 | 435 | 433 | 432 | 431 | 428 | 426 | 422 | 418 | 24779 | 0.0332540 |
In a subset of cell lines, ligands were tested over a variety of doses and times (and EGF was especially rigorously assayed), while in most cell lines ligands were tested at a single concentration over two time points. Note that the number of control samples per cell type is much greater than the number of treatments.