Module 6 lab 3: scRNA ScNetViz
This work is licensed under a Creative Commons Attribution-ShareAlike 3.0 Unported License. This means that you are able to copy, share and modify the work, as long as the result is distributed under the same license.
By Veronique Voisin, Chaitra Sarathy and Ruth Isserlin
Introduction
scNetViz is a Cytoscape app designed to perform downstream analysis of single cell RNAseq (scRNA) data. The goal is to explore the results of a single cell RNAseq experiment in the context of the pathways involved and in network analysis framework.
It is assumed that the data was already been preprocessed, for example using the Seurat or similiar pipeline. Ideally the experimental results have been published and deposited into a public repository. Biologists with no or little computational background can now load the dataset of their choice into Cytoscape.
Each dataset is loaded with metadata indicating, for example different groups to which the cells belong, ie. control or treated groups or specific clusters that the upstream data analysis revealed. The idea is to select groups or clusters of interest and perform differential expression analysis.
Plots visualizing the results of the differential expression analysis are created by the scNetViz app including heatmaps and violin plots.
The app takes the top n differentially expressed genes and creates a network representing them. One of the best features of this app is that at this point it can take advantage of all the features in Cytoscape and facilitate the integration of other omics data.
We can perform pathway enrichment analysis on the created network (the top genes) enabling the identification of functions associated with the top differentially expressed genes.
The app takes as input scRNA data stored in the Single Cell Expression Atlas repository hosted by EMBL’s European Bioinformatics Institute (https://www.ebi.ac.uk/gxa/sc/home). This repository contains scRNA experiments from Animals, Plants, Fungi and Protists. It features experiments from the Human Cell Atlas, the Fly Cell Atlas, the Chan Zuckerberg Biohub and more.

Goal of the practical lab
In this example, we will browse the Single Cell Expression Atlas from within Cytoscape, explore a particular dataset, perform differential expression analysis based on one of the provided cell annotations categories, generate networks from the top differentially expressed genes for each group within the chosen category, and functionally characterize and visualize the networks.
Data
- ACCESSION NUMBER: E-MTAB-7417
- TISSUE: Cells from a digested skin sample were taken from two 8-week old female C57BL/6 mice
- INSTRUMENT(S): Illumina HiSeq 4000
- ORGANISM(S): Mus Musculus
- DISEASE(S): Normal
- DATA PROCESSING: Droplet-based sequencing data was aligned, filtered and quantified using the Cell Ranger Single-Cell Software Suite (version 22.2.0), against the mouse reference genome provided by Cell Ranger.
scNetViz accesses the data directly from the Single Cell Expression
Atlas repository, therefore it is not necessary to download the data for
the practical lab.
However, if you would like to work on data offline, there is an option to import the data manually into scNetViz:
- In Cytoscape menu bar select Apps -> scNetViz -> Load Experiment -> Import from File.
It can also be useful if you already have your data of interest
downloaded on your computer.
Instructions below show you how to
download the data directly from the repository but you are not required
to pull your data from there.
- DATA AVAILABLE AT: https://www.ebi.ac.uk/gxa/sc/experiments/E-MTAB-7417/downloads:
- Scroll down to Result files and download Normalized counts files (MatrixMarket archive).
- A folder called E-GEOD-109979-normalised-files.zip is now downloaded onto your computer.
- Note 1: values in the file are normalized to counts per million.
- Note 2: do not unzip the file to upload it into scNetViz
- Download the cluster information as well: E-MTAB-7417.clusters.tsv
- Note: The cells were clustered using the Louvain algorithm.
- Reference paper: Davidson S, Efremova M, Riedel A, Mahata B, Pramanik J et al. (2018) Single-cell RNA sequencing reveals a dynamic stromal niche within the evolving tumour microenvironment [https://pubmed.ncbi.nlm.nih.gov/32433953/].
- This paper discusses melanoma using a mouse model. The scRNA are samples from the skin of 2 healthy mice. Only the clusters identified as fibroblasts (based on expression of Col1a1, Col1a2) were considered for comparison with the stromal clusters.
Right click on link below and select “Save Link As…”.
Place it in the corresponding module directory of your CBW work directory.
There is no need to download this data as you can download it directly from the scNetViz app.
Steps
- Open Cytoscape
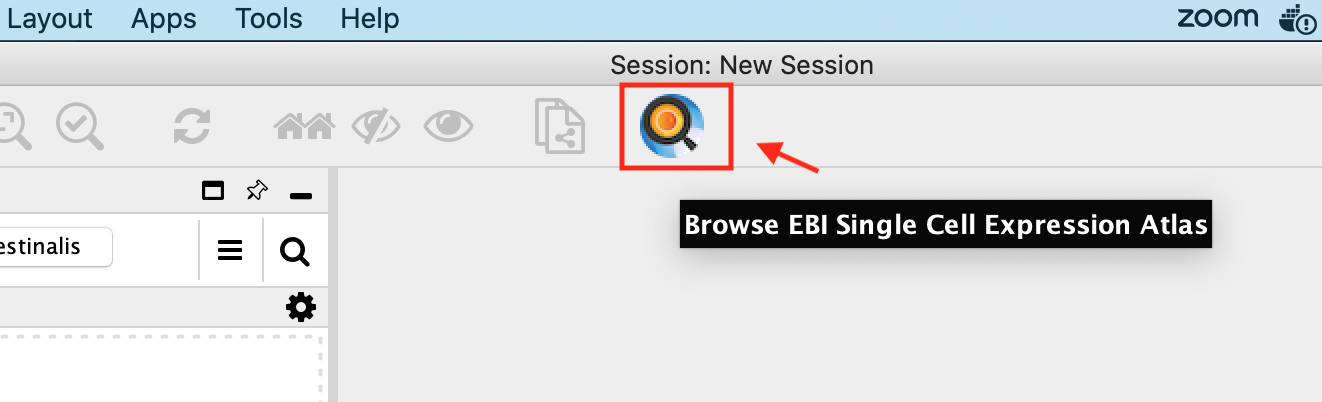
- Click the icon Browse EBI Single Cell Expression Atlas in the Cytoscape toolbar. This opens the Single Cell Experiment Atlas browser.
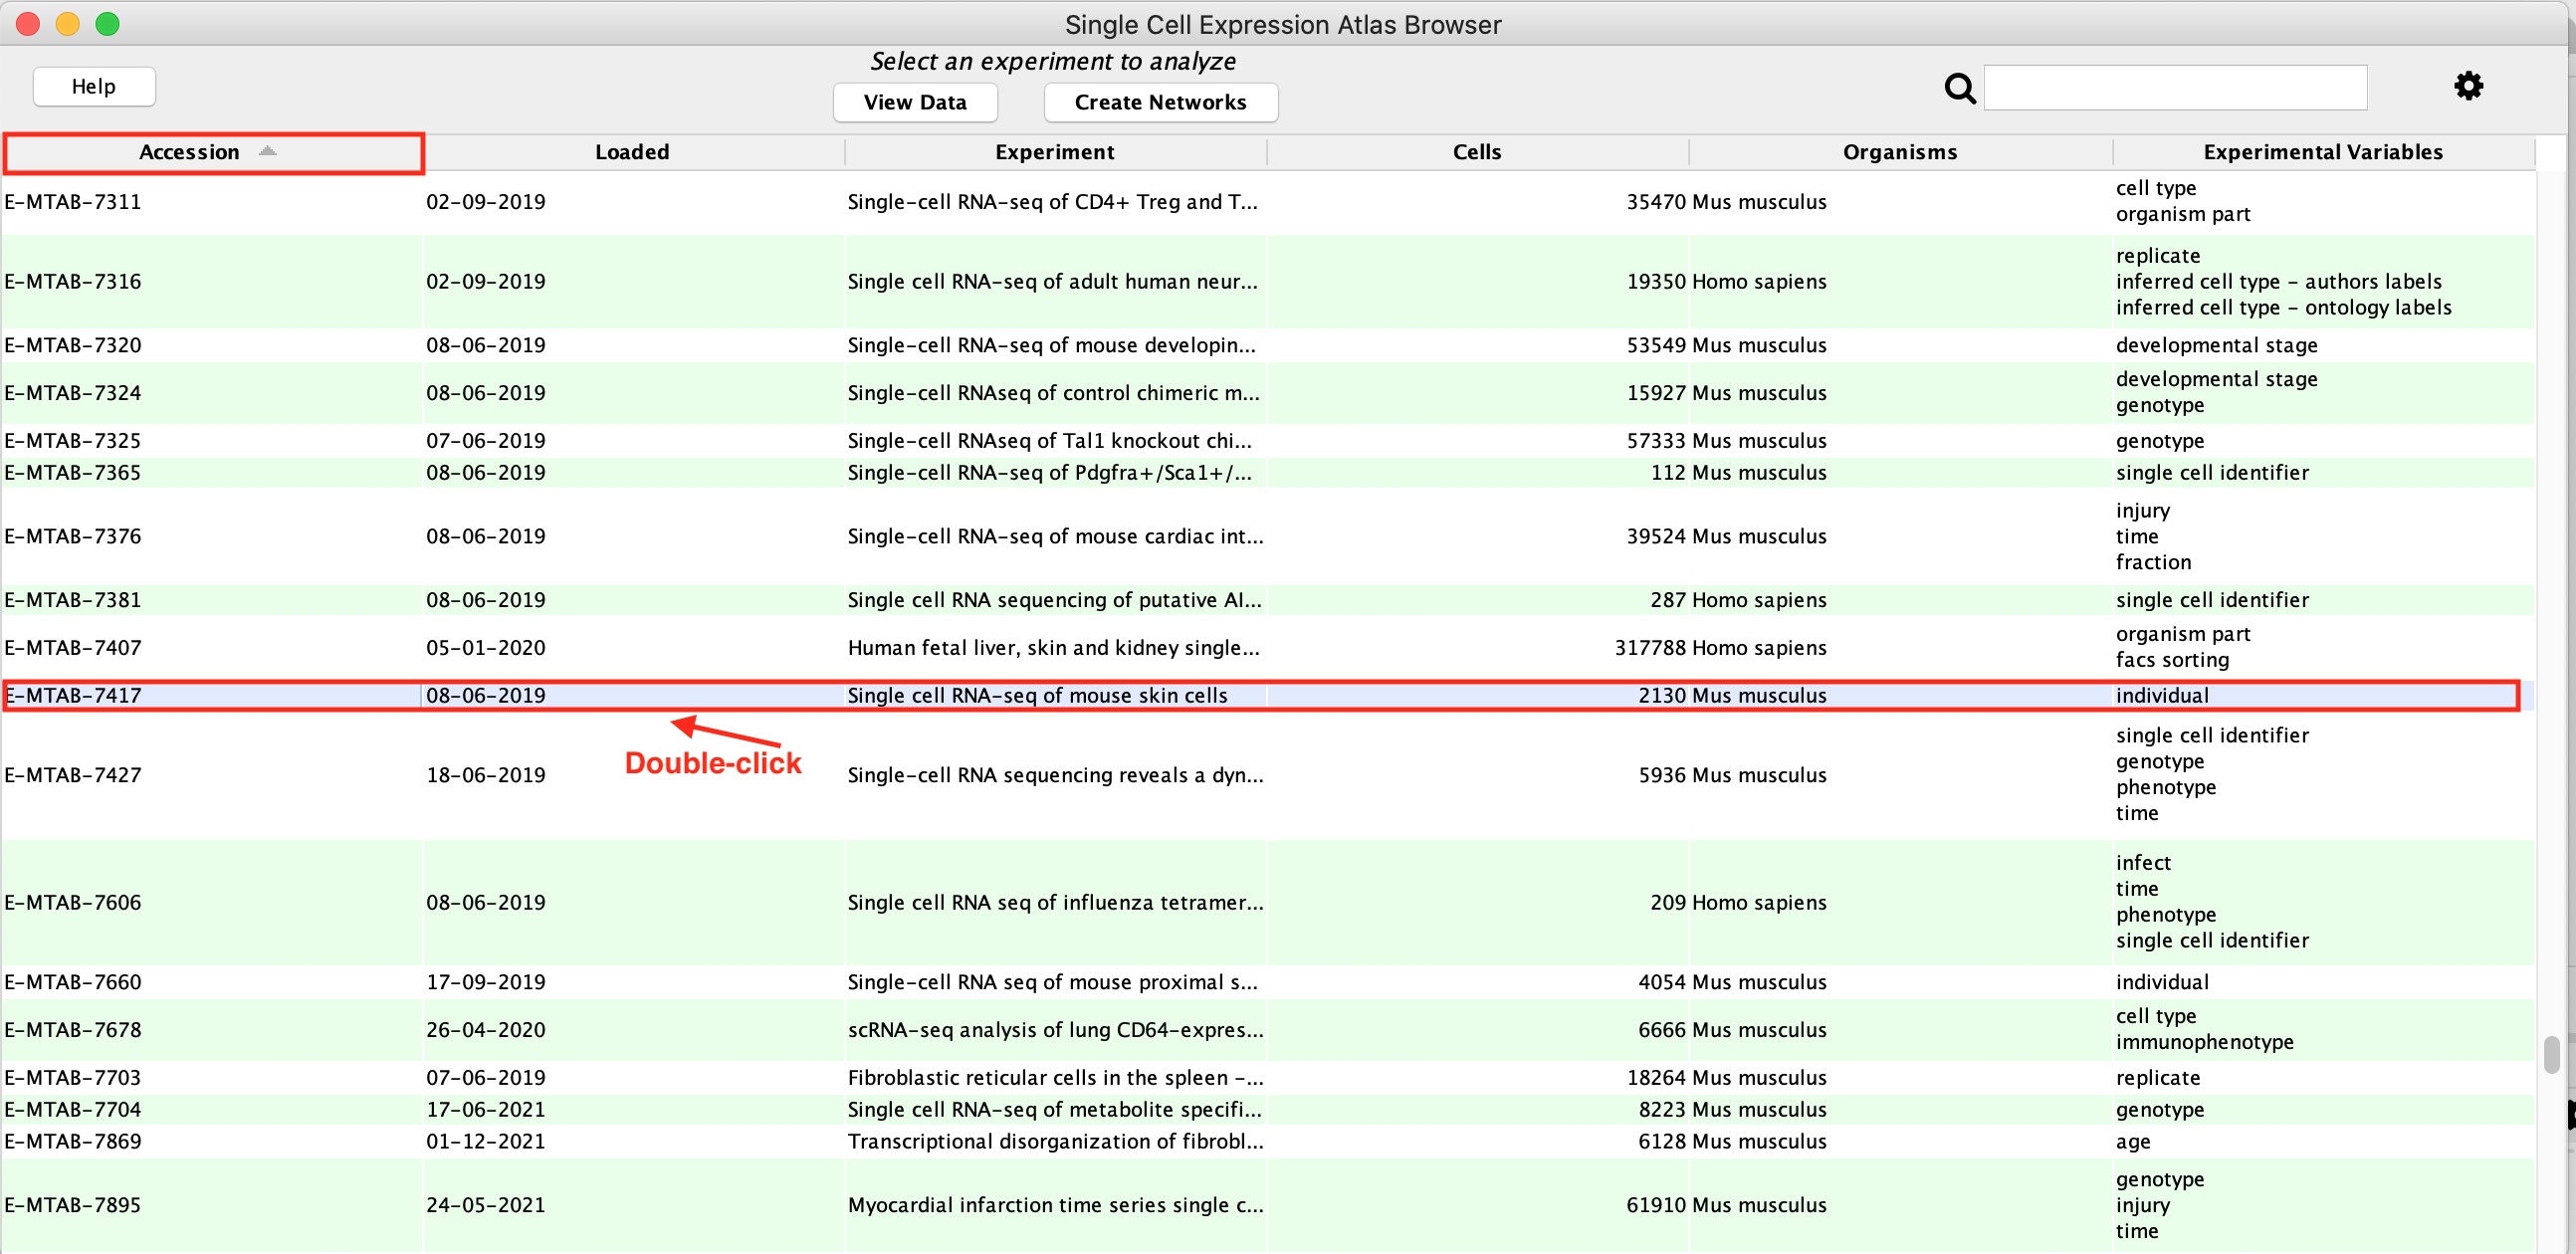
- Click the column header labelled Accession and search for E-MTAB-7417 in the resulting table sorted by accession numbers.
- Select the row with the accession number E-MTAB-7417 by double clicking on it.
- An experiment table with 3 tabs will open, select the first tab called TPM.
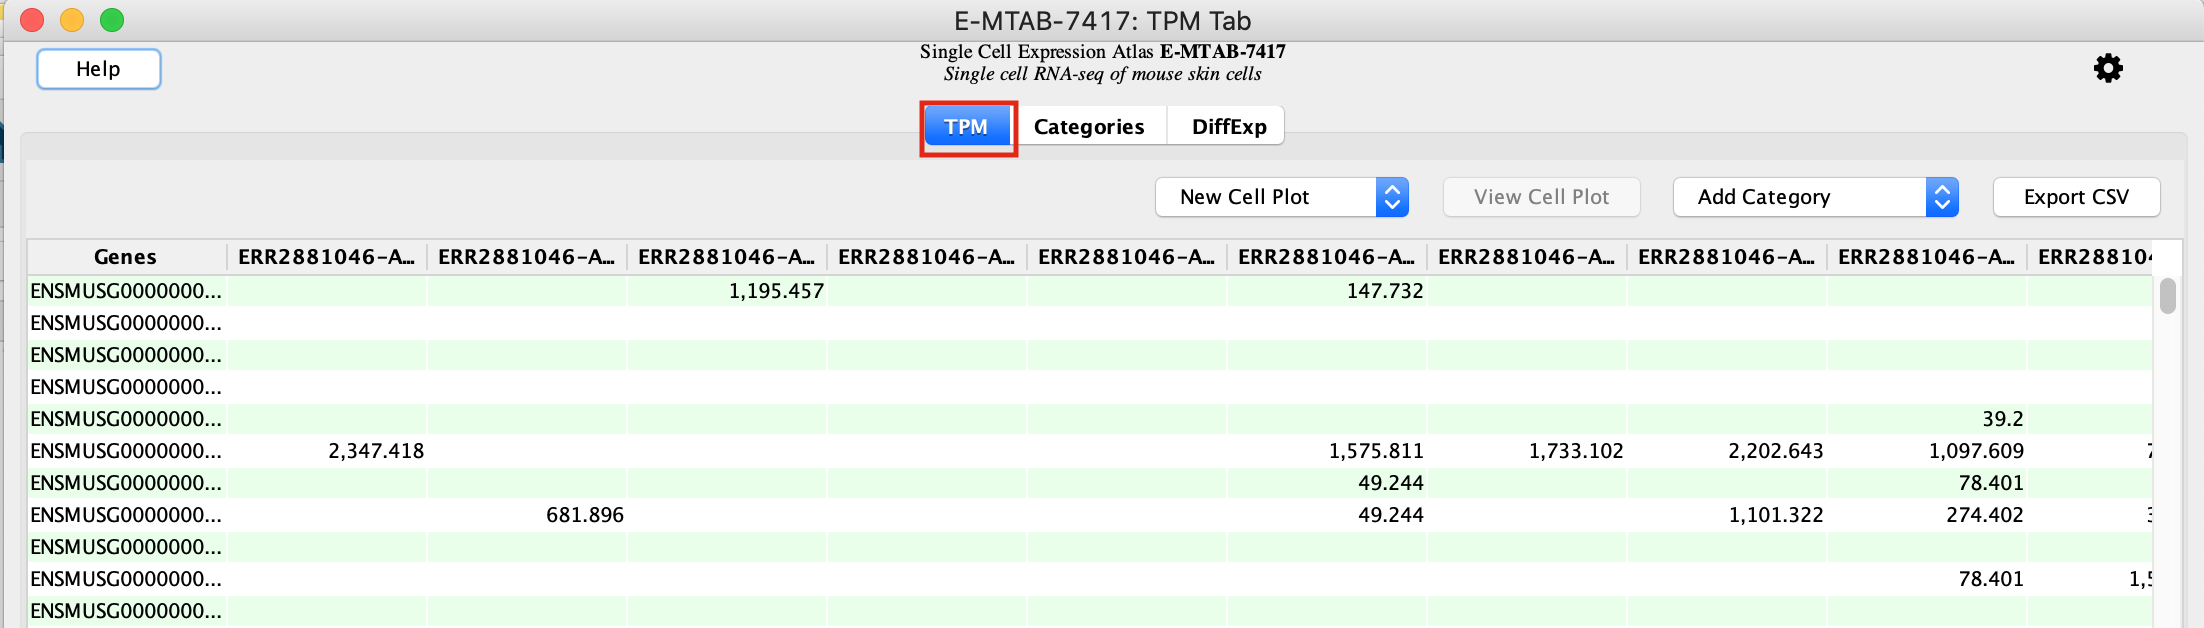
This tab contains the genes as rows and the individual cells as columns. Each cell of the table represents the normalized counts for a given gene and cell.
The table has many blank spaces. Single cell RNASeq matrices are sparse because not all genes are detected in all cells.
- Select the second tab called Categories.
- Make sure that Cluster is selected in the Available categories field.
The clustering has been computed by the Single Cell Experiment Atlas.
The Louvain algorithm has been run with several resolution values.
Higher resolutions produces a larger number of clusters and lower
resolution produces a lower number of clusters.
A resolution of 1 is
selected by default by the scNetViz app. It corresponds to the default
Louvain method. It is indicated by “True” in the column sel.K.
In
this example, the clustering with parameter K=20 is chosen for further
analysis. The other columns indicate the cluster membership of each
cell.
<p align="center">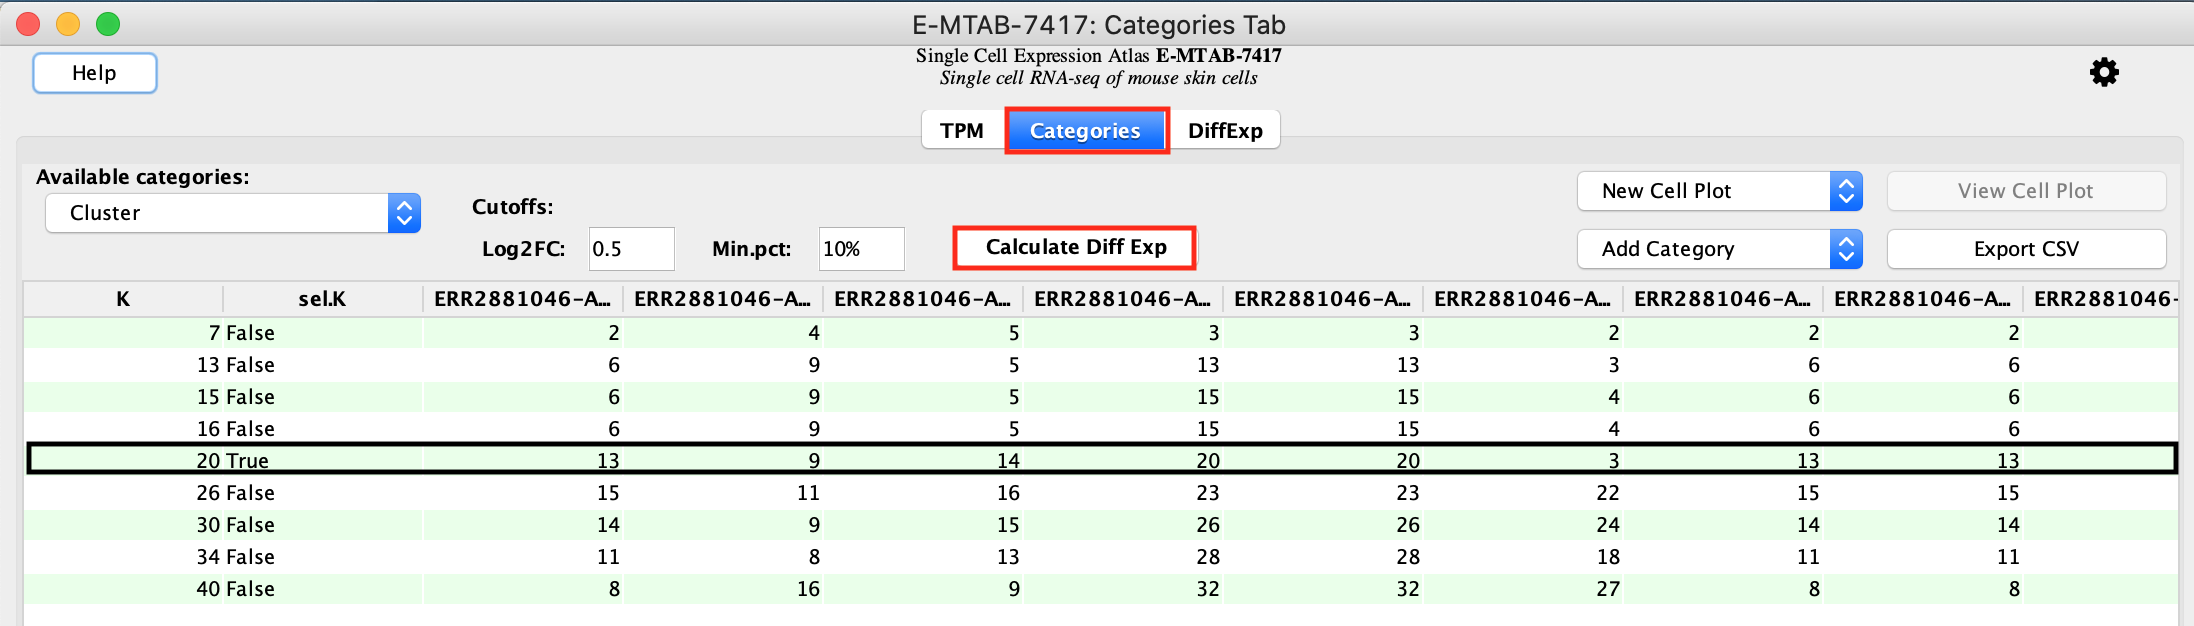
Calculate differential expression
- Calculate differential expression:
- To get the table of differentially expressed genes press the button labeled Calculate Diff Exp. This initiates a comparison of each cluster versus all other clusters. There are a total of 20 clusters and we will obtain results for each of them in the same table.
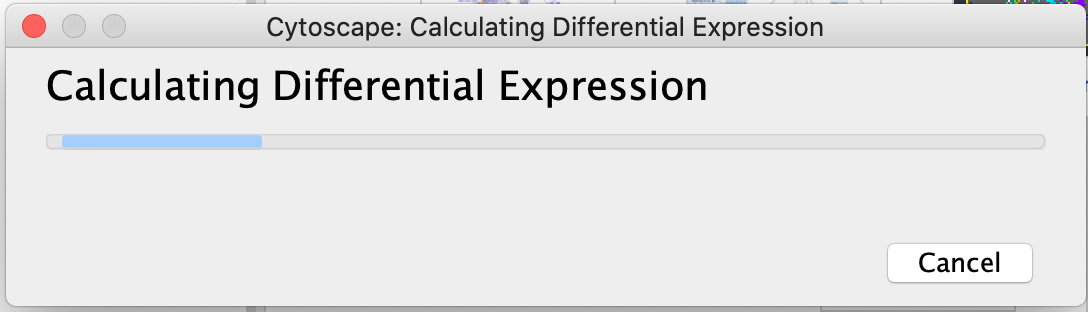
- Differential gene expression is calculated using a Wilcoxon rank sum test. The log2(fold change) represents the log ratio of the mean expression of a gene in the cells of the selected cluster versus the mean expression of that gene in all the other cells.
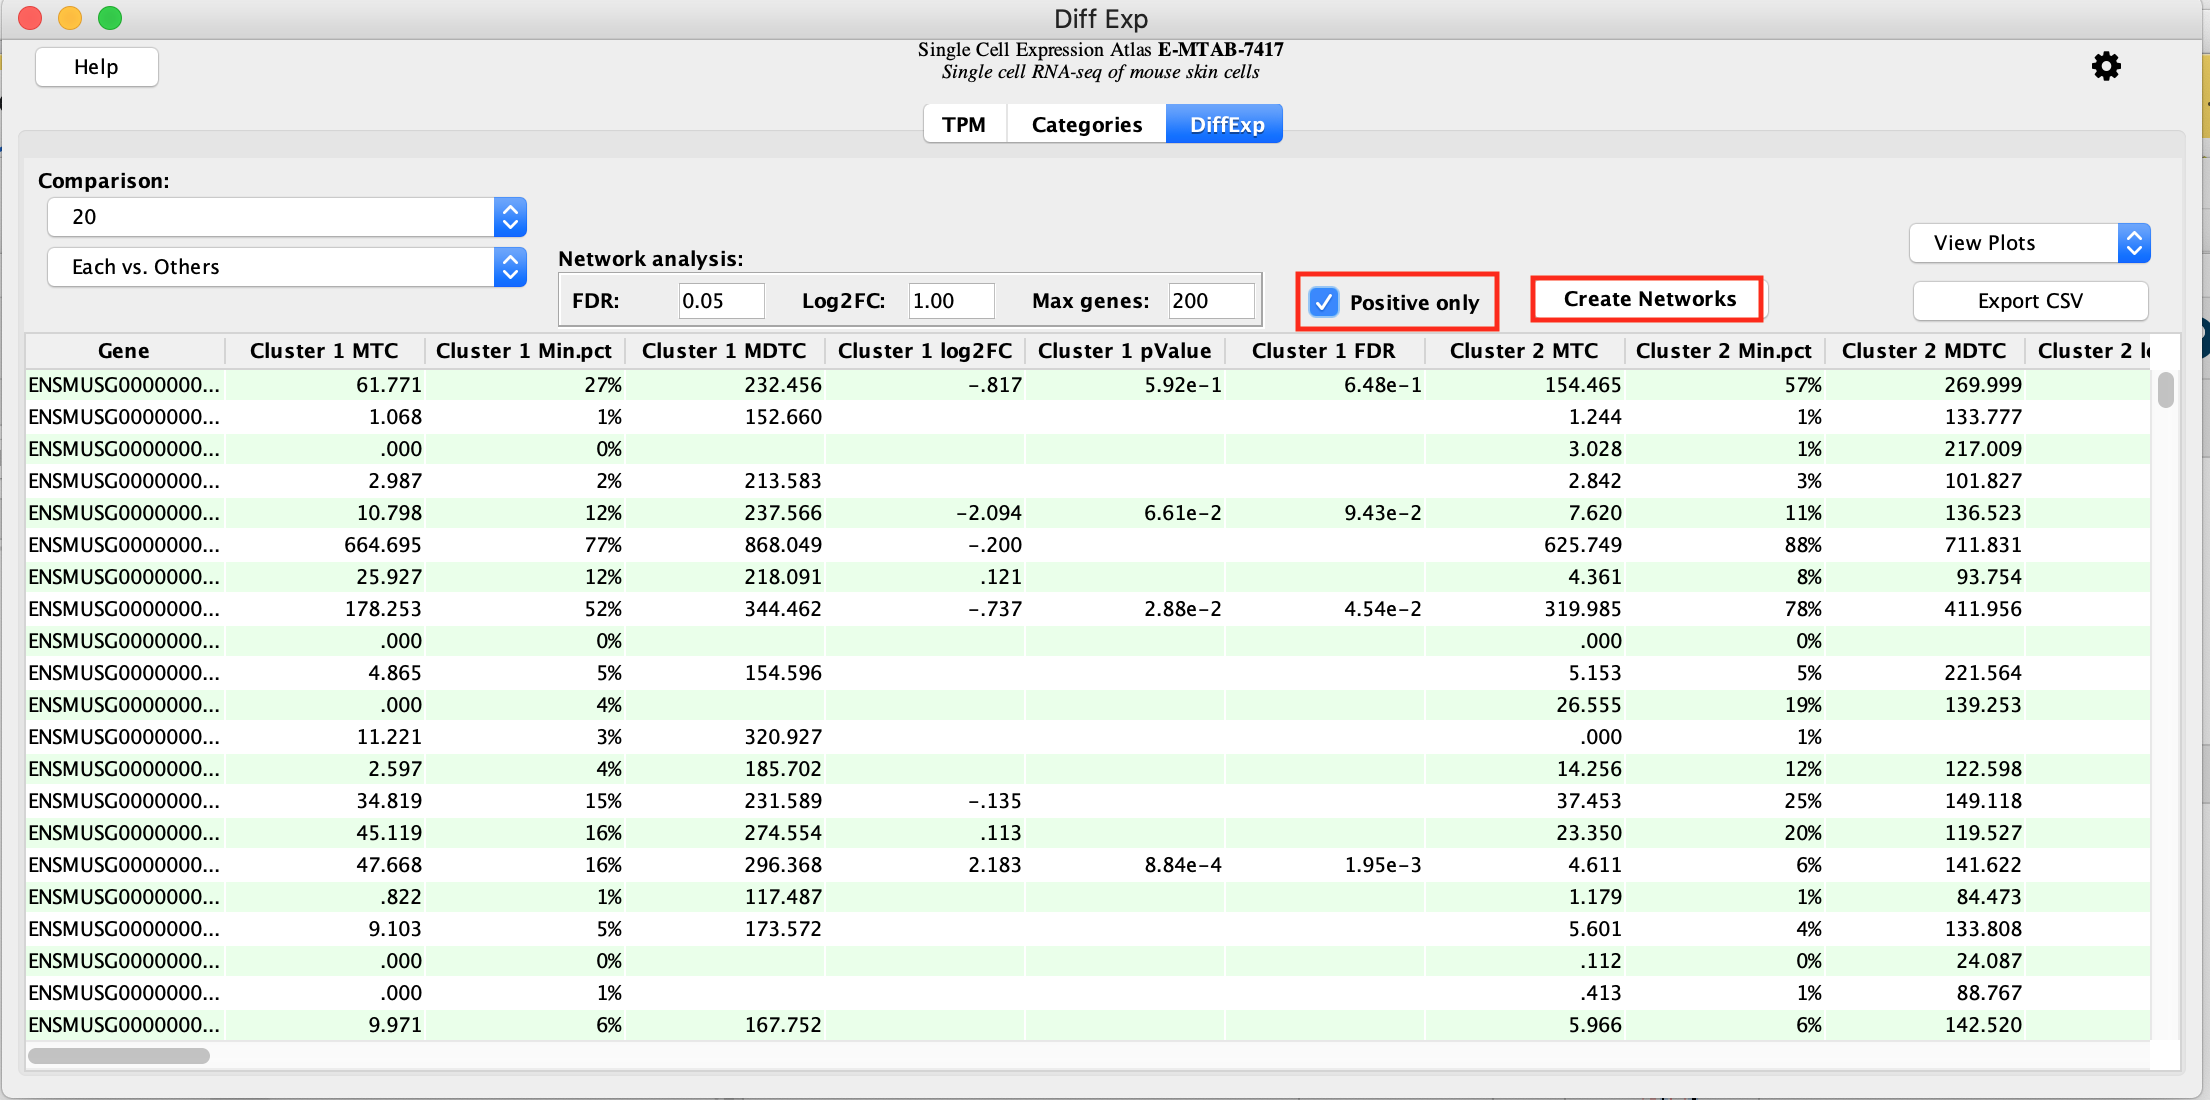
- Create a protein-protein network for each of the cluster marker genes:
- Check Positive Only (Because we are performing differential expression between each cluster vs. all remaining clusters genes with positive scores represent genes specific to the cluster and genes with negative scores are those specific to the remaining set of clusters. Therefore we are only interested in the genes that are positive and specific to a given cluster)
- click on Create Networks.
- For each cluster, a maximum of 200 genes that have a FDR 0.05 and a logFC >0 are selected to create each cluster’s representative network. (These parameters are adjustable.)
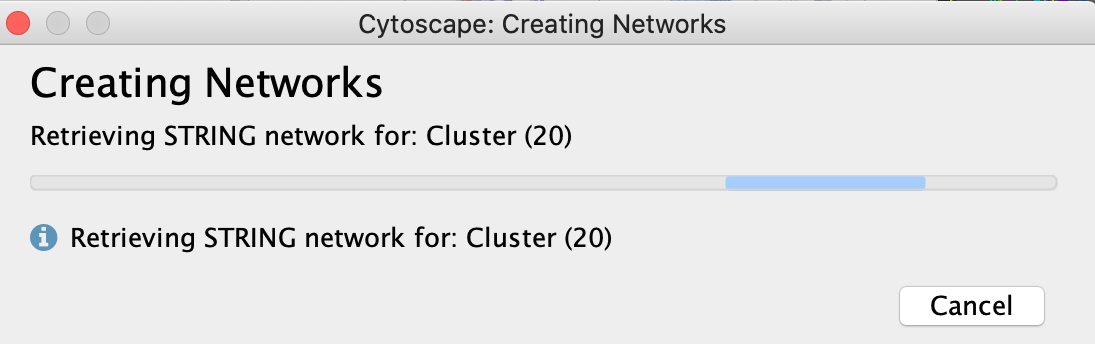
- As there are 20 networks to create, this step takes a few seconds.
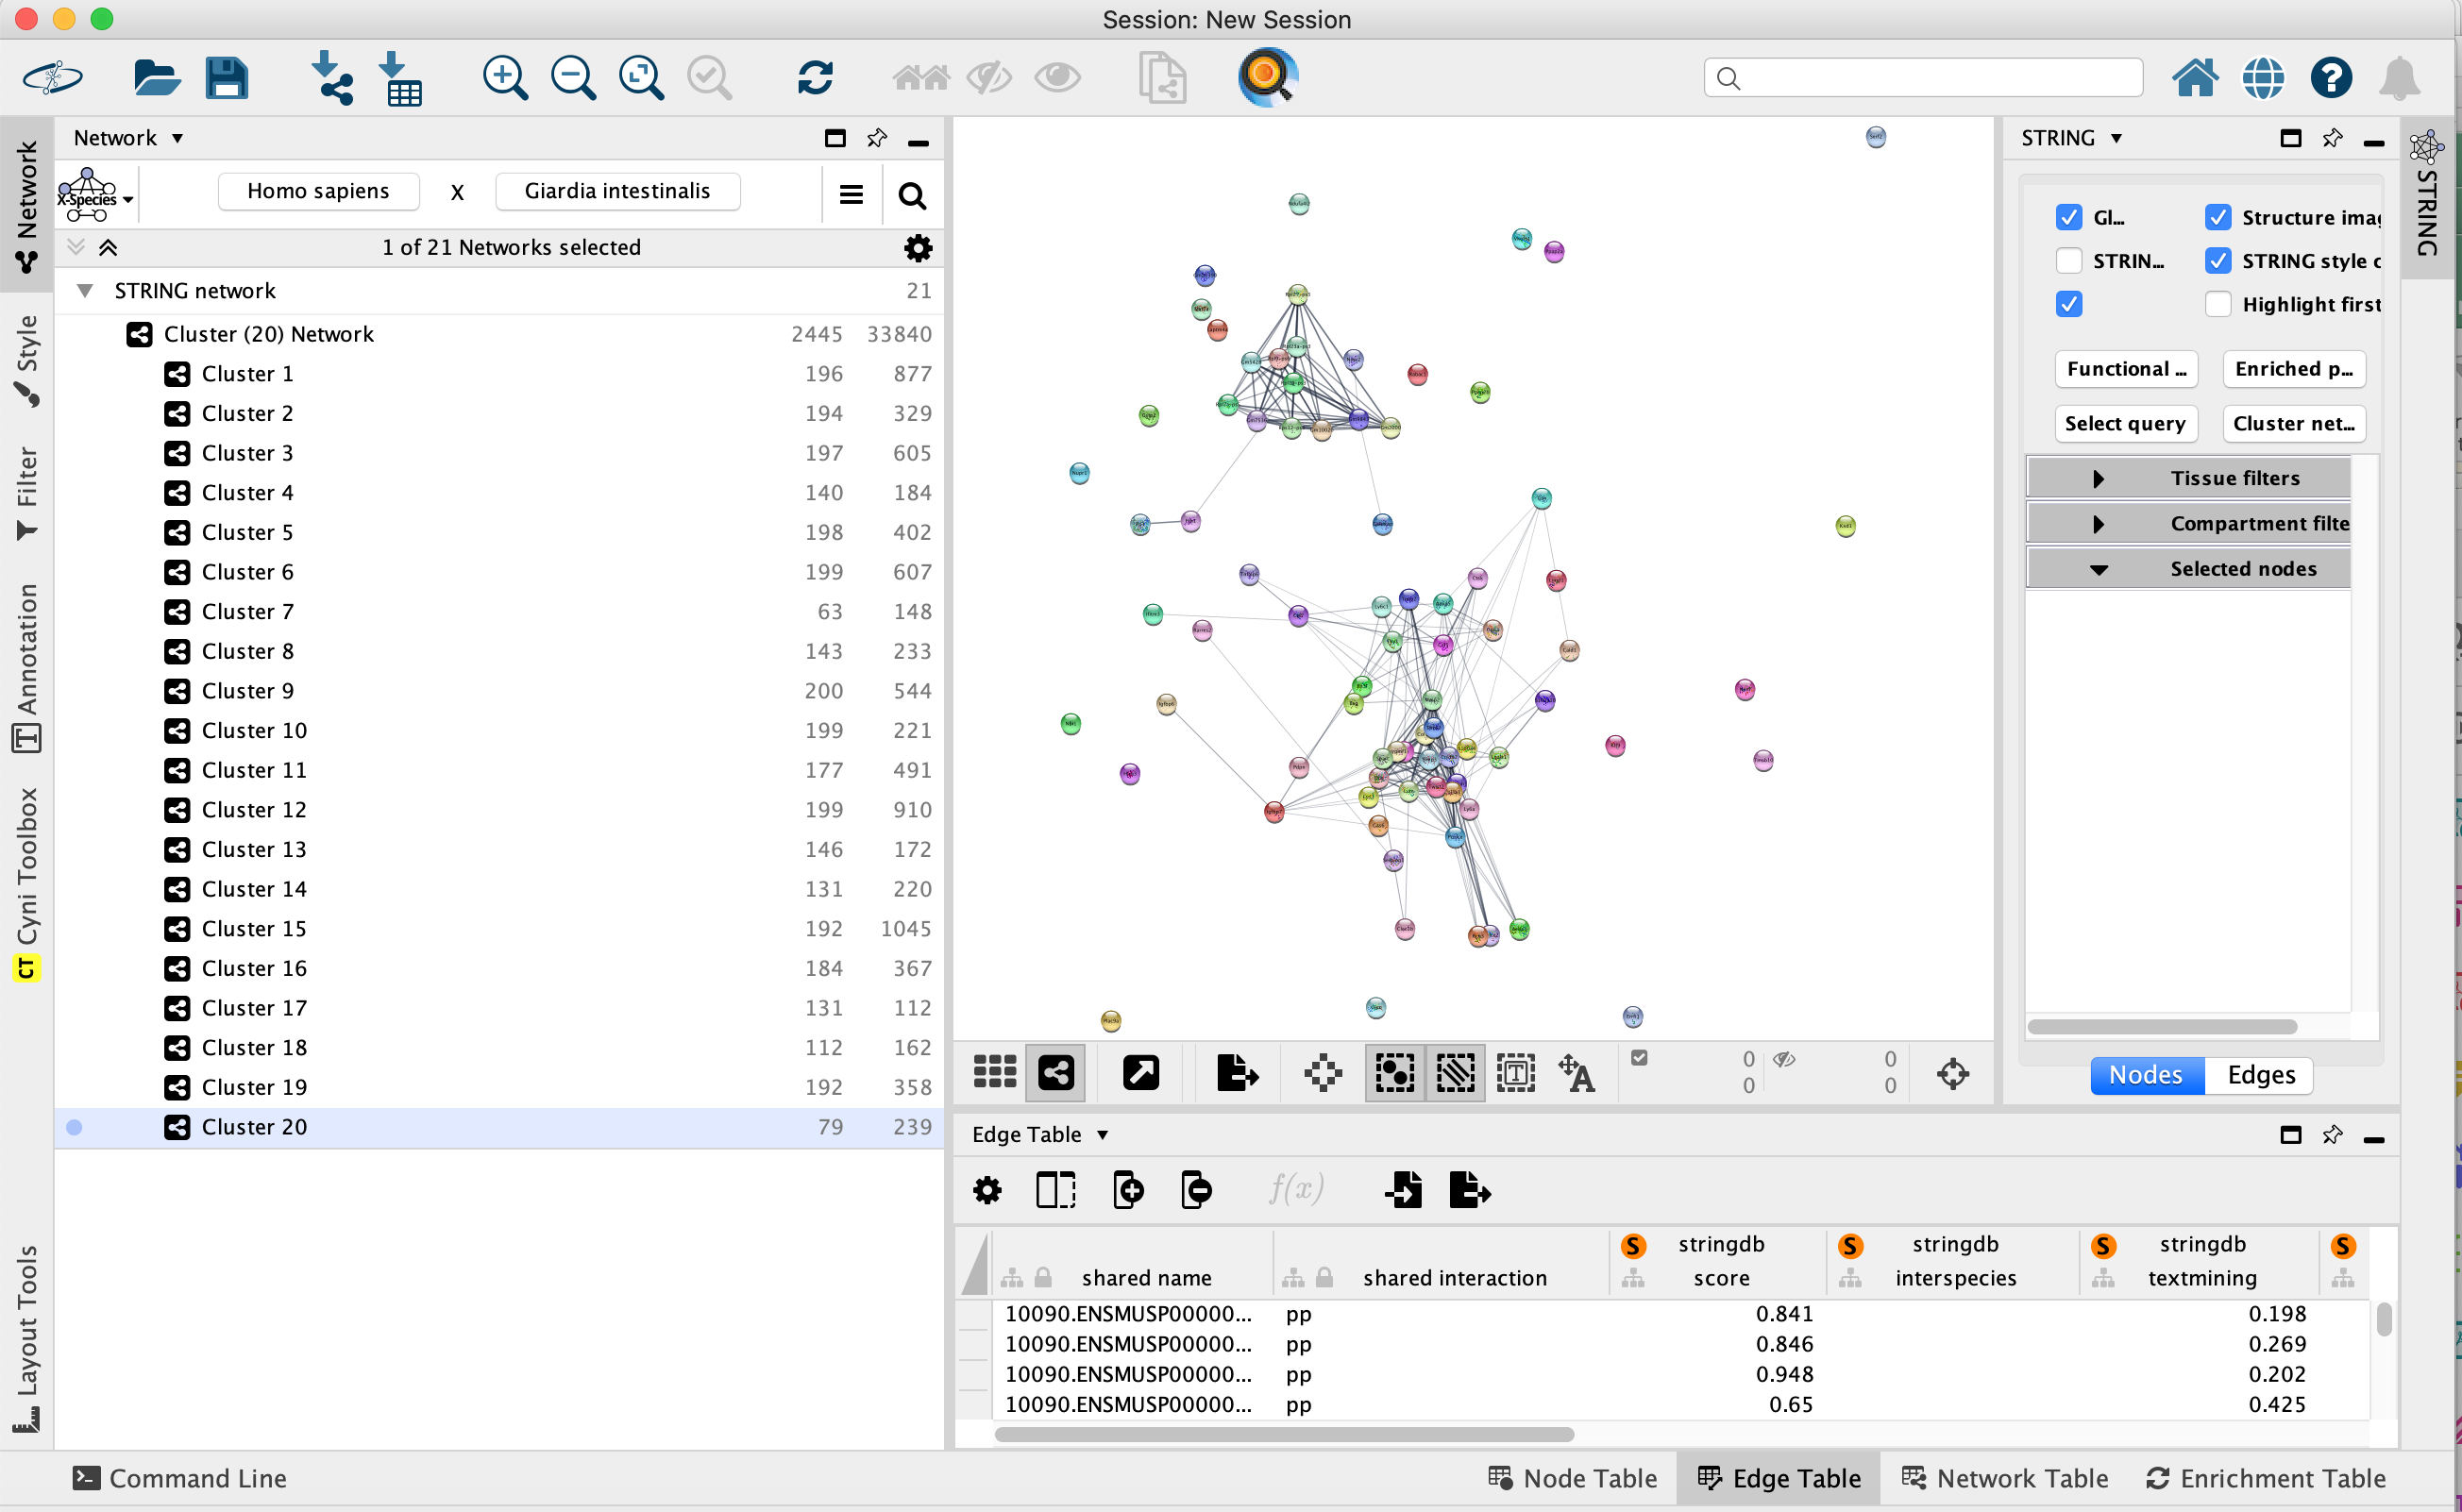
- Once created, the list of networks is visible in the Network tab in the control panel on the left. In the below picture, cluster 20 is selected and contains 79 genes and is displayed in the main network window.
- In the results panel on the right side, we can see the STRING app parameters, which were used to create the protein interaction networks. Nodes (genes/proteins) are connected with each other if they are known to associate or physically interact with each other.
Pathway Analysis of clusters
- The next step is to perform pathway analysis on one of these lists of genes/one of these clusters.
- Click on the network named Cluster 15. Cluster 15 has the highest number of connections: it contains 192 nodes (genes/proteins) and 1045 edges (associations/interactions).
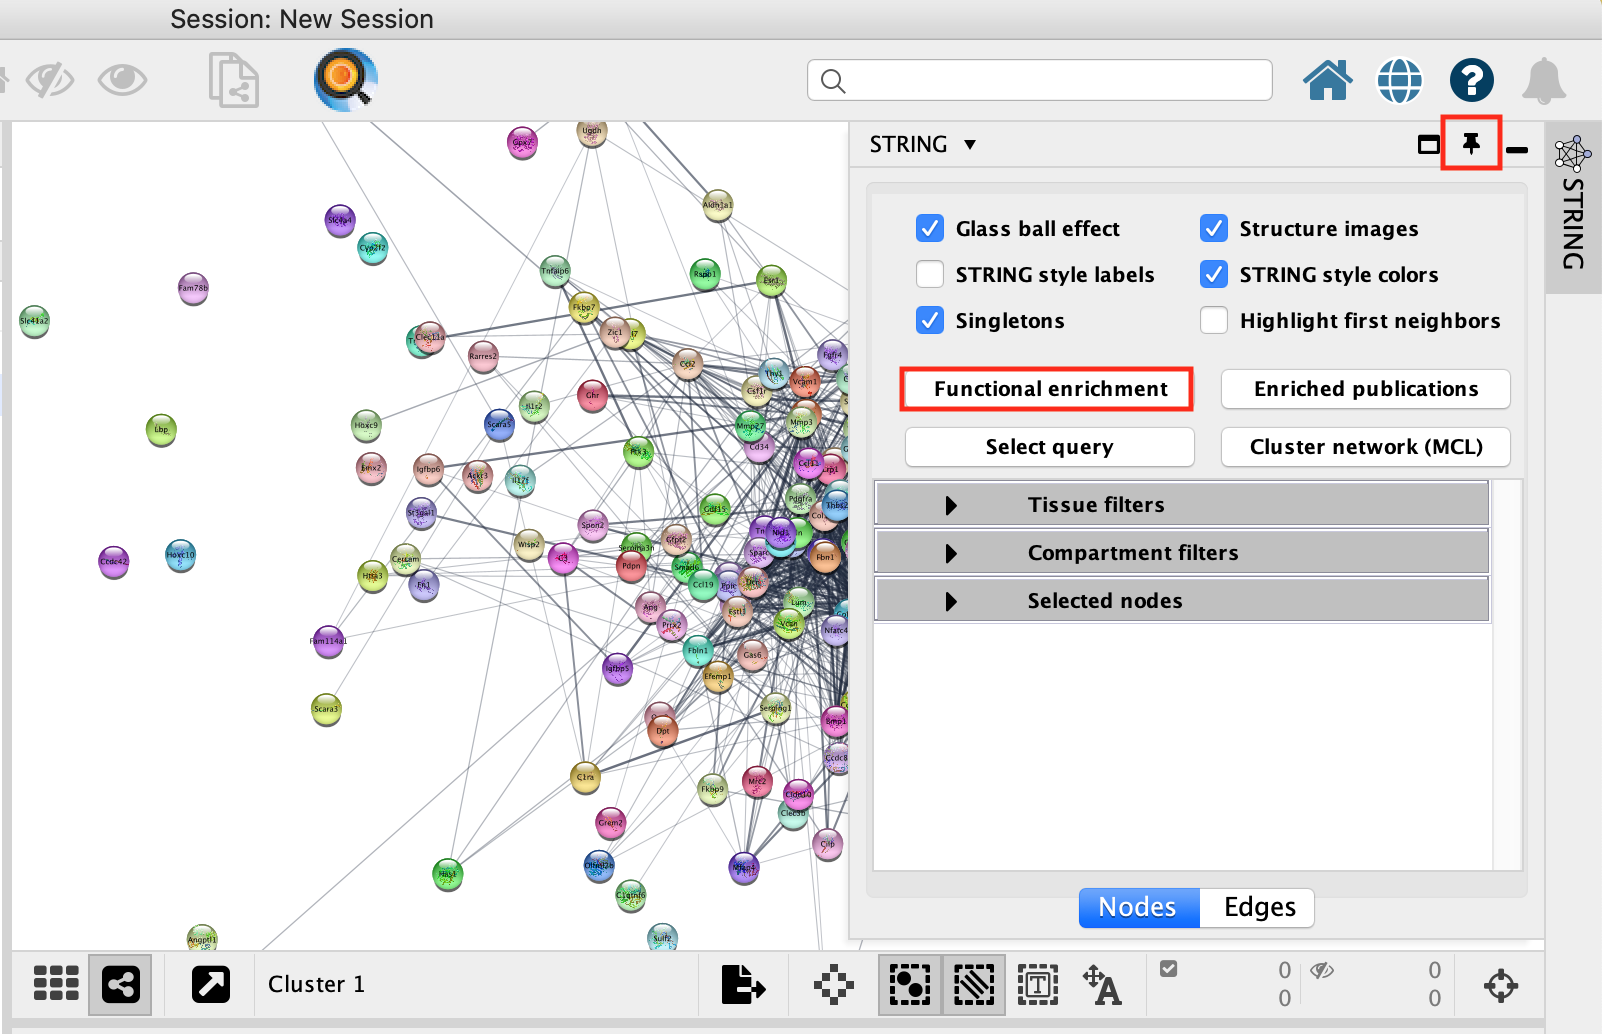
- Locate the STRING app tab in the results panel on the right, unpin it and make it larger.
- Click on Functional Enrichment.
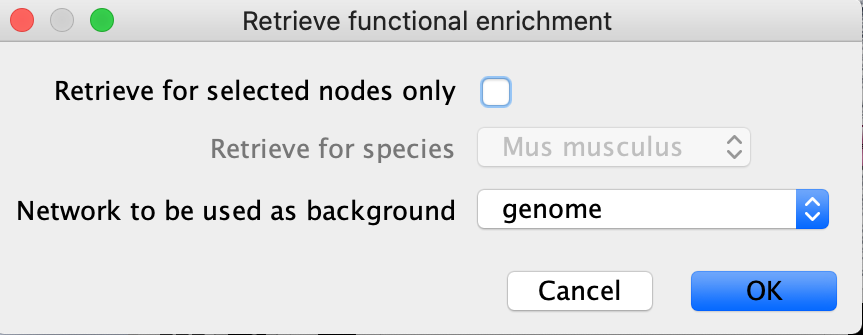
- A Retrieve functional enrichment window opens up. Click on OK.
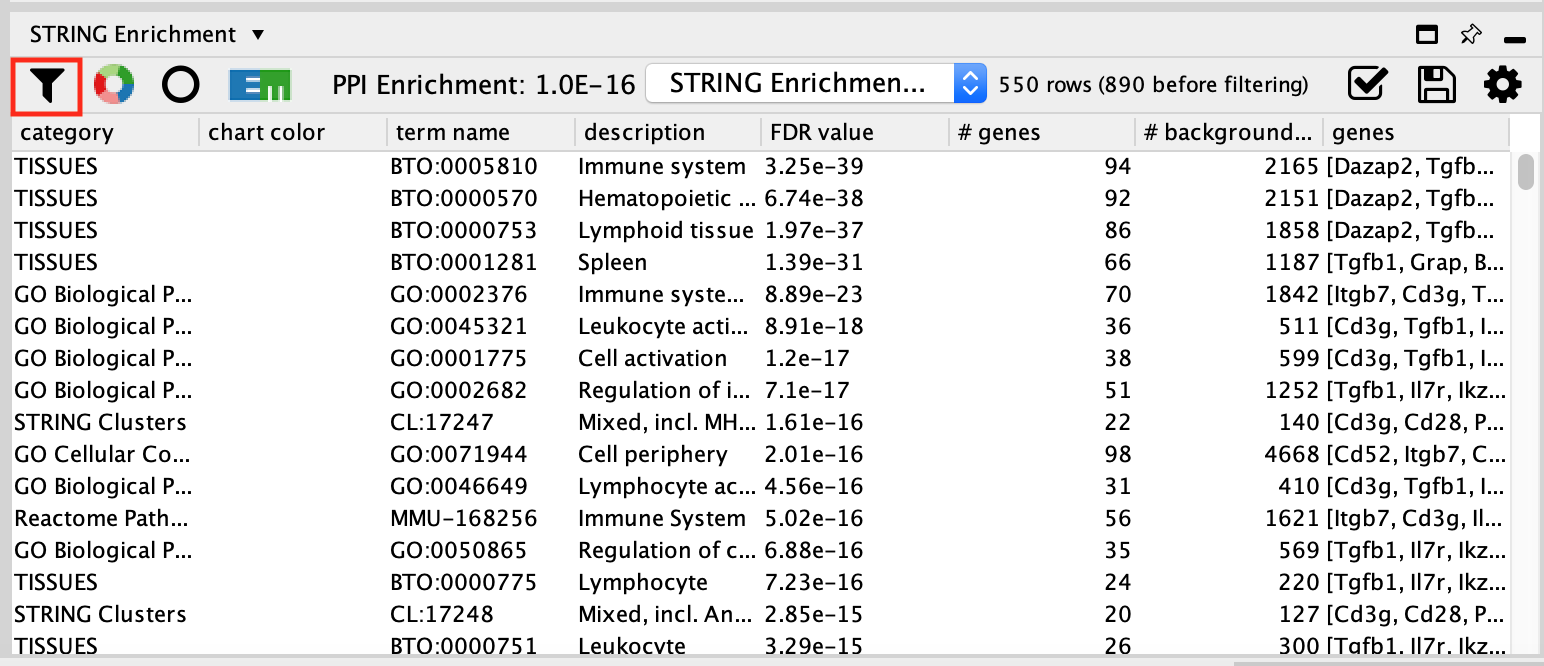
- The STRING enrichment table appears in the String Enrichment Panel below the network in the Table Panel.The pathways are ranked by FDR values of the enrichment.
- STRING app uses more than 15 source of pathways and gene-sets sources to calculate pathway enrichment. We can filter the results to display only the GO Biological Process results for clarity.
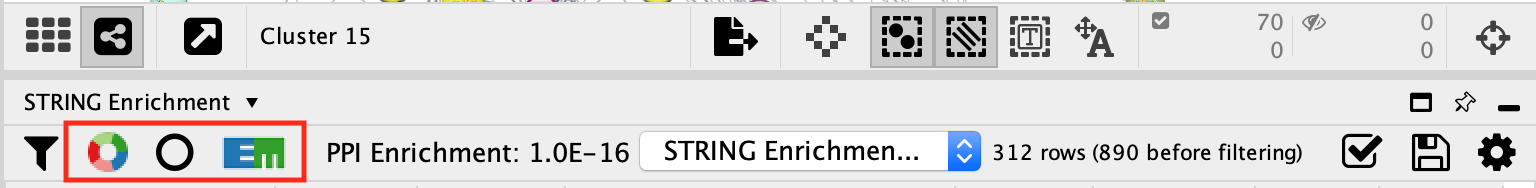
- Click on the funnel icon in the top left of the STRING enrichment table.
- Select categories GO Biological Process and click on OK
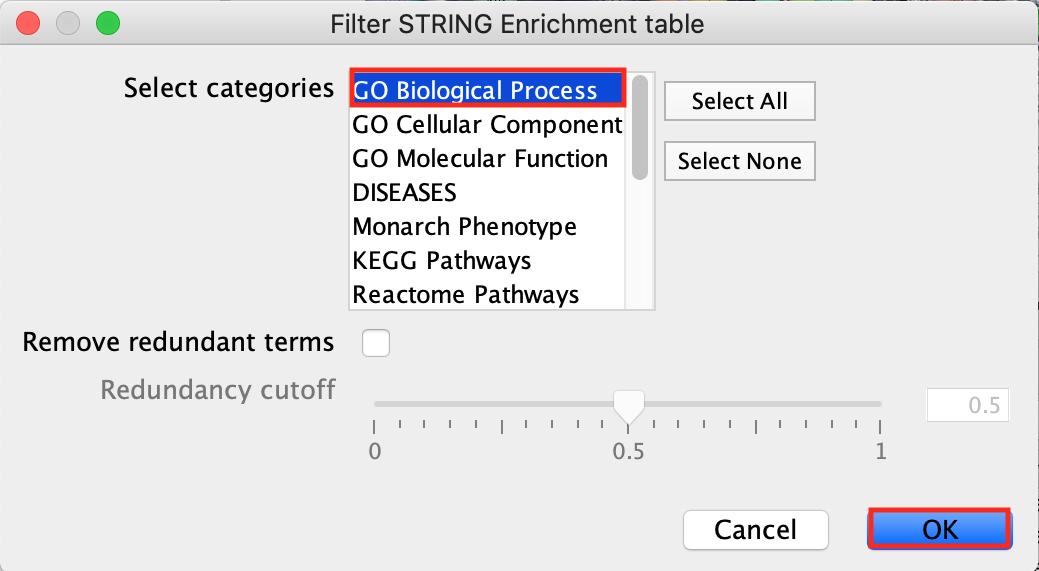
- Now the table contains only the results for the GO Biological Process pathways.
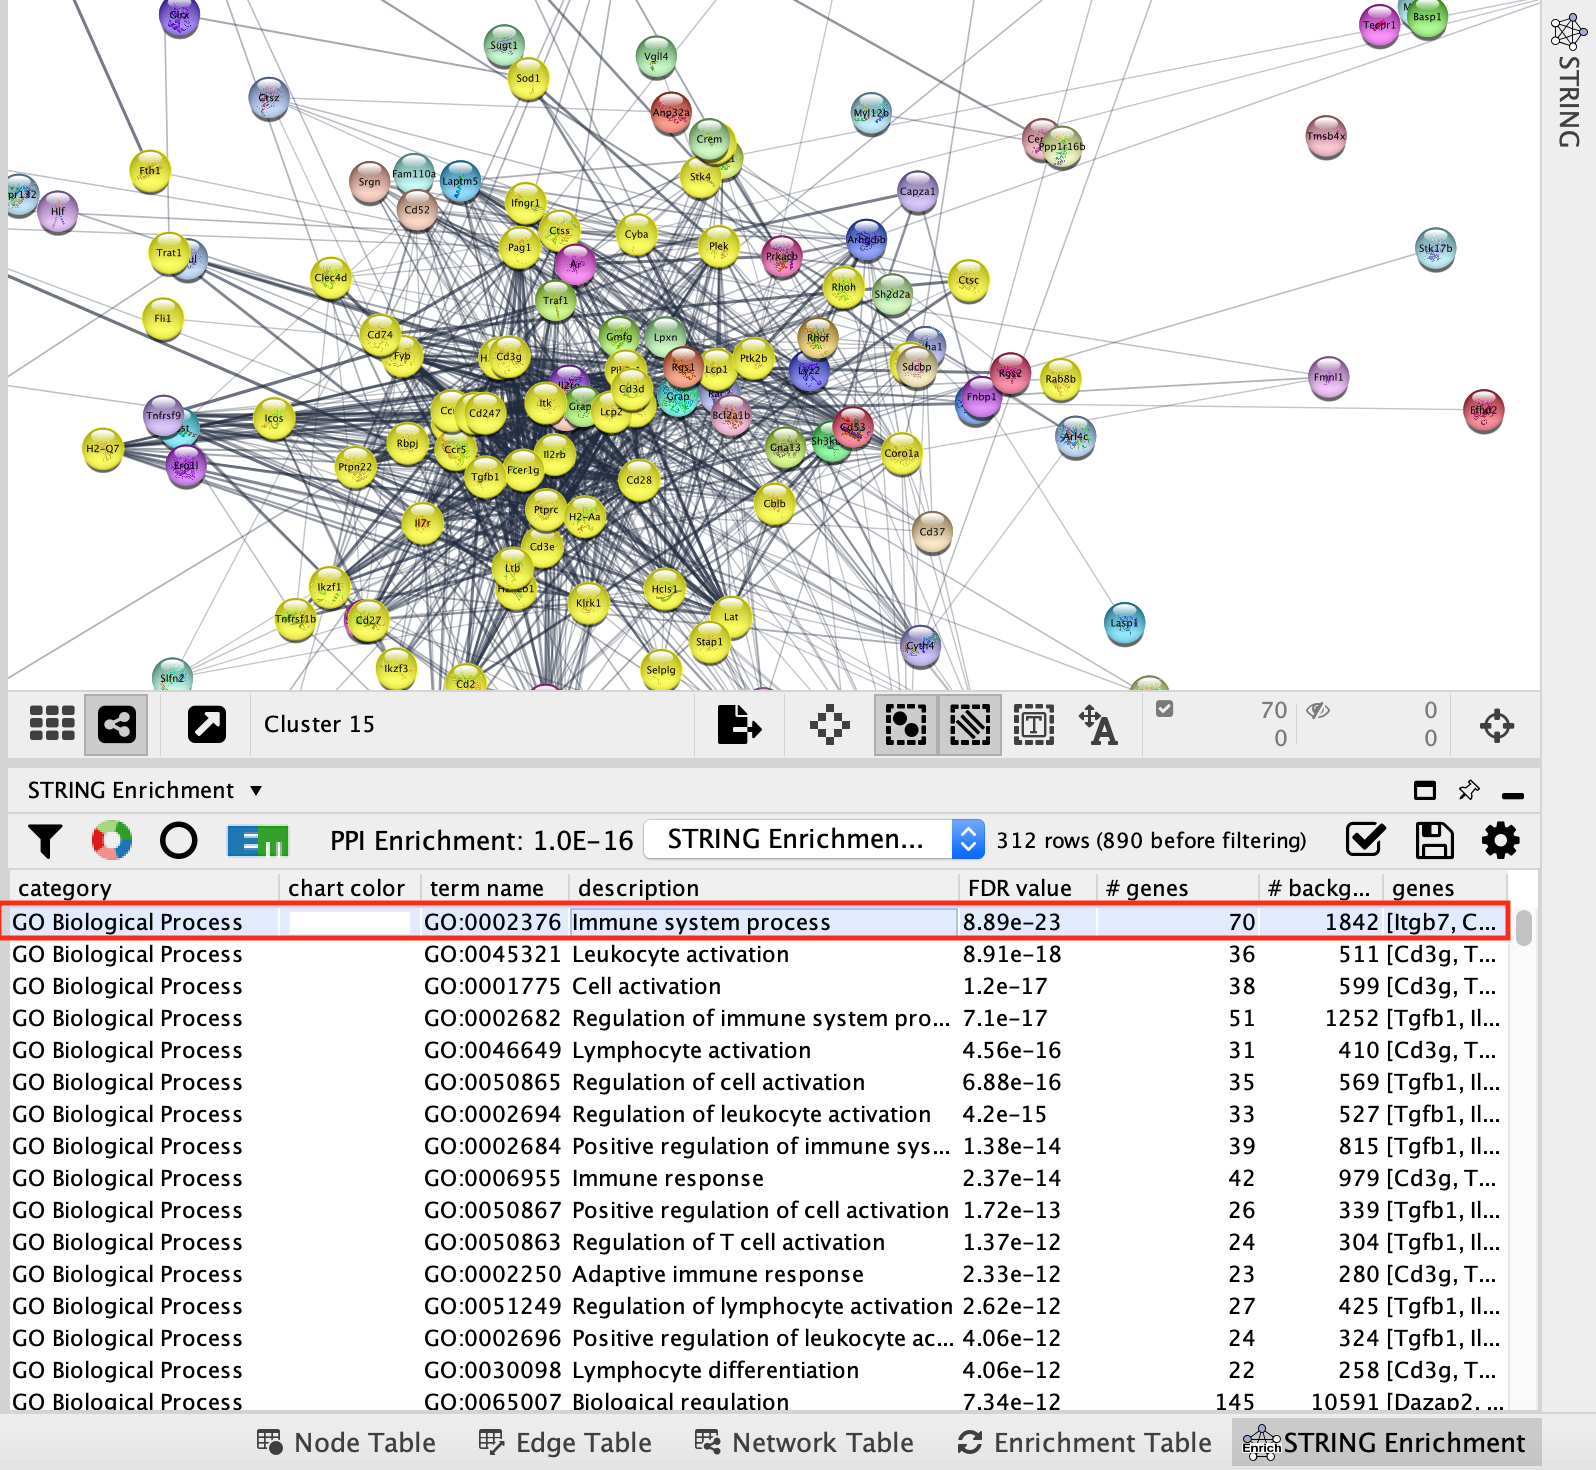
- Click on the top GO term. It will highlight in yellow all the genes annotated to this pathway contained in the network.
- Optional - Perform the same analysis on the remaining clusters.
- Here are the functional enrichment results for each cluster.
- Extracellular matrix
- Keratinization
- Tissue Development/ cell migration
- Skin development/Epithelial cell differentiation
- Regulation of metabolic process
- Angiogenesis/ Blood Vessel Development
- Tissue development/ Skeletal muscle cell differentiation
- Anatomical structure development. Nervous System Development.
- Muscle Structure Development
- Nervous System Development
- Tissue Development
- Small molecule Metabolic Process
- Response to endogenous stimulus
- Skin Development
- Immune system/Cell activation
- Tissue Development/Cell migration
- Lipid Biosynthesis
- Regulation of Cell motility
- Angiogenesis
- Regulation of Cell motility
This analysis highlights the heterogeneity of the skin tissue composed of differentiated keratinocytes but also epidermal stem cells, fibroblasts, endothelial cells, immune cells like T and B-cells and macrophages.
Pathway enrichment analysis with marker genes can help identify cell types based on the scRNA clustering and further steps might focus on clusters of interests only.
We took the top pathway to annotate the cluster. It is an arbitrary decision. STRING has a similiar interface to EnrichmentTable and has the option to create an enrichmentmap or enhanced graphics from the STRING pathway enrichment results see cytoscape primer for steps on how to use this feature. Combined with the AutoAnnote app, it might be a more thorough approach to explore the functions associated with each cluster.
color the nodes of cluster 15 proportial to the logFC
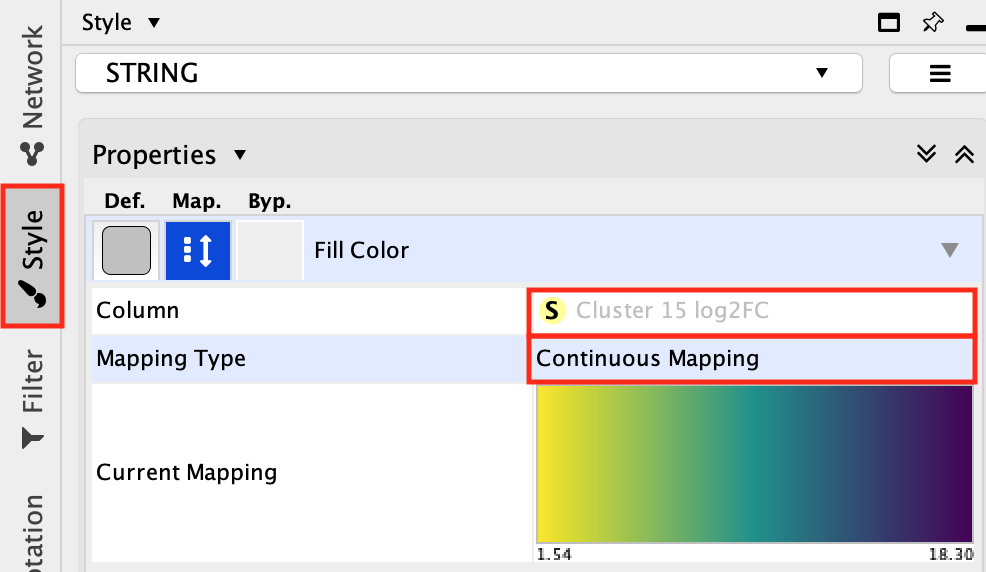
- Locate the Style tab and select the Fill Color. Expand it using the down arrow.
- In the column field, select Cluster 15 log2FC attribute
-
Double-click on the color gradient
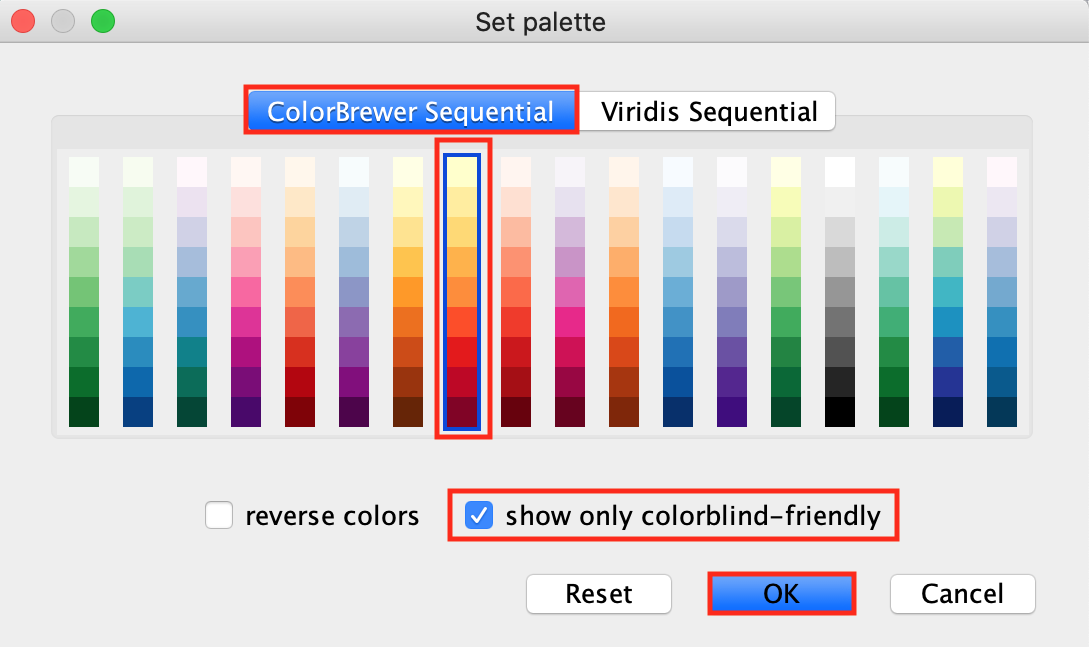
- Choose a color palette of your choice.
-
Option to choose colorblind-friendly color gradient is
available.
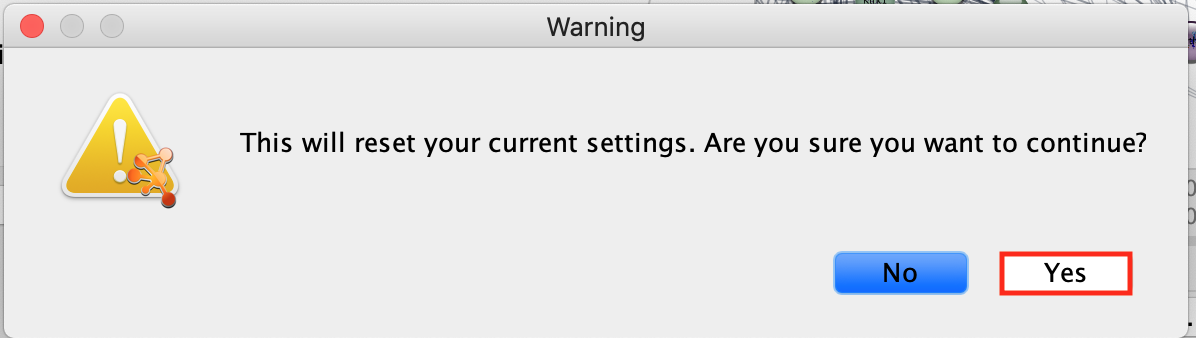
-
Click Yes on the message “This will reset your
current settings. Are you sure you want to continue?”
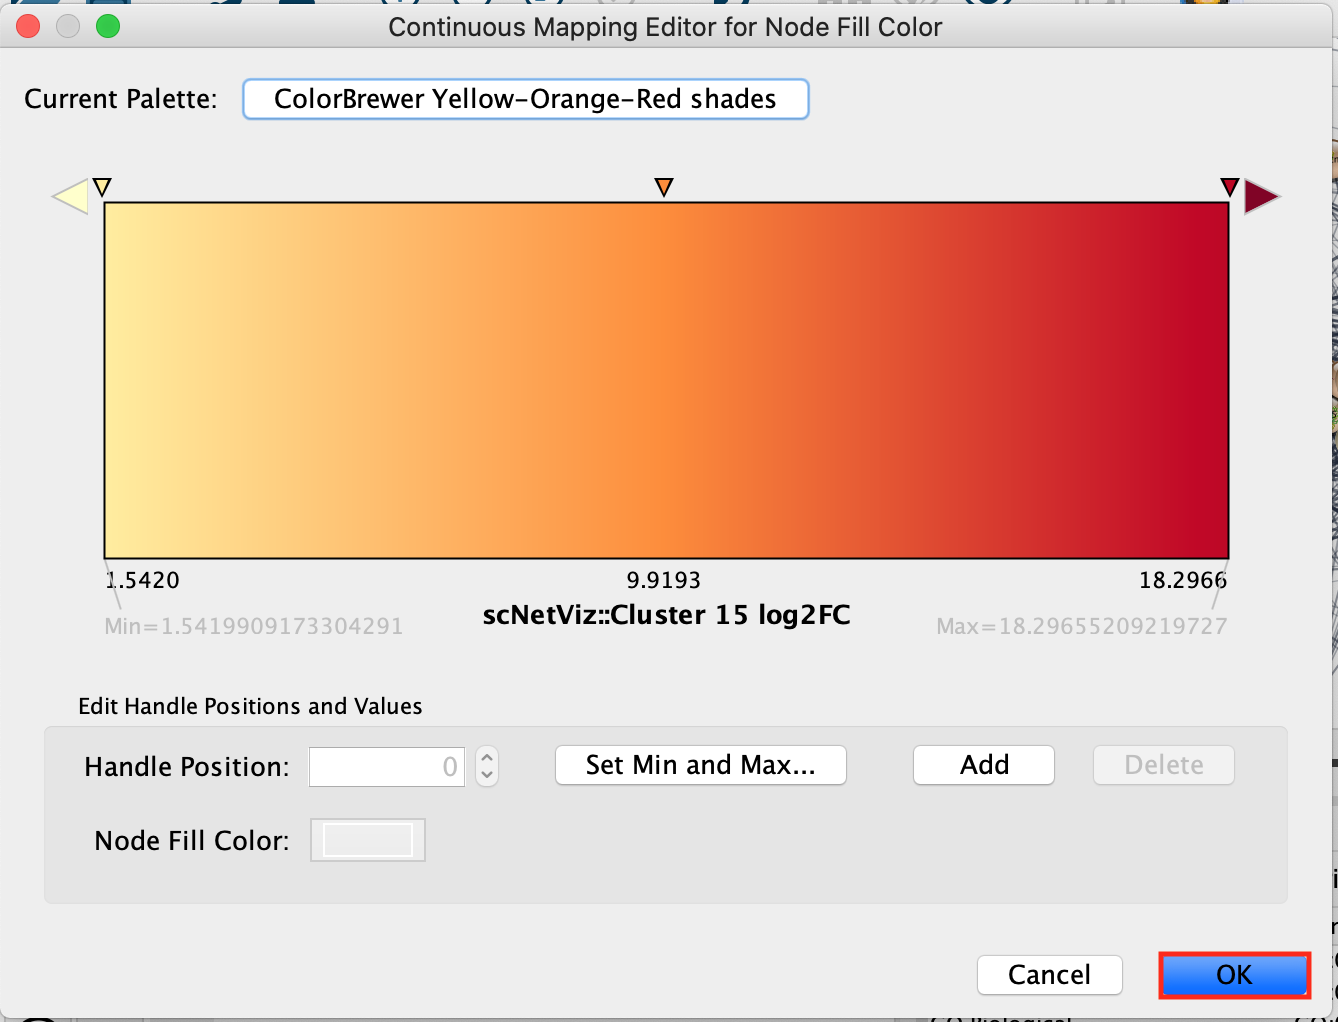
-
Another window called “Continuous Mapping Editor for Node Fill
Color” appears. Click on OK.
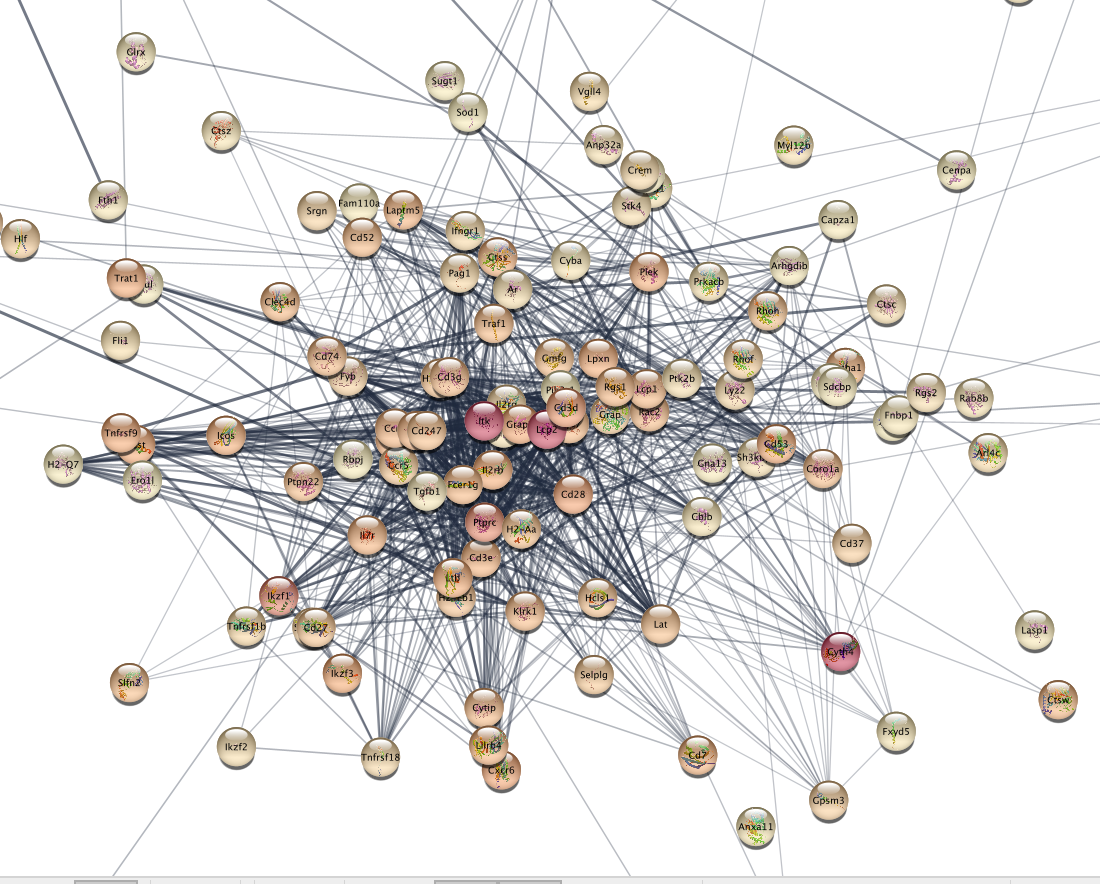
-
The nodes of the network are now colored using the logFC (fold
change) from the differential expression analysis. Red color indicates
the top cluster 15 marker genes.
Automation (for advanced users)
scNetViz provides its own automation commands and are useful for scripts to control scNetViz operations. Details available in the Swagger documentation (Help ! Automation ! CyREST Command API)) and in the scVIzNet reference paper.
scNetViz References
- video ISCB 2019: https://www.youtube.com/watch?v=GGpsWKD9iQE&t=36s
- reference paper: https://pubmed.ncbi.nlm.nih.gov/34912541/
- tutorial: http://www.rbvi.ucsf.edu/cytoscape/scNetViz/index.shtml